
A Dotcom-Monitor Waterfall Chart is a bar-chart type data visualization that sequentially displays both the individual performance and cumulative effect of individual webpage elements loading in a browser during the selected monitoring session.
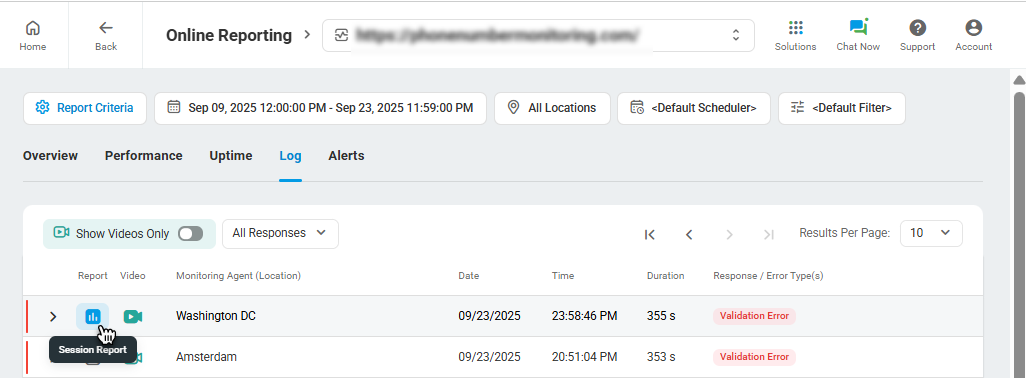
The Waterfall Chart is included in session reports and can be accessed directly from the Session Log page for the most recent 100 monitoring sessions or in the Online Report under the Log tab by clicking the chart icon in the corresponding session entry.
The waterfall chart displays the load time of individual components for each webpage element, including DNS resolution, connection time, start time, end time, speed, and other metrics depending on the element type. Hover over a network response bar in the chart to view a detailed response summary.

To view detailed network response information, hover over the corresponding record in the chart and click the information icon.

Find more details in the video walkthrough of the Waterfall Chart.