
Intro
If you have a collection of integration tests for internal API testing with Postman, but also need to set up tests from outside your local network, you can upload the Postman tests to Dotcom-Monitor.
Note that in most cases, Postman Collections are standalone and should be set up under separate HTTP devices. For details, see Limitations on Multi-Target Devices.
This article covers the technical configuration of Postman collection tasks. For an overview of Dotcom-Monitor’s Postman API monitoring service and how it compares to Postman’s built-in monitors, visit our product page. Please see how to protect sensitive information sent along with Postman requests in the How to Secure Data in Postman Requests with Dotcom-Monitor article.
-
What is Postman? A Quick Overview
What Is Postman? A Quick Overview
Postman is a platform utilized for the collaboration and development of APIs. Postman provides users with a variety of features, such as sending GET/POST requests from within the interface, integrating and automating API tests within CI/CD environments, documenting and sharing API development processes, and much more. Postman helps to shorten and optimize the API development cycles. There are similar, alternative tools to Postman in the market today, such as SoapUI, Fiddler, Swagger, Katalon Studio, and others, but Postman is one of the more popular and widely used tools out of the bunch.
Postman Collections
Postman Collections are a set of organized API requests that can be shared or exported. For organizations that have many teams or developers, Postman Collections offers an easy way to have groups or individuals review, add, and organize the various requests within an API. This ensures everyone is working with the latest version, that the requests are working as intended, and to catch any bugs that may be hindering performance.
Why Use Dotcom-Monitor to Monitor Postman Collections
Postman is a very robust API development platform and offers a ton of great features and benefits. One of these features is the ability to monitor API performance from within the platform itself. However, there are a few caveats and limitations when it comes to monitoring Postman Collections.
Postman offers monitoring for all their plans, from their Free plan to their Enterprise plan. Depending on the Postman package the user is utilizing for their API development, the monitoring functionality, and related features may differ.
For example, the free version of Postman is limited to 1,000 API calls per month, while their Team, Business, and Enterprise plan all include 10,000 API calls per month. Postman does offer a pay-as-you-go API call option for an additional fee, if necessary, for your organization. Furthermore, monitoring frequency can only be set as low as every 5 minutes. The Dotcom-Monitor platform allows for monitoring checks from as frequent as every minute to every 3 hours, giving the team plenty of flexibility and options for setting monitoring checks.
Monitoring Locations
Where you set up monitoring is critical for understanding ongoing API performance from the locations where your users are located. The number of monitoring locations within Postman is limited to only 6 locations, which is another reason why using a third-party monitoring solution like Dotcom-Monitor is essential. Dotcom-Monitor offers 30 locations around the world, in addition to monitoring from behind the firewall, offering users more flexibility when setting up their monitoring devices for monitoring uptime and availability of their APIs and Postman Collections.
Monitor Postman Collections with Dotcom-Monitor
-
What is a Postman Collection and Postman Runner?
What Is a Postman Collection and Postman Runner?
Within Postman, users have a couple of options when it comes to running API requests. They can choose to run requests individually or select the Runner option to run all the requests within a given Postman Collection. Selecting the Runner option will open all the saved Collections, and from here, users can run whichever Collection they would like to. Users can also change the order in which requests are executed or remove certain requests.
Additionally, Postman users can configure the Collection Runner by selecting the appropriate environment, the number of iterations, delays (in milliseconds) between each request, or including data variables. After running the Collection, users view and filter which requests were successful or failed as well as the timings of each request. Postman also integrates with Newman, so users also have the option to run their Postman Collections within the Newman CLI (Command Line Interface), but since Newman runs on Node.js, this must be installed prior to running Newman.
Preparing a Postman Collection
Before you begin the device configuration, prepare the Postman Collection to be imported to the Dotcom-Monitor solution as described in the Uploading Postman Collection to Dotcom-Monitor Knowledge Base article.
If you want Dotcom-Monitor to generate alerts and send alert notifications on responses with errors, add response validation to your Collection in Postman before import.
Setting Up Postman Collection Monitoring
Setting up the Postman Collection monitoring device allows you to create automated monitoring tests of your Postman Collections. For a quick overview of how to create a monitoring device, please read the Creating a Monitoring Device Knowledge Base article.
You can also configure your Postman Collection monitoring device with a variety of options, such as alerting on errors that occur while monitoring, specifying monitoring locations, as well as configuring your monitoring scheduler, and filters, and setting up reporting on monitoring results. Dotcom-Monitor clients can select from 30 monitoring locations around the world, providing more options that better match where your users and customers are located, and ultimately giving more realistic monitoring data.
The collection of requests will repeatedly be executed with the specified frequency to perform the sequence of calls to the target web API. Thus, the assertions that were specified for the requests in Postman will be used to verify API responses. If any condition set by assertions is not met, the device will be marked as failed.
If you are going to set up monitoring for a group of Postman Collections, we recommend you set one collection per device. For details, see the Limitations of Multi-Target article of our wiki.
Configuring Request
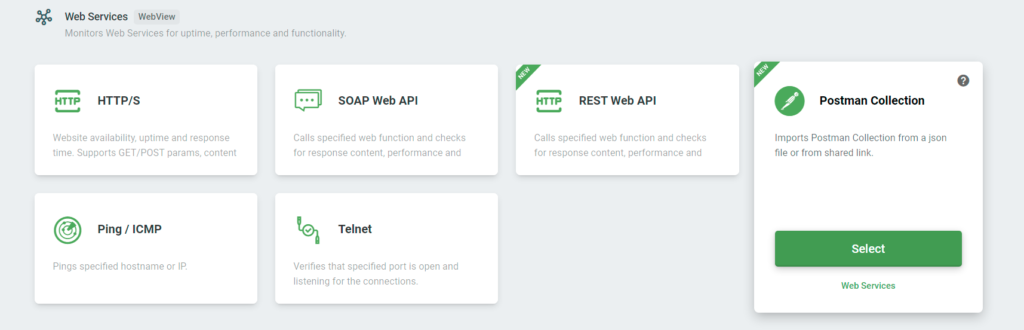
Once you have selected the Postman Collection monitoring device, you will be prompted to import a Postman Collection and adjust the target settings based on your requirements.
Importing Postman Collection
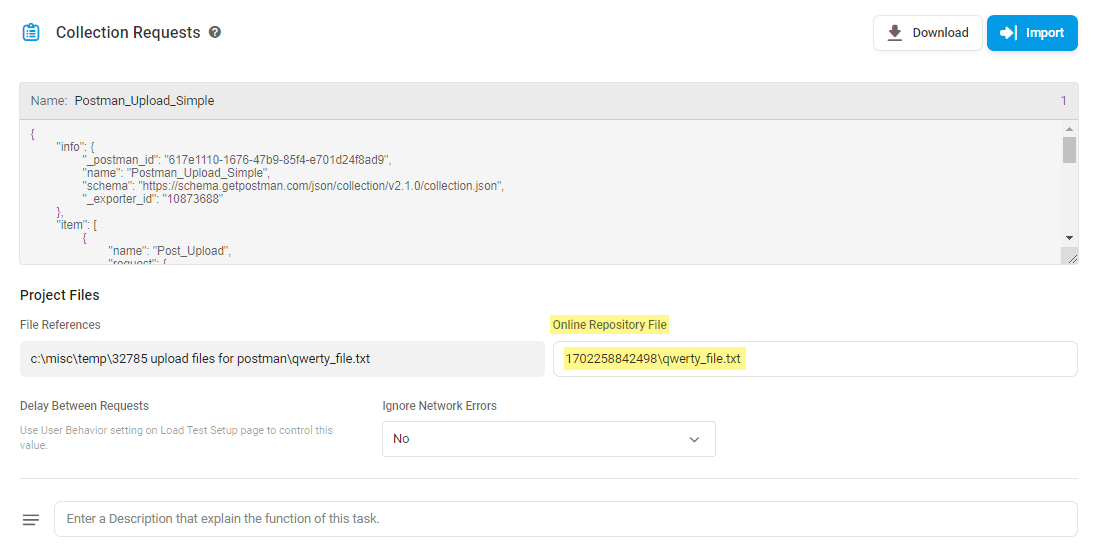
Click Import and select a suitable option to upload the collection. You can upload the JSON file with the Postman collection or if the Postman Collection was published publicly, provide the public link to the collection. The Postman Collection script will be displayed in the Collection Requests section.
If your Postman Collection contains a reference to a file, once imported into Dotcom-Monitor the name of the file will be shown in the Project Files section.
The system automatically generates an online repository path to store the file in the Dotcom-Monitor cloud. The path appears in the Online Repository File field. To use the file in your monioring test, you need to upload the file to the provided repository.
To upload the file to the online repository, please make sure to save the device, and then create a support ticket with the following information:
- The name of the Postman Collection device.
- The Online Repository File path as appears in the test target settings.
- A copy of the file to upload. Please attach the file to your ticket.
Please allow some time for our team to process your request.
Delay Between Requests
The Delay Between Requests, measured in seconds, is the time between each request in the collection. By default, we use the Delay time set in Postman Collection Runner. The delay time is considered in the response time calculation.
Ignore Network Errors
Network errors may include DNS resolution errors, TCP connection timeouts/errors, or instances where the server terminates or resets the connection with a 4xx or 5xx response status code (and no data).
By default, Dotcom-Monitor generates alerts and sends alert notifications on Postman network errors that occurred while the collection execution. If network errors are not your concern, you can configure the system to filter out this type of error. If the Ignore Network Errors option is set to Yes, Dotcom-Monitor will not raise an error on failed Postman requests and change the device status to Alerting. However, you will be able to see HTTP errors in monitoring session reports.
Collection Timeout
The Collection Timeout, measured in seconds, is the length of time the device should wait for the requests to complete and collection execution before ending the task and returning an error.
Request Timeout
The Request Timeout interval, measured in seconds, is the length of time the device should wait for a response to a single request from the collection.
Script Timeout
The Script Timeout interval, measured in seconds, is the length of time the device should wait for the assertion script to complete before ending the task and returning an error. The maximum script timeout is 30 seconds.
Prepare Script
See the Using Prepare Script and Post Script article.
Postman Monitoring FAQ
To view response time by request and status codes for each request in the collection, open the Device Overview Report.
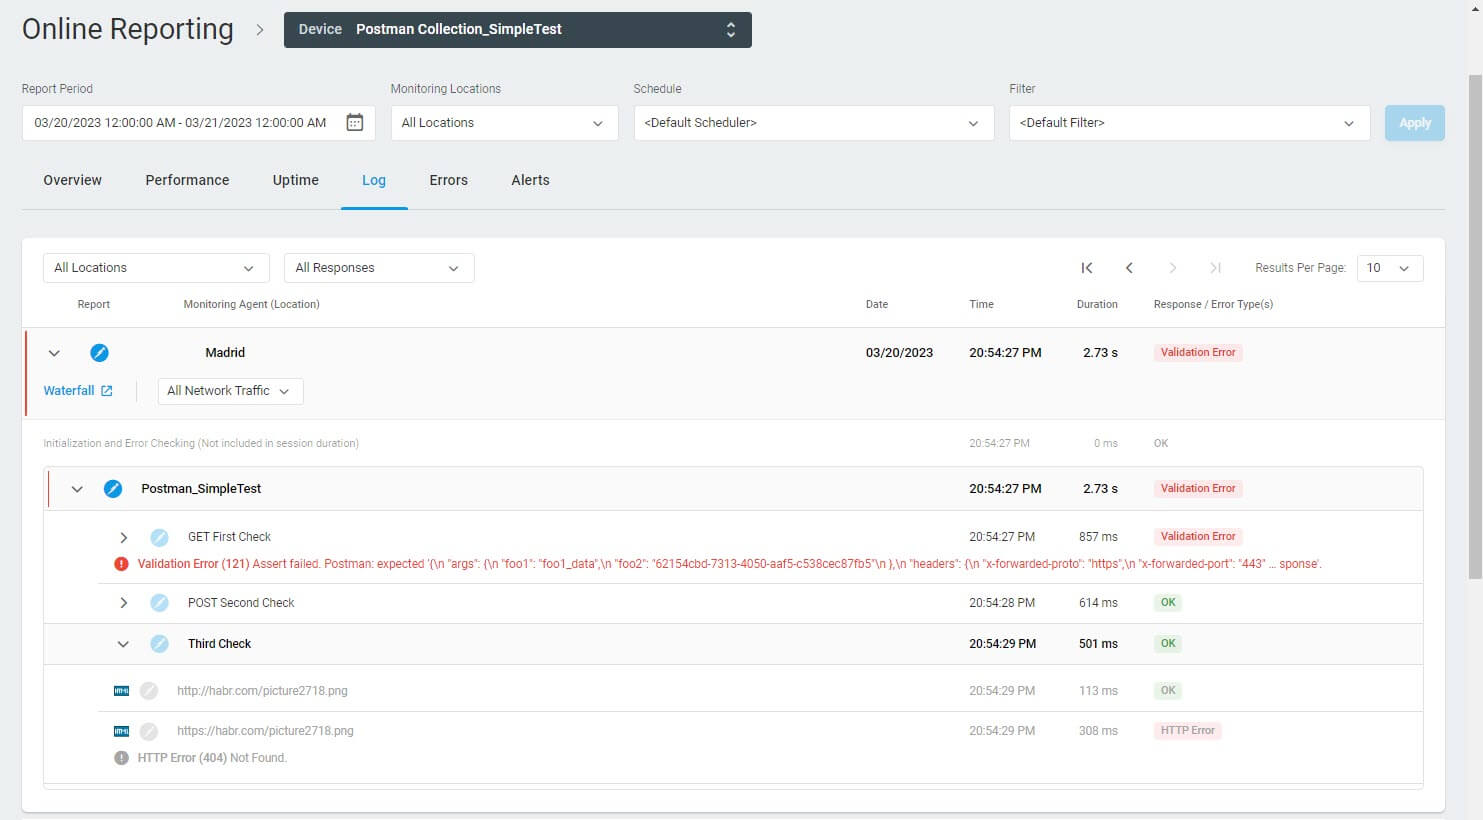
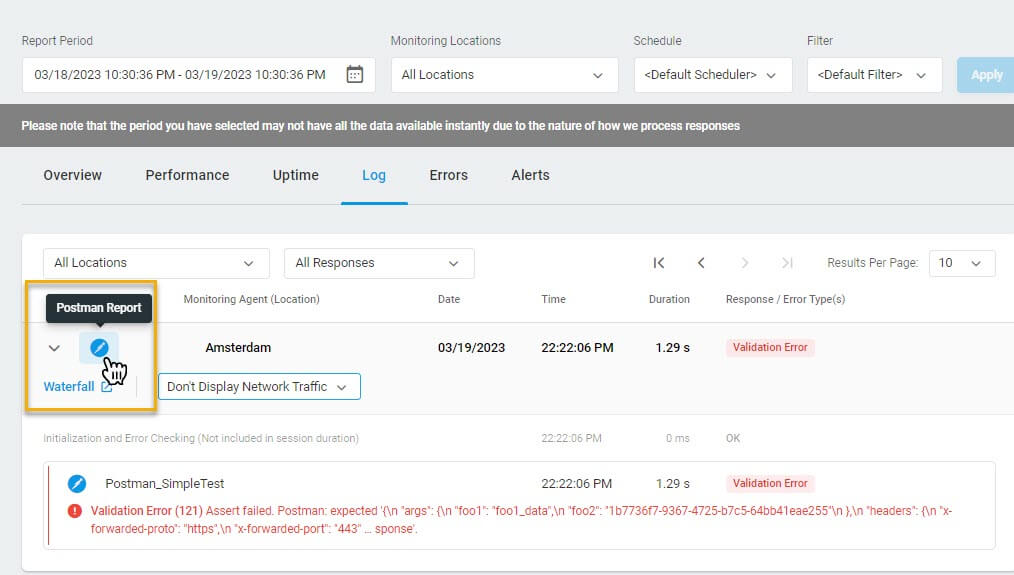
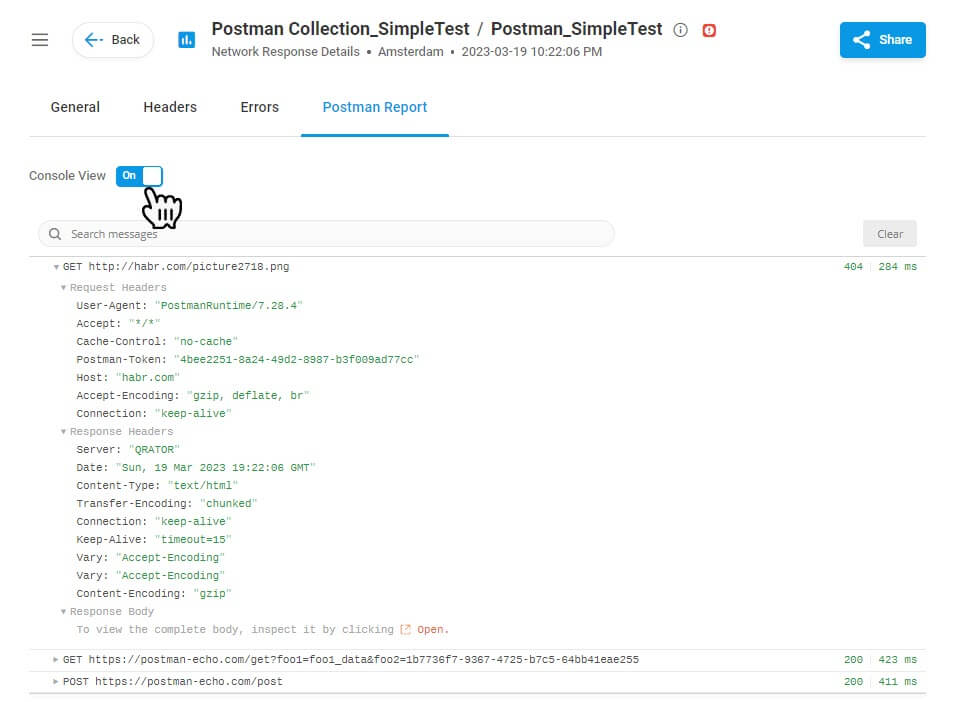
To inspect Postman Collection request details, use the Console View in the Postman Report.
First, open a detailed Postman Report from the Device Overview Report.
Then switch to Console View to review logged request details, including request headers, variable values, and response bodies.
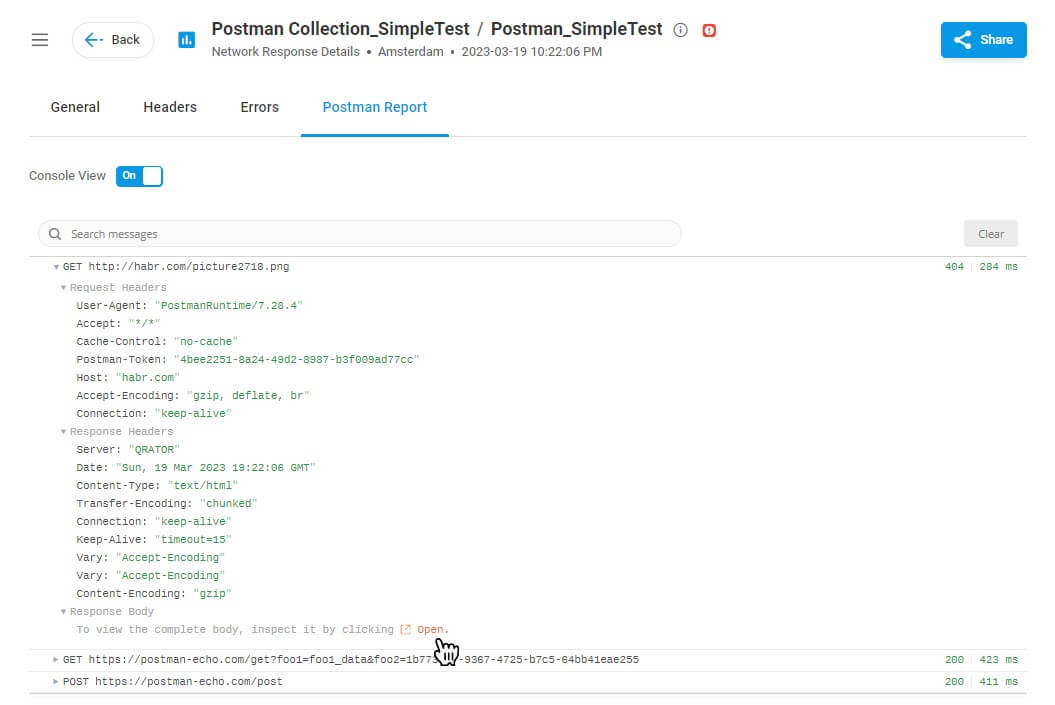
To view server responses to Postman requests:
- Open the corresponding Postman Report fromDevice Overview Report.
- Switch to Console View.
- Locate the request and click the Open link in the Response Body section.
Performance Testing with LoadView Load Testing Postman Collections
If you are looking to test your Postman Collections and API behavior under load, the LoadView platform provides cloud-based performance testing using real browsers and offers the features and functionalities you and your teams need to easily create and execute load tests. No more costly and time-consuming performance testing infrastructure requirements. With LoadView, you can choose from over 20 worldwide testing locations, simulate hundreds to thousands of concurrent users, choose from different load testing curves, and much more. Quickly find out how your Postman Collections and APIs will handle pre-determined traffic volumes and where performance bottlenecks may be present.
For more information on setting up and load testing Postman Collections with the LoadView solution, read our tutorial on Postman load testing for more detailed information.