
If you use the Time Watcher option of the EveryStep Scripting Tool to measure the execution time of some parts of your load testing script, you can use your load test Session Log to pull statistics on the Time Watcher results. For example, you can calculate the average of the login step execution times measured during all sessions executed within the test.
In this article, we will learn how to use your load test report data to gather required Time Watcher statistics.
If you need more details on how to set up the Time Watcher option, please see the Time Watcher article.
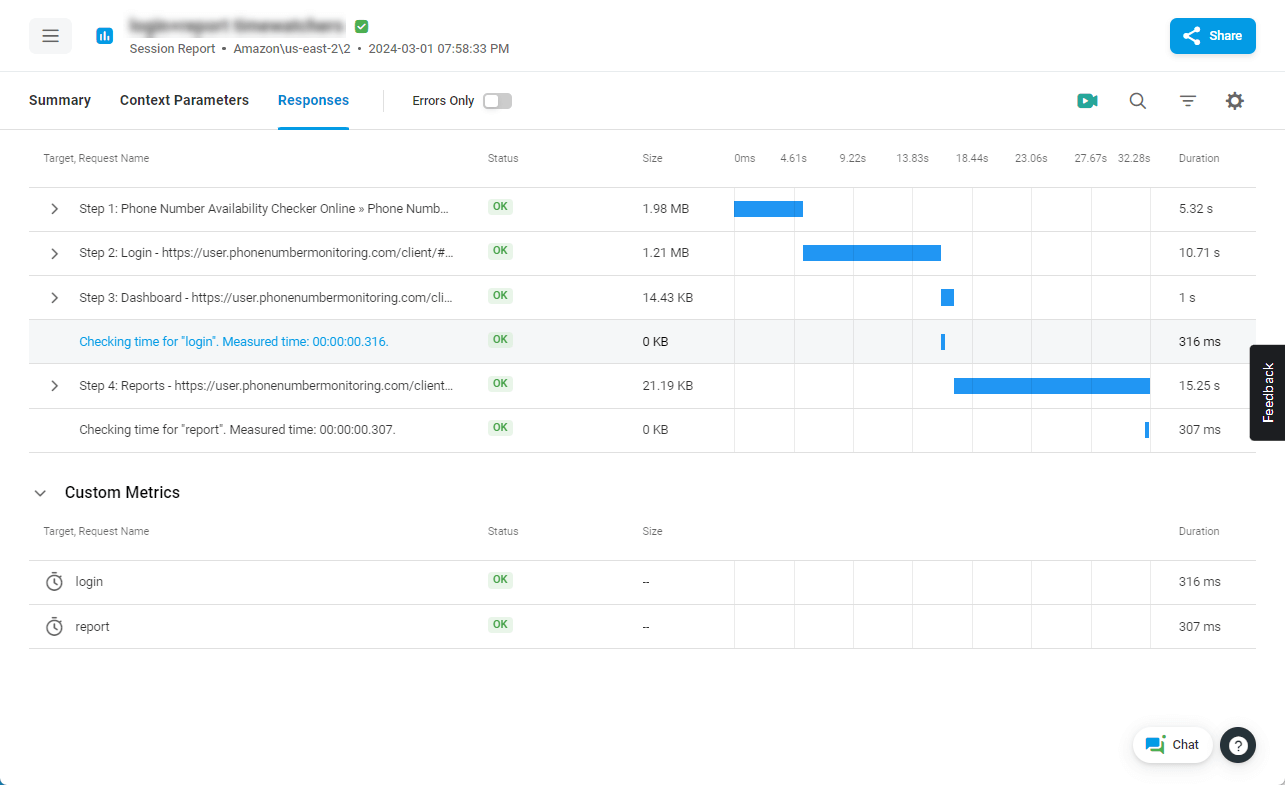
Generally, you can find your Time Watcher results for a specific test session in the session report. To see the duration of step execution measured by Time Watcher, open your Load Test Report and go to the Sessions tab. Here, you can open an in-depth session report by clicking the corresponding line in the session list. Please check the Load Test Session Details to learn how to use the session report for load test analysis.
To gather the Time Watcher statistics based on all test sessions executed within the test, you need to export the session reports to a CSV file and use Microsoft Excel or another compatible application to facilitate calculations on statistical data.
Generally, the process includes two steps that we will discuss in this article:
- Downloading a raw data report on the test sessions.
- Processing the report with Microsoft Excel.
Downloading the Raw Data Load Test Report
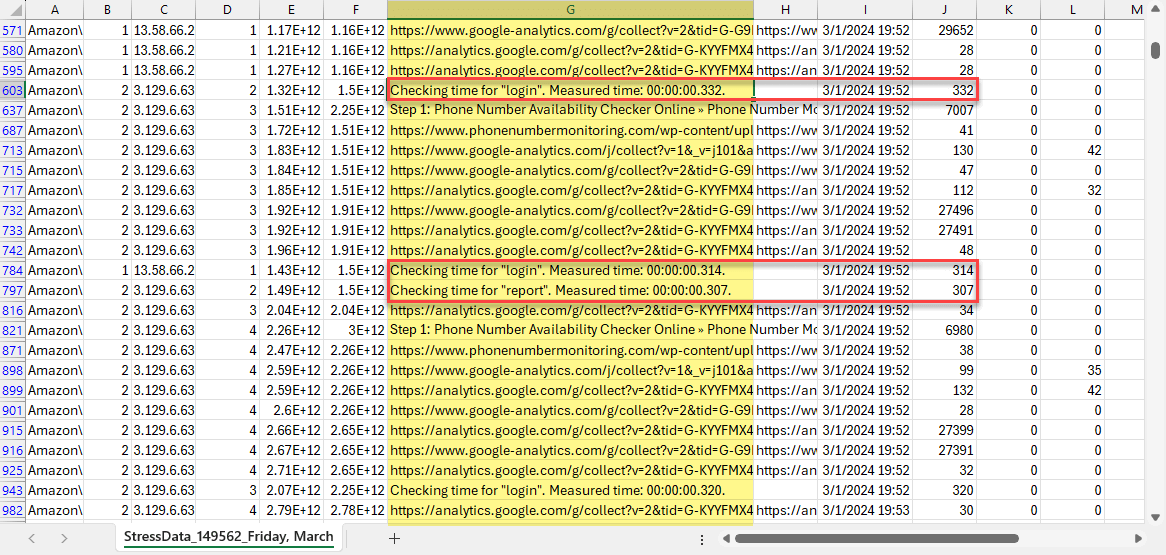
To receive the raw data report to your email address, under the Sessions tab, then click Export to CSV in the top right corner of the report window.
Once the report is downloaded, open the CSV file with Excel. Column G, labeled “Name”, contains the request (check) descriptions, while Column J contains the request (check) duration in milliseconds.
Processing the Raw Data Report with Microsoft Excel
To easily perform mathematical calculations on specific Time Watcher statistics, filter column G by the name of the Time Watcher:
- Go to the Home menu and select Sort & Filter.
- Then click the filter icon on the column G heading, uncheck the Select All checkbox, and under the Text Filter menu, click Contains.
- In the Custom Autofilter dialog, enter the Time Watcher name as appears in the file.
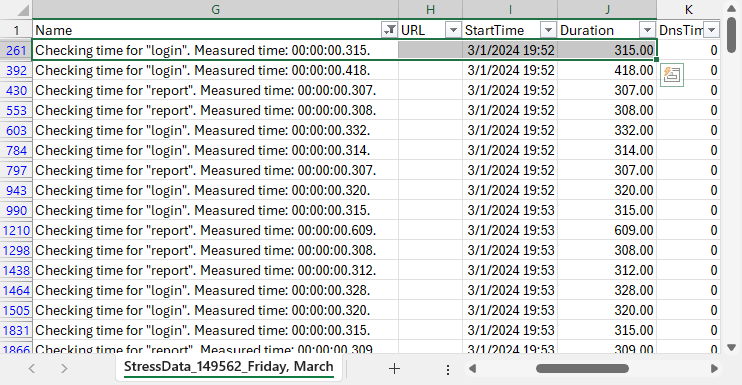
Now you are all set to process the Time Watcher measured times with various statistical functions available in Microsoft Excel.