
What is Uptime and Downtime?
In general, an uptime value reflects a percentage of time, measured within the bounds of a specified period, during which Dotcom-Monitor receives successful responses from monitoring Agents located around the world. The downtime value reflects a percentage of time, measured within the bounds of a specified period, during which Dotcom-Monitor received negative responses.
Manual Server Uptime/Downtime Checks
There are many free commercial and open-source tools and solutions available that you can use to check the status and performance of your web servers. While these tools are great for checking the status, response time, and performance at that time, having to manually run tests to spot check for server errors is time and resource consuming and will only give you results as of the time of the test. Discovering any errors while running manual tests may have impacted your clients’ ability to access to your website and the business.
Automate Uptime/Downtime Monitoring
Server issues can be difficult to pinpoint and can be time consuming to remediate, so time is of the essence when errors occur. If you have not set up automated monitoring for your servers, and errors occur and continue for a significant amount of time before being discovered the damage may have already been done. Automating server monitoring and setting up proactive uptime/downtime checks allows you to continuously and automatically set monitoring checks and get immediate alerts when downtime occurs, allowing your teams to quickly troubleshoot errors and keep your customers from having a negative user experience or risk financial losses to the business.
Monitoring Adherence to Service Level Agreements
Additionally, monitoring uptime can help ensure service providers are adhering to their SLA (Service Level Agreement) commitments. To learn more about SLA reporting within the Dotcom-Monitor solution, please read our Knowledge Base article on How to Create SLA Reports. The SLA report is a special reporting group that provides you with a single view of SLA performance over specified time intervals.
How Do You Define Downtime for Business Requirements?
With these factors in mind, below are several examples when considering how you define downtime.
- If you have regularly scheduled maintenance on your web server every Sunday evening, is your website down?
- You have a Chicago-based web server cannot be reached from Orlando, FL because your service provider is having an issue in Orlando, but it is available from the rest of the United States, is your website down?
- If a third-party hosted element, like a chat widget for example, is experiencing a server error, but the rest of your website is available, is your website down?
- If your website is not available from anywhere in the world, due to a server hiccup or some other server error, and lasts for more than 5 seconds, is your website down?
- If you operate a retail website and the shopping cart process is working properly, but a different page, like your About Us page for example, is not loading, is your website down?
- If one of your DNS servers is down, but three others are working, which equates to25 percent of clients not being able to access the website after the cached time-to-live (TTL) expires, is it considered a down condition?
- If one of three web servers in a web farm go down, and the page response time increased by 10 percent, 25 percent, or even 50 percent slower page load time, where do you consider when downtime occurs?
No one likes being called or alerted in the middle of the night when serious downtime issues occur. If the initial answers for downtime meant waking up at 2 a.m. to address the issue, would any of the answers to the questions above change your monitoring approach or response as it relates to uptime and downtime?
Uptime/Downtime Calculation Approach
Calculating uptime or downtime provides a way to carefully define how the Dotcom-Monitor platform interprets responses as either “Up” or “Down” responses. This is accomplished by using filters. Filters allow you to set specific conditions and parameters for monitoring devices, such as monitoring duration, task failures, error codes, etc., for monitoring Agents. Filters can also be utilized to define how alerts are sent and received, to limit or ignore the number of false alerts, that could unintentionally be triggered, to meet the needs of your business and monitoring environment.
Incidentally, a filter can also both be applied to a device (cutting false triggering) and to any type of reporting.
- The error is reported for a specified number of minutes.
- The error is confirmed by a specified number of Agents.
- The error is detected in a specified number of tasks.
All filters and their settings are available by accessing Configure > Filters. After a filter is applied to a monitoring device, all the monitoring device’s notifications are based on the filter’s criteria.
A default filter is assigned to all new monitoring devices. The default filter has a balanced configuration and is suitable for most monitoring devices.
Uptime/Downtime Calculations
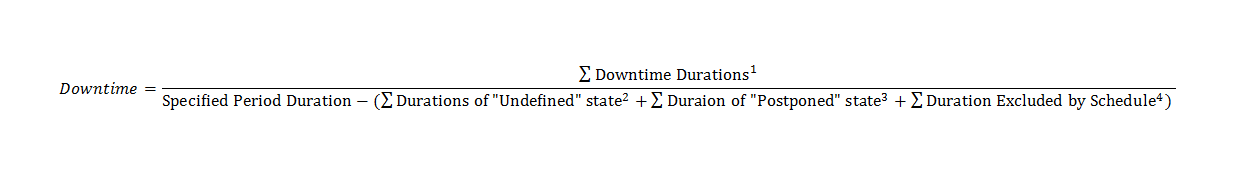
The mathematical formula for the Downtime calculation is shown below.
Duration of Downtime
Downtime Duration is tied directly to the configurations within the filter.
- The Downtime period starts when a filter’s conditions are met. For example, when the number of Agents that report a failure is equal to the number of Agents specified in the filter, and as also specified the conditions are met for the number of minutes and tasks, then a downtime alert is sent.
- The Uptime period starts when the filter’s conditions are no longer met. Specifically, Uptime starts when the number of Agents, minutes, or tasks that have reported “up” success no longer meet the conditions needed for the filtered “down” conditions. For example, an “up” state is indicated when the number of errors, or “down” responses, received by monitoring Agents becomes less than the number of errors, or “down” responses, that Agents need, as set in the filter, in order to indicate a “down” condition.
Duration of an Undefined State
An Undefined state can be set when the status of each Agent involved in monitoring becomes Undefined. An Agent status is considered as Undefined becomes Undefined if the Agent does not provide any response, either an error response or a successful response, for a specified length of time.
Response Wait Time Duration = (number of all Agents+1) × monitoring frequency + 15 minutes
For example, if we consider a situation where we use three monitoring Agents and a monitoring frequency of every 5 minutes, each Agent will wait for a response for 35 minutes. The calculation of the Response Wait Time Duration is as follows:
Response Wait Time Duration = (3+1) ×5 +15 minutes = 35 minutes
Once the time expired and no response is received, the Agent reports a status of Undefined.
Duration of Postponed State
Postponing a monitoring device at any moment will stop any monitoring activity until it is re-enabled.
Duration Excluded by Schedule
Another entity that can significantly affect Uptime/Downtime calculations are Schedules. Schedules serve as an option for managing your monitoring Agents during periods of routine or scheduled maintenance. Monitoring can be postponed for specific days of the week, as well as specific hours and minutes during a day. To set up a Schedule, follow the steps located in our Schedule, follow the steps located in our Configuring a Schedule Knowledge Base article.
Server Uptime/Downtime Example
For an example of how a monitoring Agents process and respond with an uptime or downtime status, let’s say we have a monitoring device that is being monitored from seven locations and there is a filter set that three locations must report an error when a Downtime condition is met. This scenario is depicted in the chart below.
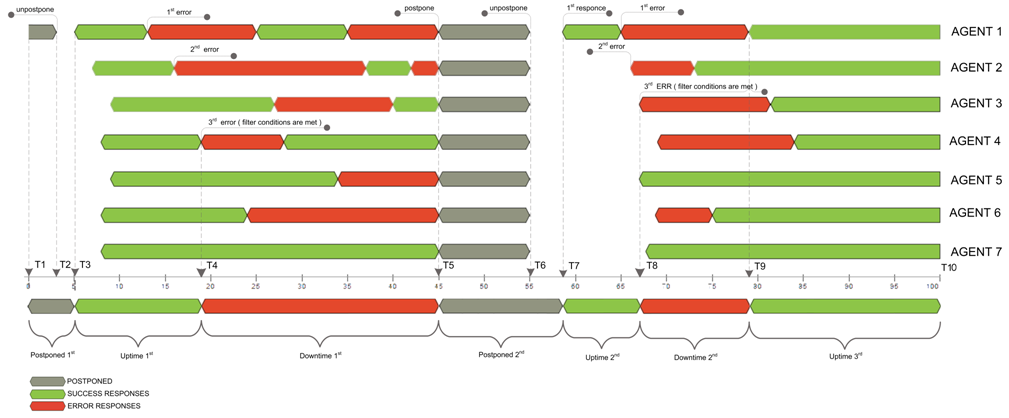
As you can see from the diagram above, a monitoring node (Agent 1) detects an error while the rest of the Agents are still reporting successful responses. Next, a second monitoring node, Agent 2, detects an error, which is followed by an error response from a third and final monitoring node, Agent 4. This final error response, located at point T4 in the diagram, triggers the filter to set Downtime beginning right from this moment.
The Down state will remain until you set a postpone period. In this diagram, we have set a hypothetical postpone, located at point T5 because of the number of Agents reporting errors has met the predefined threshold of three monitoring devices during the duration of the monitoring session.
The time gap between points T6 and T7 on the graph is an illustration of the fact that first response includes a delay (monitoring session processing time includes network transfer delays and the execution itself), so the “Postponed” time is being calculated as ∆ (T7–T5) (Indicated on the graph as Postponed 2nd).
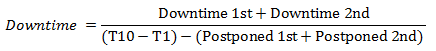
Here again, we fall into Downtime only on the third error from Agent 3 and resume an Uptime state only on the point T9 response, when the number of failing agents becomes less than adjusted in the filter. Below is the final downtime percentage calculation formula for this example.
Monitoring Uptime and Downtime with Dotcom-Monitor
To automate the process of monitoring uptime and downtime, you need to utilize a solution that offers full end-to-end visibility into infrastructure health and performance, as well as providing features, like the ability to monitor from multiple global locations, configuring specific schedules, filters, immediate alerts, reports and metrics, and much more. All of these features give users the to match the requirements and needs of their business. The Dotcom-Monitor platform provides all these basic features, plus more advanced configuration settings and third-party integrations, all from a single dashboard. Learn more about all the monitoring solutions available from Dotcom-Monitor to ensure 24/7 uptime of your websites, APIs, and web applications.