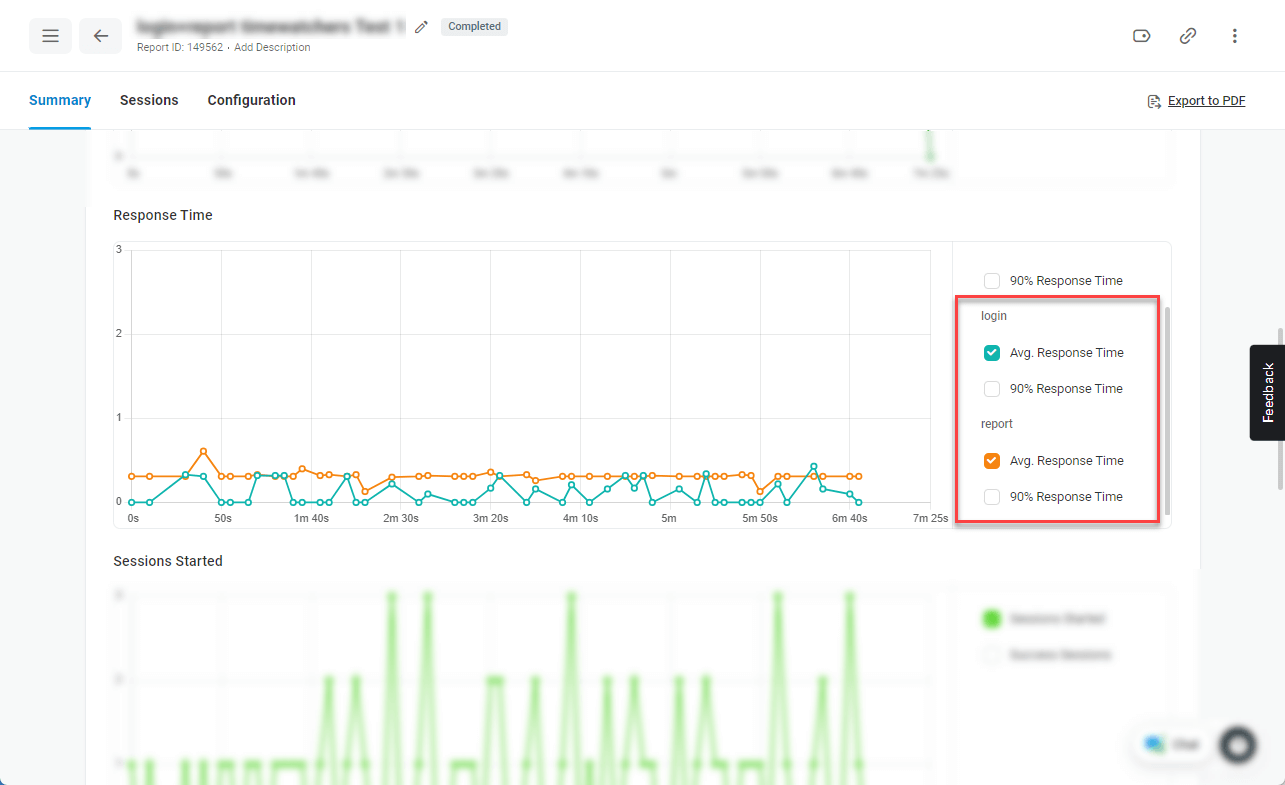
If the Custom Metric option is enabled in the Time Watcher settings, LoadView will collect time check results from all test sessions executed during a test run and present aggregate data on the Response Time chart of the load test report.
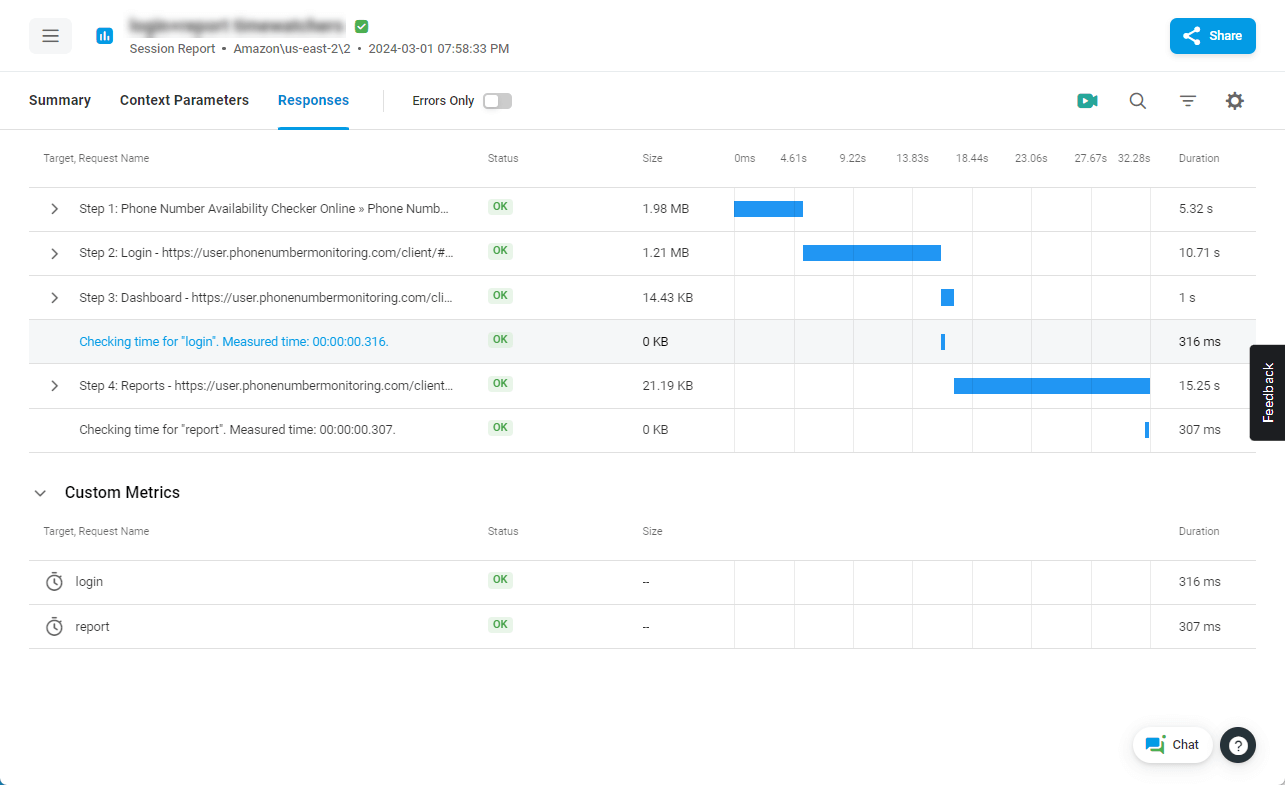
The results collected for an individual test session will be presented in the session report, among other test response details, on the waterfall chart and in the Custom Metrics section.