If the Custom Metric option is enabled in a time watcher settings in the EveryStep Recorder, Dotcom-Monitor retrieves the selected metric values from individual session reports and then aggregates them based on the report type and reporting period.
Performance Report and Session Log
To analyze changes in custom metric trends within a specific time window or to view custom metric data broken down by monitoring location, generate an Online Report for the metric using the following steps.
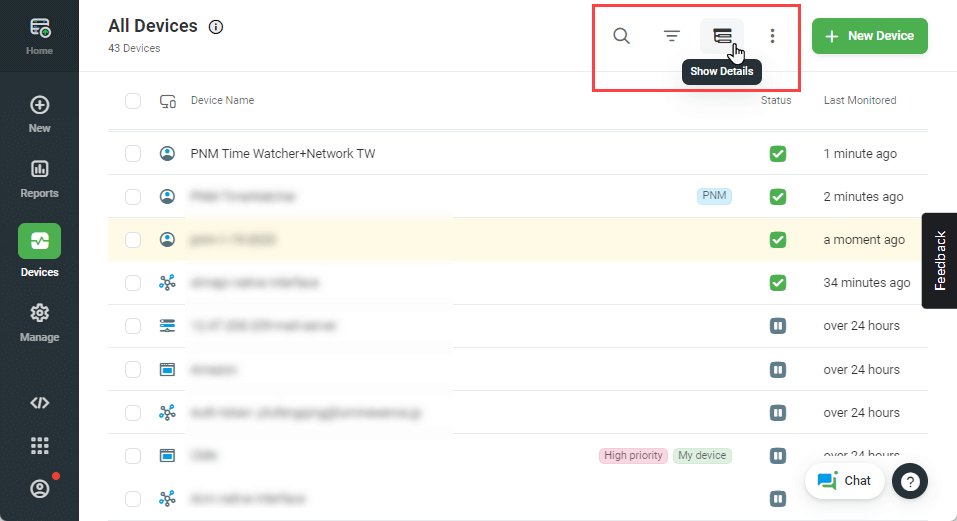
First, on the Device Manager page, switch to a detailed view.
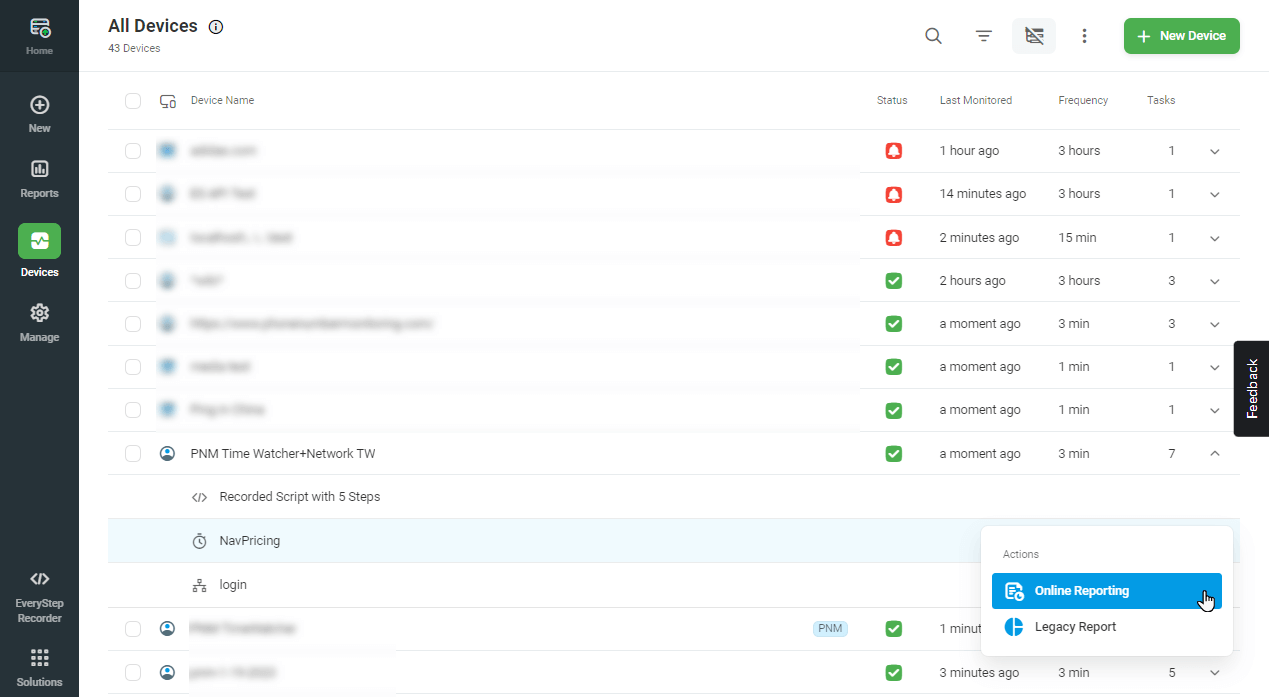
Then, find the device in the list, open the device’s detailed view and find the metric you want to analyze. From the Action menu, select Online Reporting.
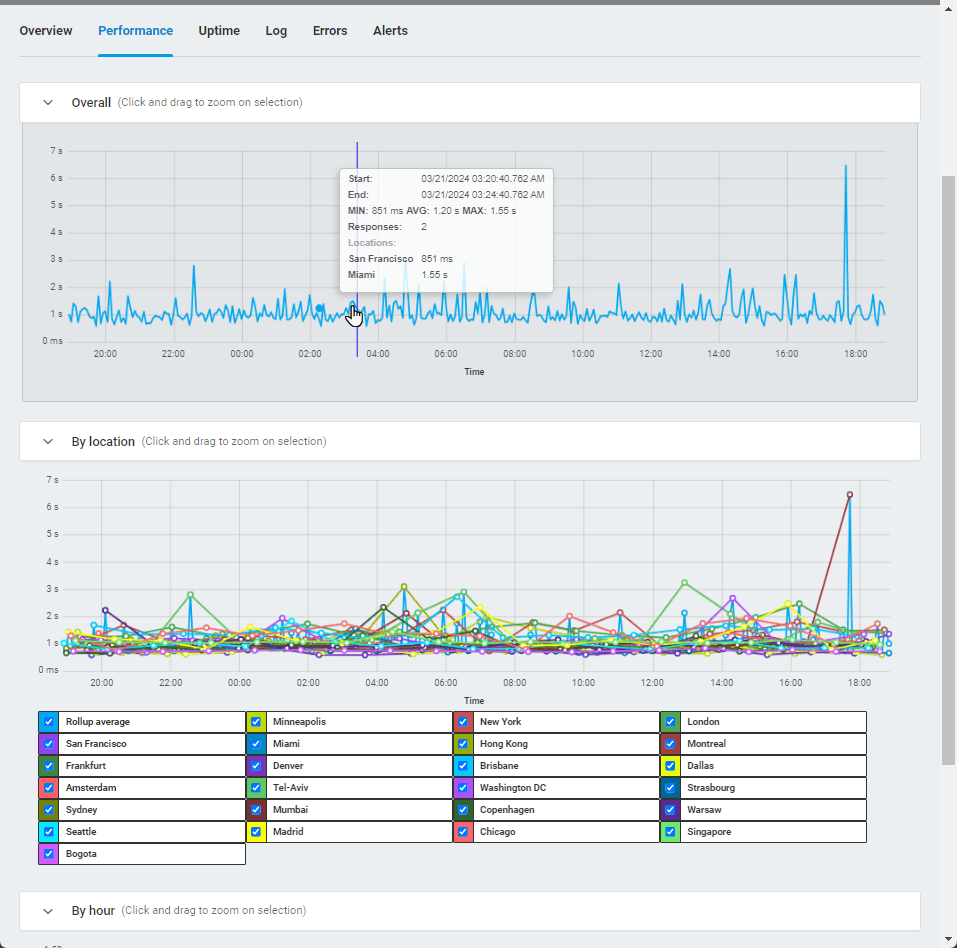
Select the time range and generate a report. Under the Log tab, you can find the time check results broken down by monitoring locations.
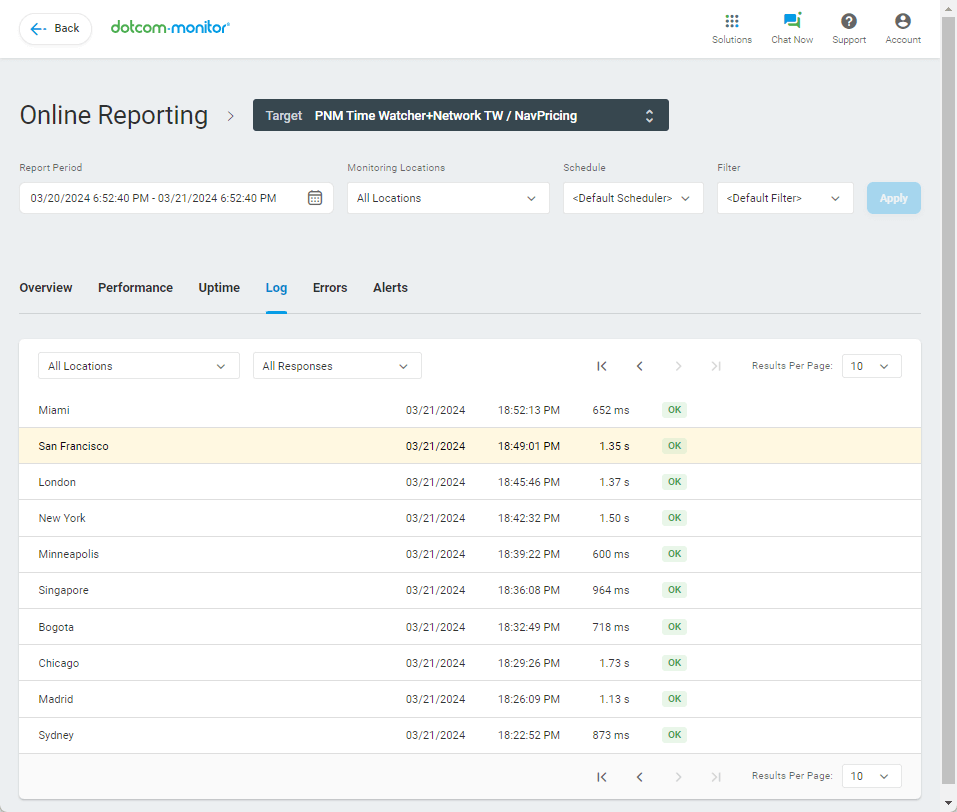
Under the Performance tab, you can find aggregated data for the selected time range. Here you can see measured time distribution by timestamp, location and by day of the week or hour.
Waterfall Charts
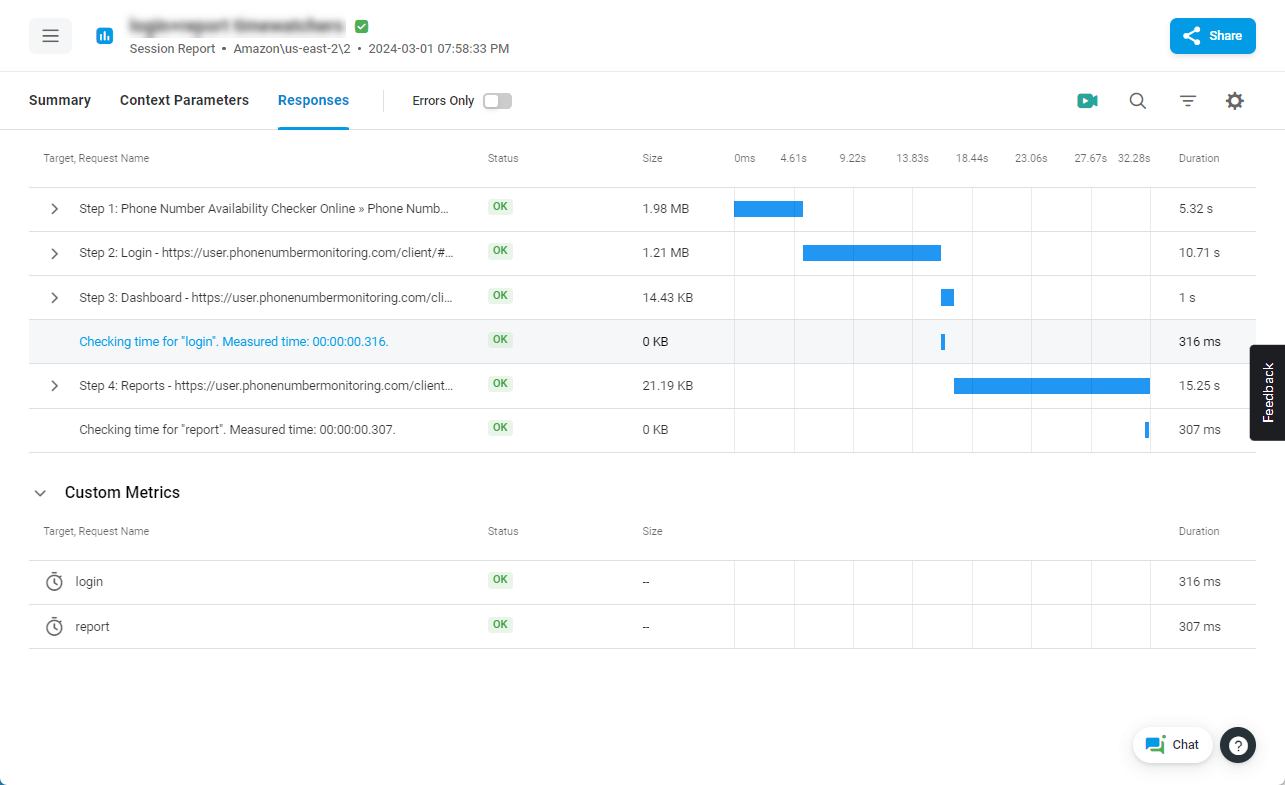
To see custom metrics for an individual monitoring session, pull the device Online Report as usual and open the session waterfall chart. The results collected for the monitoring session are presented in the session report, among other response details, on the waterfall chart and in the Custom Metrics section.
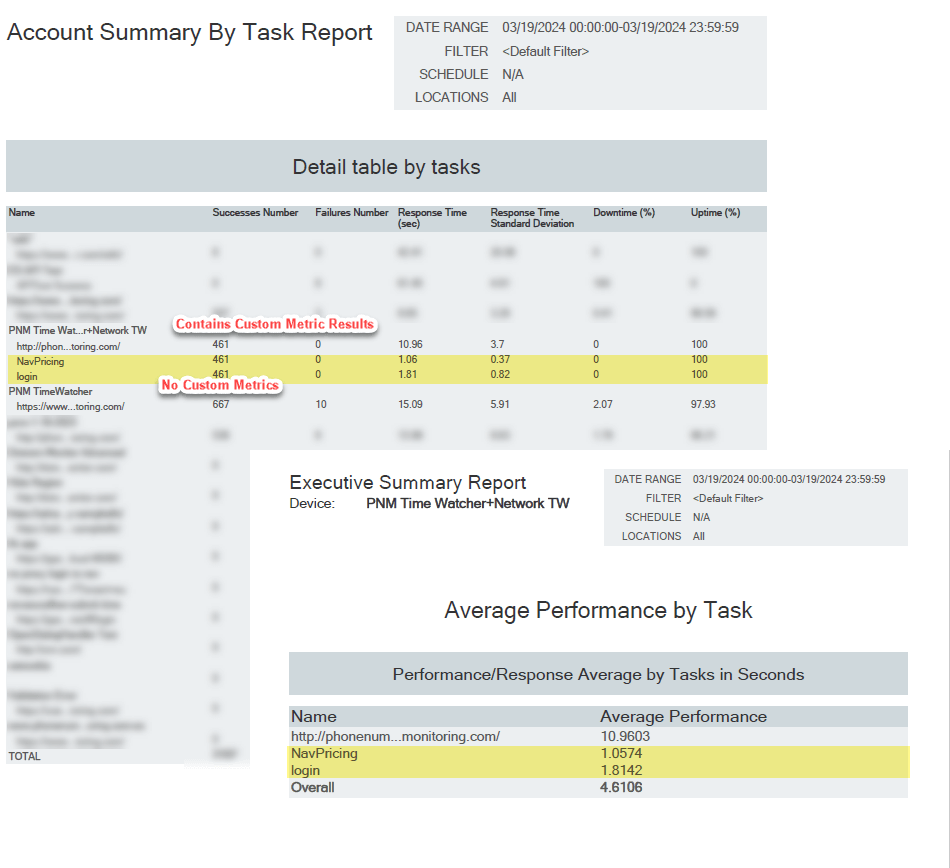
Email Reports such as Device Executive Summary Report and Account Summary Report
Summary Reports contain metric’s average value statistics on the task level.