
Modern IT infrastructure requires a comprehensive approach to application performance monitoring and testing. More and more companies all over the globe use a combination of Application Performance Management (APM) and Performance Testing to implement successful DevOps processes and support the overall health of their IT environment.
While APM platforms like NewRelic and Dynatrace are often used to track and analyze key performance metrics of application servers, databases, and other components of IT infrastructure, load testing tools like LoadView are an excellent solution as part of pre- and post-production performance testing. Integration of load testing into a web development lifecycle gives DevOps teams comprehensive insights into changes in web service and application performance under significant user load as well as helps to spot bottlenecks in supporting infrastructure. In this article, we will guide you through Dynatrace and LoadView integration to demonstrate the major steps of APM and load testing tool integration setup.
Dynatrace and Loadview Integration Overview
The major principles of APM platform integration with load testing tools are described in the Dynatrace and load testing tools integration article on the Dynatrace official website. In a nutshell, while running a load test, a load testing tool generates thousands of HTTP requests to a target website or web application. You can mark your test requests with specific HTTP attributes and filter out the load test traffic by these attributes in Dynatrace.
We can break the process of LoadView & Dynatrace integration into the following steps:
- Configuring extraction rules for the custom HTTP headers in Dynatrace.
- Creating a web application load test script with LoadView.
- Tagging load test requests with additional HTTP headers to filter monitoring data by defined tags in Dynatrace.
- Running the load test in LoadView.
- Applying the filter and getting the relevant requests in Dynatrace for further drill-down analysis.
Step-by-step Loadview & Dynatrace Integration Guide
Let’s start with configuring extraction rules for the custom HTTP Headers.
In Dynatrace, go to Settings > Server-side service monitoring > Request attributes and set the extraction rule for a new request attribute “loadtest” and header parameter “x-dynatrace” as described on the Dynatrace official website.
In the next stage, we need to create a load test with tagged test requests. Let’s create a basic web application load test script in LoadView. To record the script, we use EveryStep Scripting Tool.
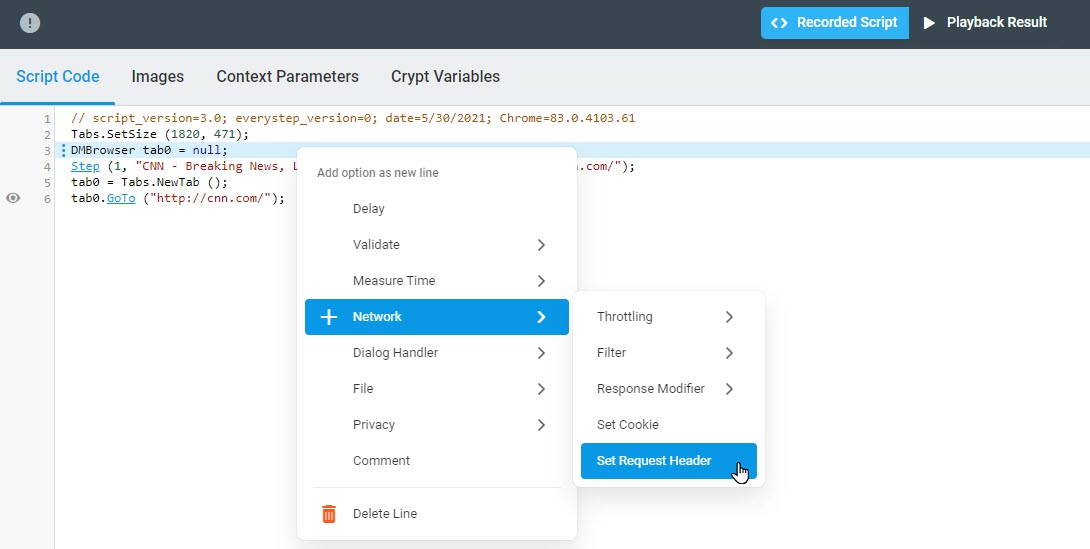
Once the script is recorded, let’s add a custom header to the script. To tag LoadView requests with a custom header, we use the Set Request Header function available from the script context menu (Network > Set Request Header). See the full description of the method in the Add Custom Header to the EveryStep Script article of our knowledge base.
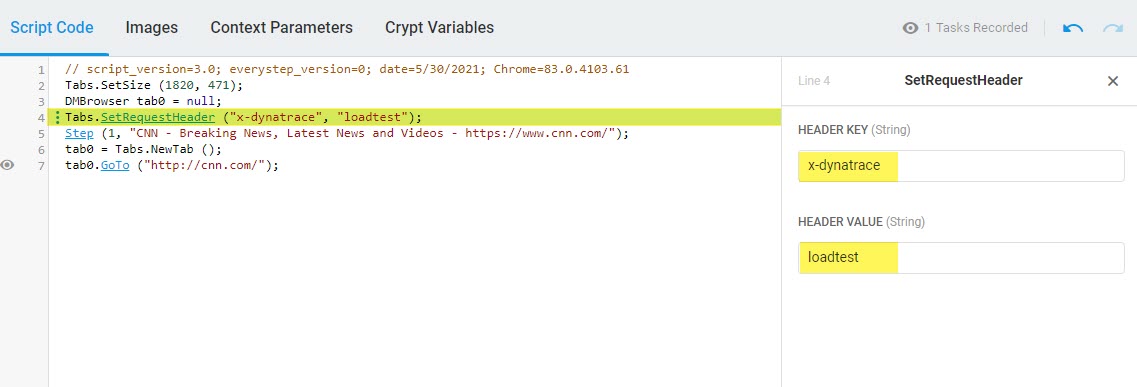
Next, we specify the following key-value pair:
- HEADER KEY : x-dynatrace
- HEADER VALUE : loadtest
Now we are all set to continue with the load test scenario as described in How to Setup LoadView for Load and Stress Testing and can run the test in LoadView. LoadView requests will be tagged in Dynatrace with the specified request attribute for further analysis.