
LoadView is a cloud-based load testing solution that helps development teams predict how a website, web application, API, and more, will respond to various levels of traffic and workloads. LoadView utilizes real browsers, providing real insight into the performance from the perspective of your users.
Become a Performance Testing Consultant: LoadView Certification Program
Interested in becoming a certified LoadView expert? Take our LoadView Certification Course and start earning commissions! Promote your performance testing services to clients and earn commissions on sales you make. For further information on the LoadView platform, such as features, benefits, and additional resources, visit the LoadView homepage.
What is Load Testing?
Load testing is a subset of performance testing. Performance testing is a type of non-functional testing and is part of the software development process that tests how software applications or websites perform under varying levels of virtual users, also known as a load.
Load testing can answer questions, such as:
- How will the number of website users affect website performance?
- How many simultaneous users can my website handle?
- Where are the bottlenecks in my web application?
- What is the breaking point for my website?
- When will the system run out of resources?
These tests provide insight into metrics such as response times, speed, reliability, and scalability. All these metrics help teams to understand where potential bottlenecks occur and if hardware capacity is required to ensure your website or web application can handle peaks in user traffic.
These metrics can also be used to establish performance benchmarks that can be compared against ongoing monitoring performance. For example, when setting up monitoring devices, you can set specific response time thresholds. If any of these thresholds do not meet or exceed the specified limits, your teams can get alerted immediately to find out what is causing the issue and avoid any long-term performance issues.
Types of Performance Testing
Other types of performance testing include spike tests, endurance tests, volume tests, and scalability tests.
- Spike testing. Spike testing subjects a software application to large, sudden increases in user load.
- Endurance testing. Endurance testing tests how a software application responds to increased, prolonged levels of user traffic.
- Volume testing. Volume testing, also sometimes referred to as flood testing, tests a software application against large sets of data to see how it responds.
- Scalability testing. Scalability testing provides a way to view how your application or system scales up, or scales down, to different levels of users. This ensures your system’s resources are properly being utilized and provides a stable experience for your users.
What is Stress Testing?
Load testing sets to test an application against a pre-defined workload. Stress testing, on the other hand, increases the workload until the system is pushed beyond its normal operating limits or crashes. The primary goal of stress testing is to find the breaking point. It is possible that a load test inadvertently becomes a stress test, but typically, a load test would be configured to understand performance at peak traffic levels, which should not bring the application or website down.
For more in-depth information about load and stress testing, and when to choose one over the other, please read our Load Testing vs. Stress Testing article. This article provides tips, best practices, load testing software information, and comprehensive information about the differences between load testing and stress testing.
The LoadView Platform
LoadView provides on-demand performance testing services, implemented and executed within minutes using a user-friendly dashboard. The platform does not require any additional investments in any hardware, or software infrastructure. Website traffic, or load, can be simulated from multiple worldwide locations. In addition to testing the website itself, LoadView tests the Internet infrastructure – connections, routers, firewalls, switches, and anything else – that may be associated with the website, or that handles traffic to the website.
This external-based approach simulates the natural behavior of actual users arriving at the website from the Internet from specified locations, providing more accurate insights into the performance issues that website users may experience.
How LoadView Works
LoadView utilizes a global network of Load Injector Servers (LIs) to generate user loads for website performance testing. LoadView provides functionality to set up and execute load tests against different targets, including the following types of load testing:
- HTTP/S. Test an URL for availability, performance, proper content, errors, broken links, and more.
- Web Page. Simulates concurrent users loading a web page. Choose from Chrome, Microsoft Edge, as well as mobile browsers, like iOS, Android, Windows, and BlackBerry.
- Web Applications. Create test scripts with the EveryStep Web Recorder to test web applications against concurrent users performing specific actions on real desktops (Chrome and Edge) as well as mobile devices.
- Streaming Media. Test your audio and media streams for performance and availability.
- SOAP Web API. Check performance, uptime, and responses of SOAP web services.
- REST Web API. Check response content, uptime, and performance of REST web services.
- Postman Collections. Test Web APIs by importing Postman Collections into the LoadView platform.
- JMeter. Import your JMeter Test Plan into the LoadView platform and use it to run a load test from a fully managed cloud.
- Selenium. Test web applications by running your Selenium Test Project with thousands of concurrent users from multiple geo-locations.
For additional information on selecting the right task type, please see our Task Type Knowledge Base articles
LoadView Performance Testing Requirements
As the test administrator, you have access to configure the following test requirements and much more.
Load Type
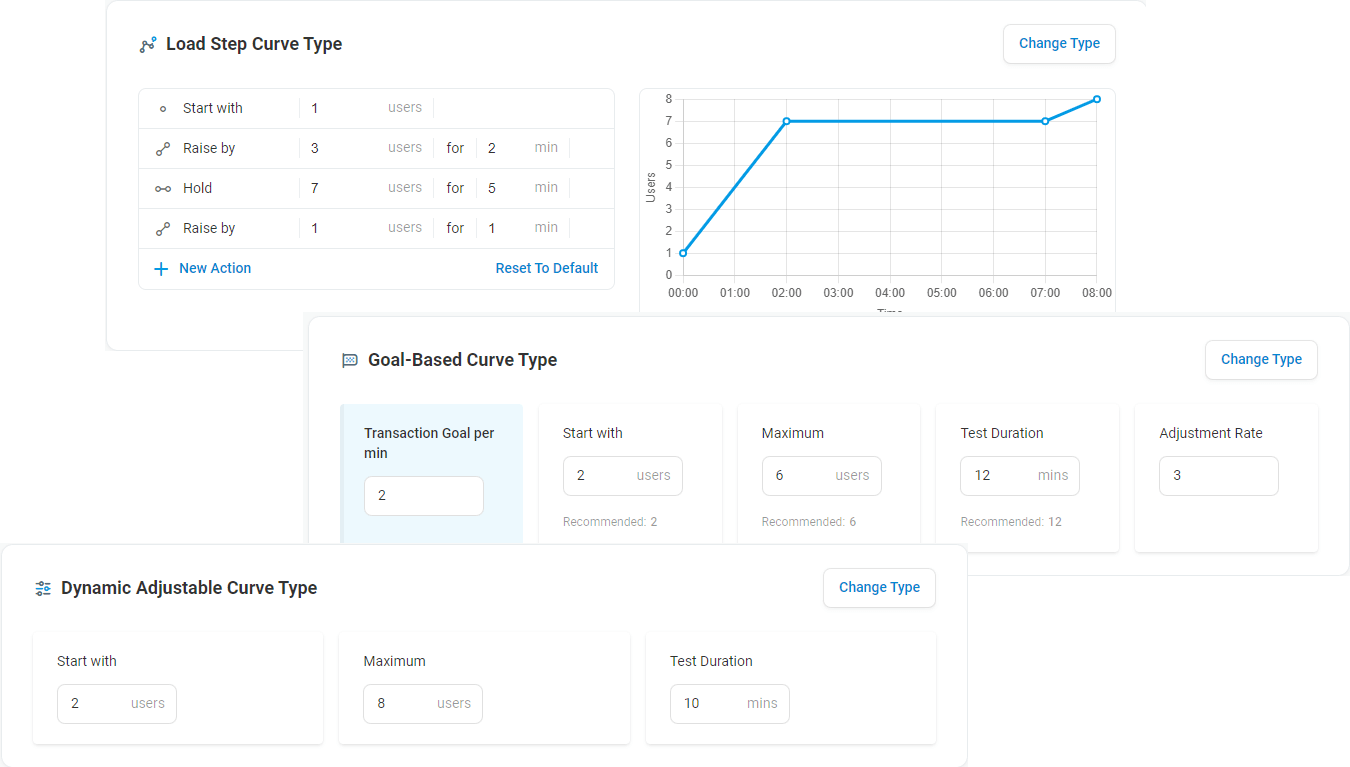
Choose from multiple load test curve types, such as Load Step Curve, Goal-based Curve, or Dynamic Adjustable Curve. These load curve options give test administrators the flexibility to adjust the number of concurrent users to match real-world scenarios and provide more realistic test results. For more information on the types of test curves, please read or Knowledge Base Article for tips on choosing the right type of load curve.
Test Duration
Test duration and testing limits are dependent on the type of load curve test selected and the number of concurrent users required. Read our LoadView Capacity Limits Knowledge Base article for more information on testing limits.
User Behavior
User behavior is used to simulate how actual users navigate through your website. For example, with the LoadView platform, you can choose from normal or custom options. Selecting the Normal user simulation will add random delays, between 3-6 seconds, that simulate how typical users will interact.
The Custom option allows test administrators to set random delays, like the Normal option does, but provides for more customization by allowing for shorter and longer delays, from 0 to 30 seconds, between actions. For example, selecting short delays runs the test as quickly as possible to execute stress tests, for example, and try to stress your system to find where and when the system maxes out.
It is also here that test administrators can set mouse movement speeds, mouse click speeds, and typing speeds when load test web applications using the EveryStep Web Recorder. See our User Profile Behavior Knowledge Base article for more information about configuring User Behavior within the LoadView platform.
Geographic Locations
The LoadView platform provides test administrators with the ability to select from multiple geographic zones and allocate virtual users between zones to simulate more realistic user scenarios based on where users visit your website from. Choose from over 40+ locations. Read our Knowledge Base article for more information on Load Injector Geo-distribution.
Additional Settings and Configuration Options
Based on the performance testing target, or task, selected, test administrators may have additional settings to configure before executing tests, such as Completion Timeout settings, SSL Certificate Checks, Content Validation, DNS Options, Network Throttling, Filters, and much more. Options vary based on the task selected. Read more about the different task and configuration options available in our Task Configuration Knowledge Base article.
Load Testing from Behind Your Firewall
LoadView can also assist with load testing applications and sites that are not publicly available to users. For this, the LoadView platform provides a couple of different options. Test administrators have the option to whitelist static IPs to allow LoadView to generate traffic to a company’s network. However, if this option is not feasible for an organization, for example, due to security concerns, test administrators can install an On-site Agent on the same server the target website resides. This removes the requirement for administrators to open the firewall to traffic since all traffic will be sent to the target web page or web application through the Agent on the local network.
For more resources on load testing from behind your firewall, please visit our Load Testing Behind a Firewall section or read our Public Cloud vs. Public Proxy vs. On-site Load Testing Knowledge Base article for more information about how to set up and execute load tests from behind a firewall.
Performance Testing Reports and Test Analysis
Once a load test is completed, the results are uploaded to the dashboard and available for analysis and reporting. Load test reports are divided into multiple sections that include a summary of the test, session report, device information, etc.
Test Summary
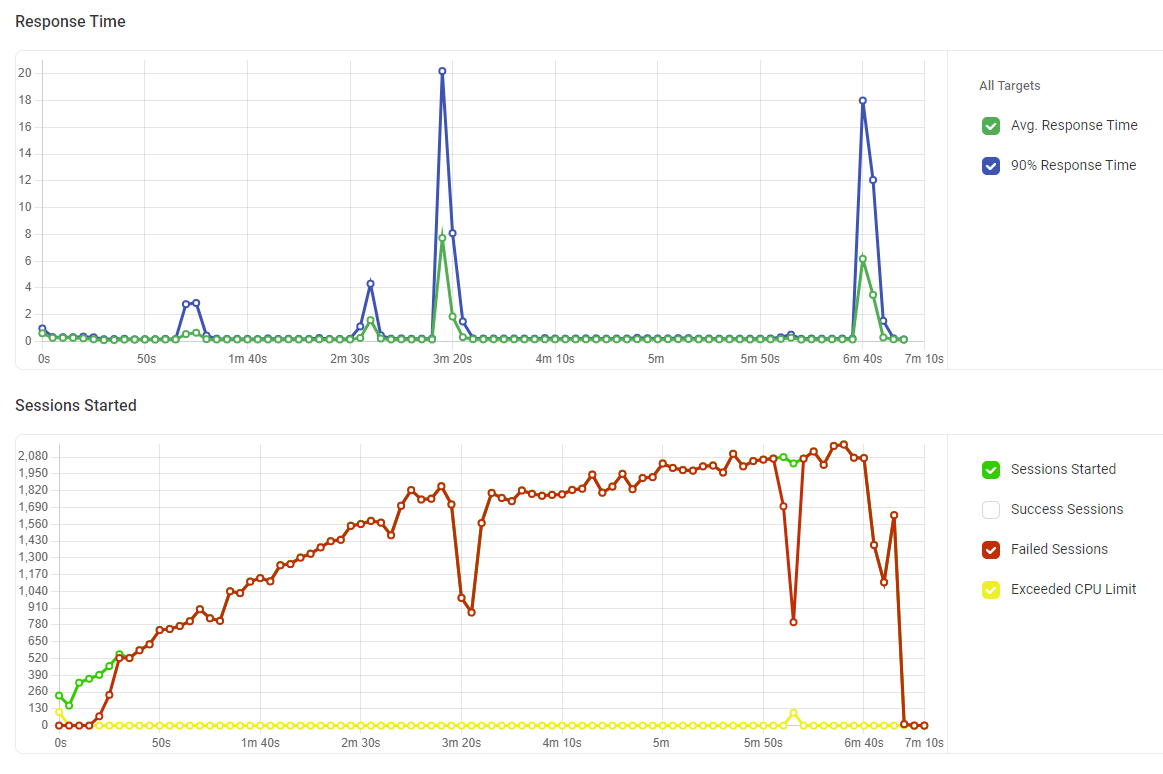
Test administrators can review charts that show how response times fluctuated as the number of users and load changed. There are multiple charts to review here, including the test Execution Plan, Average Response Times, Number of Sessions, Number of Errors by Type, and CPU usage by each of the Load Injectors. It is also here where errors are displayed and show when the errors occurred during the test and what type of error was encountered.
Test administrators can also download CSV files of the raw data that can be used to create their own reports or presentations for internal stakeholders and team members. You can also download the full report and quickly share it with others. For more insight on how to interpret test summary results, please visit our Load Test Summary Knowledge Base page.
Session Reports
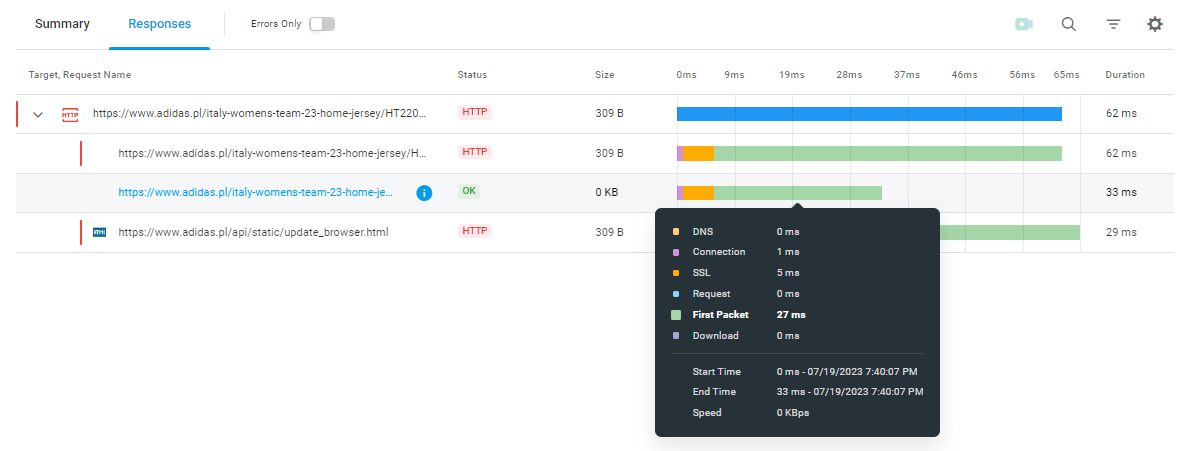
The Session Report can be used by test administrators to review details such as the time of the test, duration of the test, along with status. Test administrators can see every single session that was executed during the test. Test administrators can also drill down and filter out just the successful sessions or just the sessions that have failed, as well as filtering by specific zones. Additionally, test administrators can view waterfall charts to review any specific sessions that may be showing longer than normal response times.
Within the waterfall charts, test administrators can view a summary of performance, along with load time and breakdowns of each individual element and component. Along with those metrics, test administrators can go even further into the various network timings, whether it is connection time, DNS, first packet download, etc. Additionally, the dashboard will show an overview of the slowest and fastest elements for further investigation to understand what may be impacting performance. Learn more about setting up load and stress tests with LoadView.
LoadView Pricing and Plans
Whether you work in a small organization or large enterprise, LoadView offers several options, from subscription-based plans and an on-demand plan to select from. All plans include data retention of 180 days, the functionality to set up load tests from behind the firewall to test websites and web applications that are not available publicly over the Internet, and dedicated Azure and AWS load injectors so you don’t have to deal with the responsibility, time, or expense to set up your own load injectors.
Our subscription-based plans can be either billed monthly or annually, depending on your organization’s needs. However, all annual plans include four hours of Professional Services Consulting. Plans can easily be scaled to meet your needs as your organization grows, however, if you are looking to carry out larger-scale performance tests, contact our Enterprise team and we can configure an approach and plan that meets your needs.
Dotcom-Monitor Solutions and Services
To learn more about all the Dotcom-Monitor suite of performance monitoring and performance testing solutions and services, please visit the Dotcom-Monitor homepage. Our selection of monitoring solutions makes it easy to monitor all your web pages, web applications, APIs, servers, and more. Choose from 30 global locations, a wide array of features, and benefits like instant alerts, reports, and integrations, to ensure 24/7 uptime, availability, and performance for all your visitors. We offer a free 30-day trial to get started. No credit card is required. Try the full platform free for 30 days!