
The Performance Matrix can be easily customized to display the information you need. You can organize the dashboard tables by device configuration details as well as by performance metrics.
Default layout
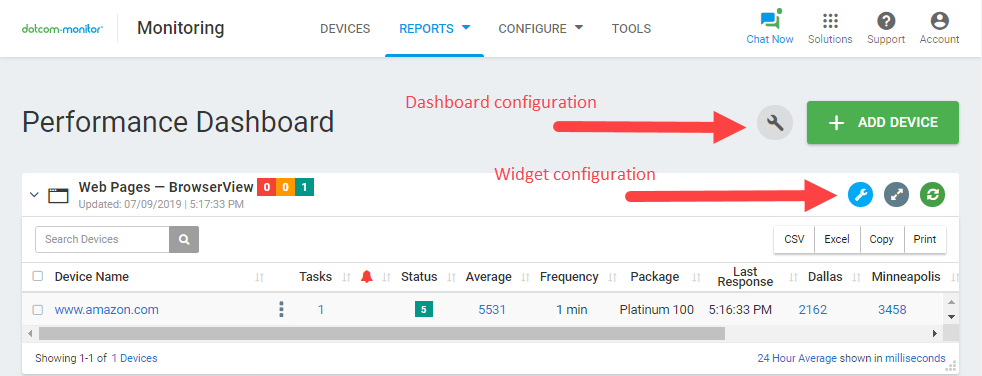
Each platform is represented by a related widget. Data collected from all monitoring platforms and devices is displayed on the dashboard by default. Herewith, statistics for all monitoring locations are provided on the widgets. A widget header displays a monitoring platform name and a date of the last update as well as the indicators with the counts of devices with alerts, errors and “OK” statuses.
To collapse/expand a widget, click the widget header.
Selecting platforms and packages to display
To choose monitoring platforms and packages to be displayed on the dashboard widgets, click the screw icon at the top of the dashboard.
From within the pop-up window, you can choose platforms and packages to show/hide on the dashboard by selecting/deselecting the corresponding checkboxes.
Customizing widgets layout
Widgets display device summaries and monitoring statistics by monitoring platform. You can customize each widget to show the details most relevant to your needs.
To edit a widget, click the gear icon in the upper-right corner. In the Display Settings window, you can adjust the widget layout, including rows and columns, by navigating through the available tabs and selecting the desired options.
-
Selecting devices to display
-
Selecting monitoring locations
-
Selecting device status to display
-
Choosing locations to collect Average Response Time statistics
-
Selecting device configuration details to show
-
Selecting reporting period
-
Selecting time units
-
Selecting a data refresh mode
To restore the default layout, click Default Settings at the bottom of the Display Settings window.
Exporting and Printing Data
Data from a specific Monitoring Platform widget can be exported to CSV, Excel, or copied to the clipboard using the corresponding buttons on the widget’s top toolbar.
To print the data displayed on a widget, click Print on the top toolbar.
Managing Devices
To edit device settings directly from the Performance Dashboard, click the device name within the corresponding widget.
To access the device actions menu, click the actions menu icon next to the device name.
You can also add a new device directly from the Performance Dashboard by clicking the Add Device button at the top of the page.
Bulk Actions
To edit multiple devices at once, select the desired devices within a widget and click the appropriate action button that appears on the widget’s top toolbar.