Web Page Monitoring
- 99.99% Uptime SLA
- G2 Top Performer
- Website monitoring leader since 1998
Web Page Speed Performance Monitoring

Real Browser Monitoring
Extensive Browser Support: Choose from a wide range of desktop and mobile browsers for a comprehensive monitoring experience.
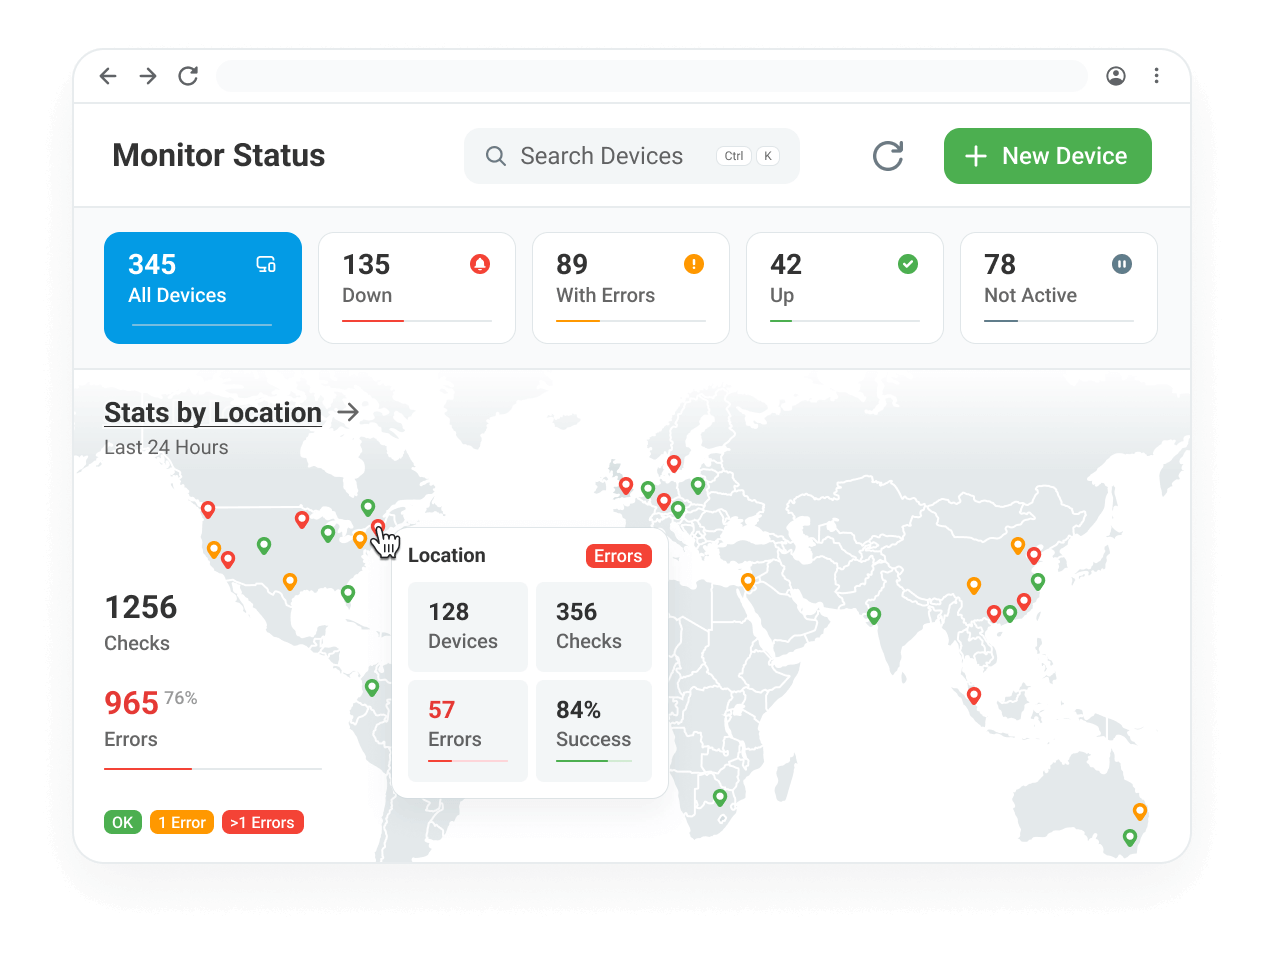
Global Perspective: 30+ monitoring locations worldwide to pinpoint issues.
Capture Page Load Video: Synced with interactive waterfall charts for quicker diagnosis.
Network Throttling: Simulate user experiences in various network conditions.
Web Page Monitoring: Navigation Timing Insights
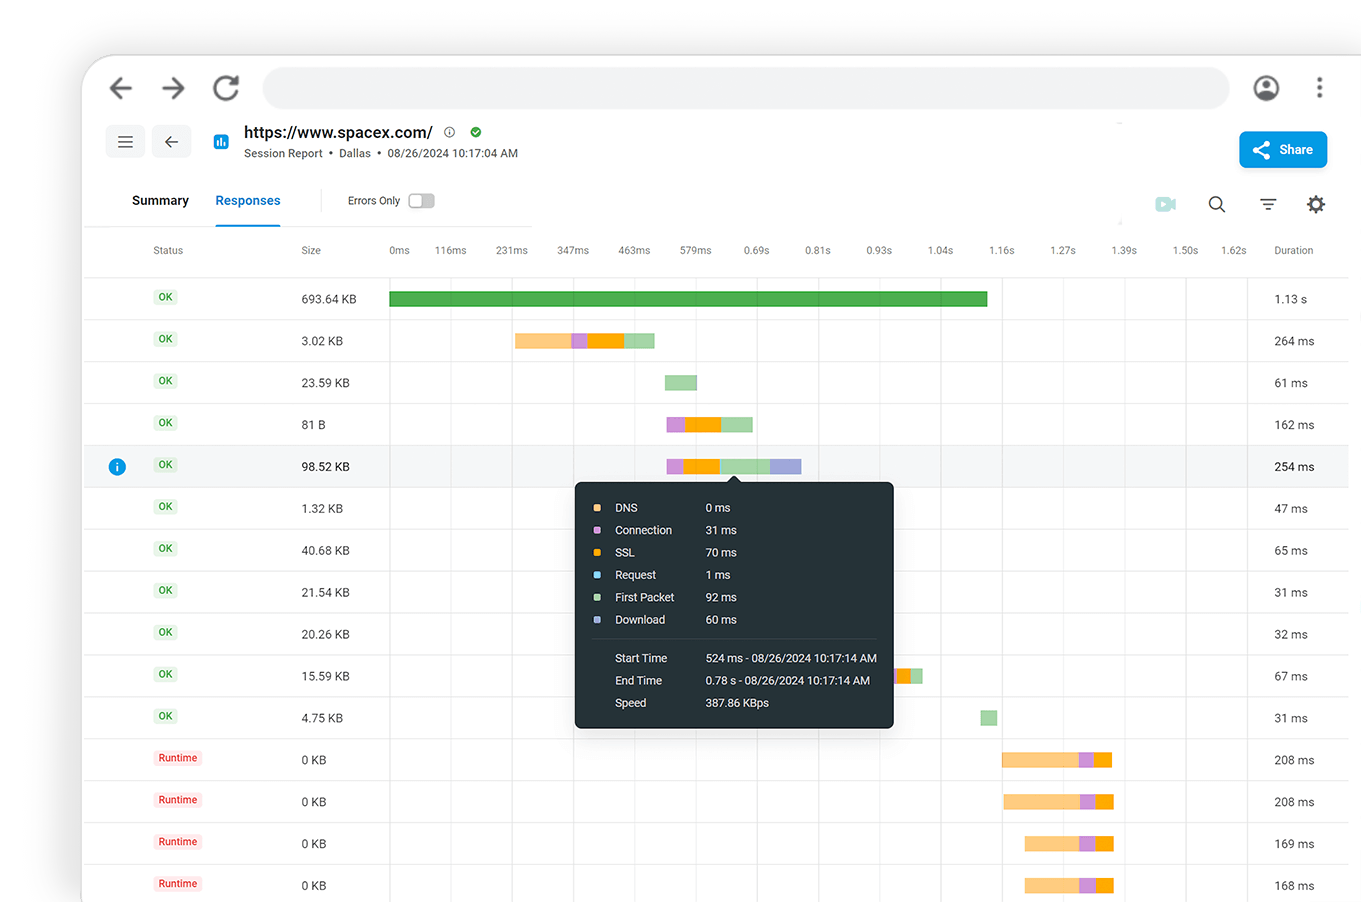
Comprehensive Timing Metrics: Includes attributes like navigation start, domain lookup, and connection times for thorough analysis.
Performance Breakdown: Evaluates both backend request/response times and front-end DOM events.
Enhanced User Experience: Helps you understand overall performance and identify factors impacting user satisfaction.
In-Depth Web Performance Reporting
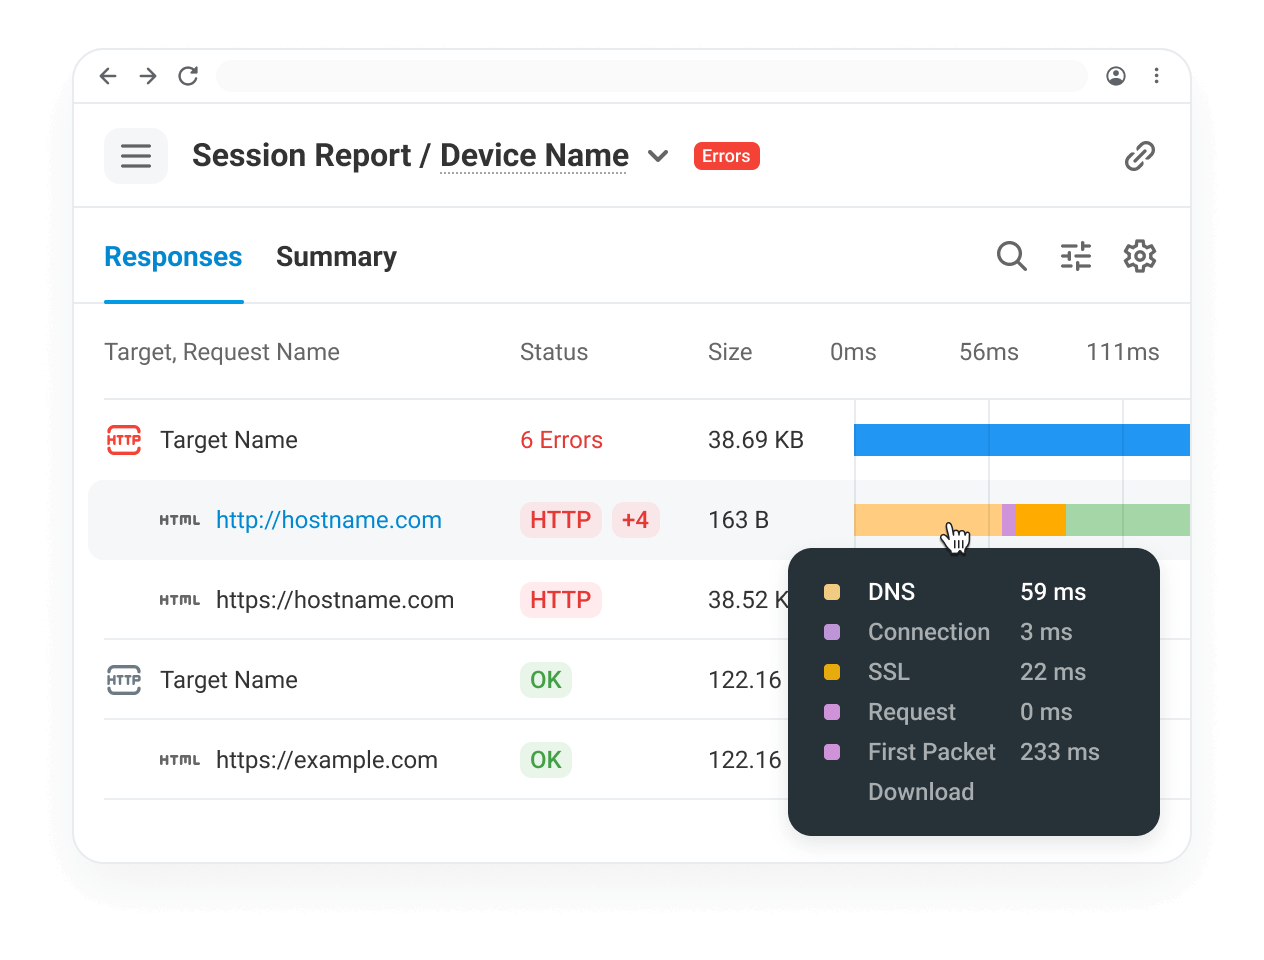
Waterfall Charts: Gain insights with visual breakdowns of element load times.
Fastest and Slowest Elements: Identify the elements impacting speed.
Breakdown by Element: Know the size and load time of each individual element.
Errors and Diagnostics: Stay informed about any loading errors.

Powerful Features
Key Web Service Monitoring Features

Unlock deep insights into your website's performance through our intuitive waterfall charts. These charts provide a granular breakdown of each element’s loading time, allowing you to pinpoint bottlenecks and optimize for speed.

Don't leave your desktop users in the dark. Our desktop real browser monitoring feature allows you to assess page load times and performance on all major desktop browsers. This ensures a consistently exceptional experience for all users, regardless of their browser choice.

Get the most accurate performance metrics with our non-cached responses and above the fold load times features. These tools provide insights into the initial loading experience and focus on the critical content that users see first, allowing you to prioritize optimizations effectively.

Monitor your site's performance on mobile devices for a seamless user experience. Our mobile real browser monitoring tool provides detailed analytics on page load times, element performance, and other key metrics to help you optimize for mobile visitors.

Emulate actual user experiences with our 2G, 3G, and 4G speed simulations. By simulating these different network speeds, you can better understand how your website performs under various conditions and take action to improve load times.

Our repeat visitor simulation feature allows you to measure how your website performs for users making return visits. Monitor element loading times and identify opportunities to optimize caching strategies for a faster, more efficient user experience.
Trusted by Businesses Around the World
4.5
82 reviews
4.6
4.6
All reviews sourced from Capterra verified reviews. Ratings as of July 2026.
Expert Page Services Monitoring. Enterprise Power for Businesses of All Sizes.
Get answers
Web Page Monitoring—Frequently Asked Questions
Below are some of the most common questions about web page monitoring. If you have additional questions, feel free to contact us.