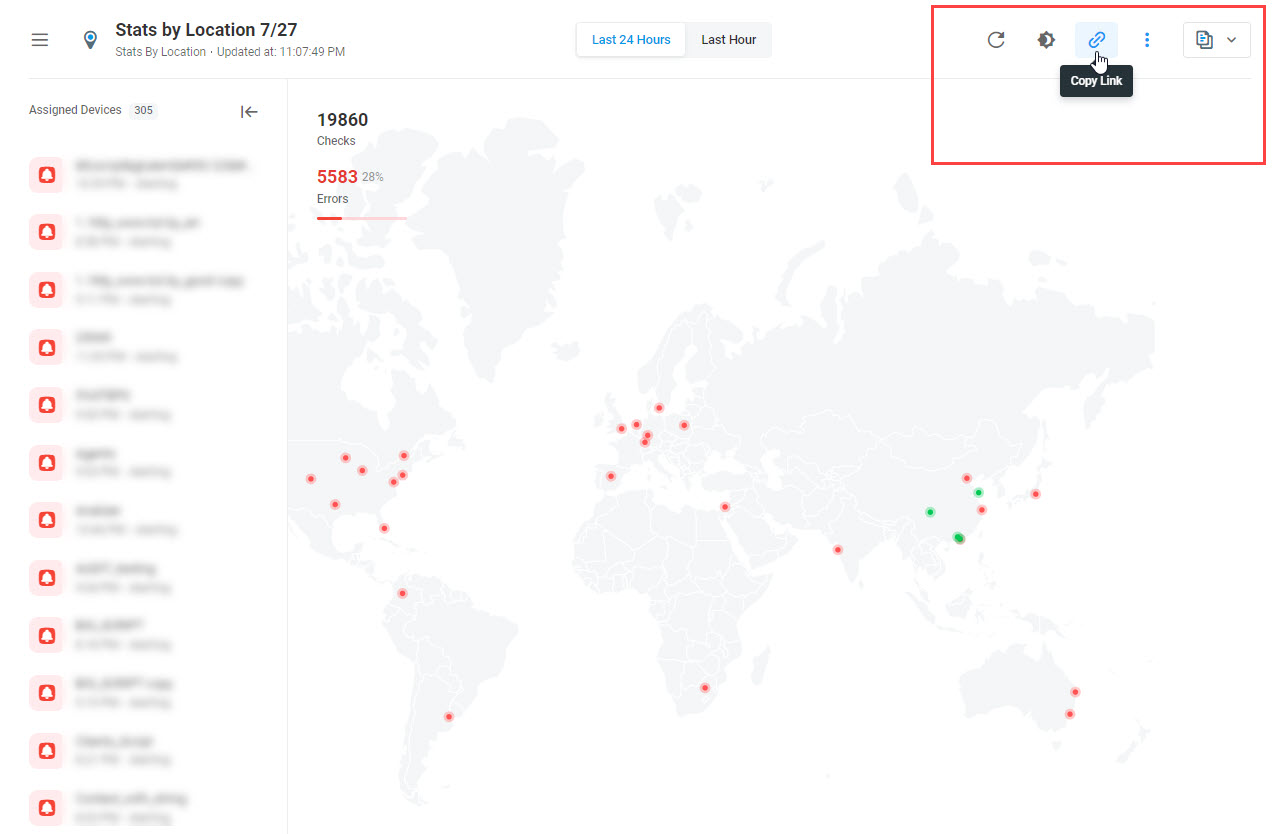
Stats By Location Report Card accumulates response status statistics from monitoring locations all over the world. The data is provided in a real-time mode and updates automatically.
The locations are color-coded to provide users with an efficient tool to track the status of monitoring depending on the geolocation of the monitoring agent that initiates monitoring requests:
- Red for locations with more than 2 monitoring errors received with the responses.
- Yellow for locations with only 1 error.
- Green for locations without monitoring errors.
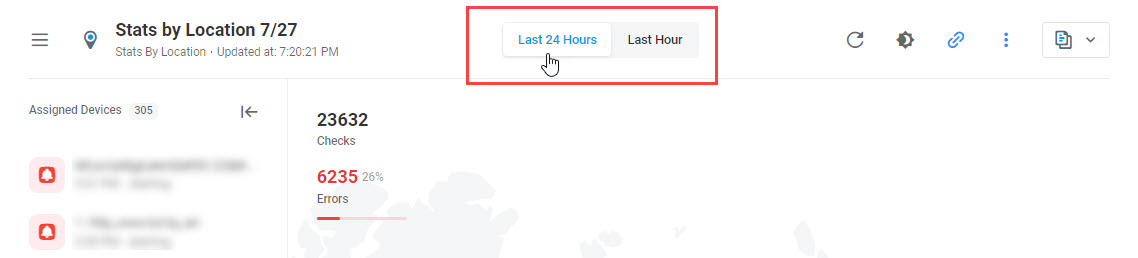
The report card allows users to display error statistics for the last 24-hour period and for the last hour. To switch between reporting periods, use the switcher at the top of the report card. The report card will be updated correspondingly.
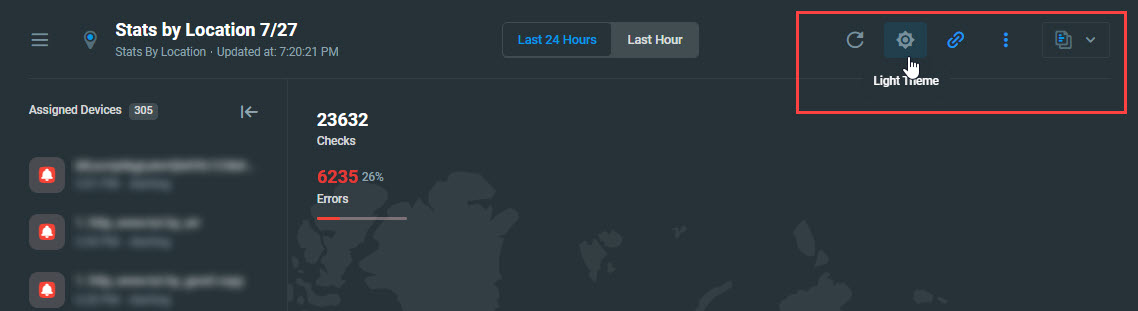
To receive the most recent statistics, you can update the report card manually at any time by using the refresh button on the report card toolbar.
To switch between night and day report card layout, use the theme button on the report card toolbar.
The report card can be shared with other users on the Internet by copying and pasting the unique GUID-based URL into an email or other document. By default, all users on the Internet can access the report card via the unique GUID-based URL.
Security
Unique URLs that are generated for each report card are secured by several means (discussed below), and unless specifically exposed by the service owner, are unavailable to the general public. You can check and change your dashboard accessibility status under Reports > Shareable Report Cards.
Restrict Access
You can restrict access to the report card in the shareable report card settings so only users of your Dotcom-Monitor account will be able to open the URL and view the report card data.
Revoke Access
If you want to revoke access to a specific report card, you can go to the Shareable Report Cards manager, and reset GUID from the report card actions menu.
Configuration
There are two ways to create a Stats by Location report card:
- From within the Shareable Report Cards manager page. To add a new card, click New Card > Stats by Location.
- From within the Monitor Status dashboard. See the Monitor Status Dashboard article for more details.
Access to the Report Card
Once a report card is created, it is assigned a global unique identifier (GUID), for example, “B5BB0BEEA67E47648F27B5F634EDD75C”. This randomized GUID makes it virtually impossible to find the report card unless it is specifically shared, or published, where it can be viewed.
By default, all users on the Internet can access the report card via the URL that is automatically generated for the report card (the Anyone with the link option). However, you can restrict access to the report card so only users of your Dotcom-Monitor account will be able to open the URL and view the report card data.
To allow only authenticated users to view the performance report card, in the Access field, select Users in Your Organization.
Report Settings
Name: Enter a descriptive name for the card. The name will be displayed across the top of the report card page.
Assigned Locations: Select the monitoring locations the results from which you want to show on the report card.
Assigned Devices: Select the devices to include in the report card.
To display response duration time for responses with errors and Ok statuses, check the Show Duration option.
Access URL
Once a new report card is created, you can copy the link to the report card from the card actions menu within the Shareable Report Cards screen or the card preview screen. For other actions available for report cards, see Dashboard Manager.