
A visual traceroute provides visualization of the hops involved in one or more traceroute paths where an error was detected. The visual traceroute acts as a map, showing all the paths and network devices, such as routers and switches, that data packets pass, or hop through, on their way to their destination. Using the visual traceroute, you can see the number of intermediate hop points, names and IP addresses, round-trip time (RTT), and time it took an IP packet to get to each hop on the route to its intended destination.
What is a Traceroute and Why Use It?
A traceroute is the network diagnostic tool commonly used by IT administrators, internet providers, and web developers to troubleshoot connectivity and network latency issues. Tracing a network packet’s route to a network host shows all the intermediate nodes through which the packet passes until it reaches the specified destination. Thus, using traceroute you can find out to which hosts with which IP addresses the packet passes before being delivered to the destination point.
Traceroute can be used to identify problems related to the operation of a computer network, as well as to explore the network. For example, to determine the structure of the network, to search for intermediate network nodes, etc.
How Traceroute Works
Network packets that are passed over the network include two parts: headers and data payload with user information. The headers contain various attributes, for example, the IP addresses of the source host and the destination host, the source and destination ports, the type of the packet, the checksum of the packet, etc. In terms of traceroute, the most important field of an IP header is the TTL field (time to live), or, in other words, the packet time of life. This is a counter with a number that is decreased by one each time a packet passes a new node. Let’s have a closer look at this algorithm.
First, a packet is sent from the source with the TTL set to 1, the very first host on its way decreases the TTL value by one, so the counter becomes equal to 0. In its turn, the host detects that the TTL is exceeded and does not forward this packet anywhere further, but it sends a response that the packet is “dead” to the source host. This way we receive the response with the IP address of the host one hop away from the source.
At the next step, a packet is sent with the TTL counter set to 2. The packet passes through the first gateway, but the counter reaches zero on the second gateway and the response with the IP of the second host two hops away from the source is sent back to the source. Then the next packet is sent and so on until all nodes on the route to a target host are detected. This way we have IP addresses from all the hosts the packet passes on its way to the destination point.
There are several approaches to implement a traceroute. In general, the main difference between the approaches is in the type of network packets, it can be a TCP or UDP transport protocol packet, or ICMP protocol, or a raw IP packet.
Visual Traceroute: Quickly Identify Network Issues
When network issues arise, ping tests and traceroute tests are typically the first step in remedying and identifying connectivity or latency problems. While ping tests are good for indicating that a network issue exists, a traceroute can indicate where in the sequence that issue exists. Within the Dotcom-Monitor platform, there are two types of traceroutes: network and DNS traceroutes.
How to Access the Visual Traceroute Report
Each time an error is detected by a remote Dotcom-Monitor agent location, it automatically executes a traceroute from that remote monitoring agent location to the target of the monitoring device.
To view the traceroute for a specific monitoring device:
- Log in to your account. From the Device Manager page, select Online Reporting from the Reports menu on the left sidebar.
- Once on the Online Reporting page, you will be prompted to select your target or device. You can also click the device name in the Device Manager list to access the Online Report.
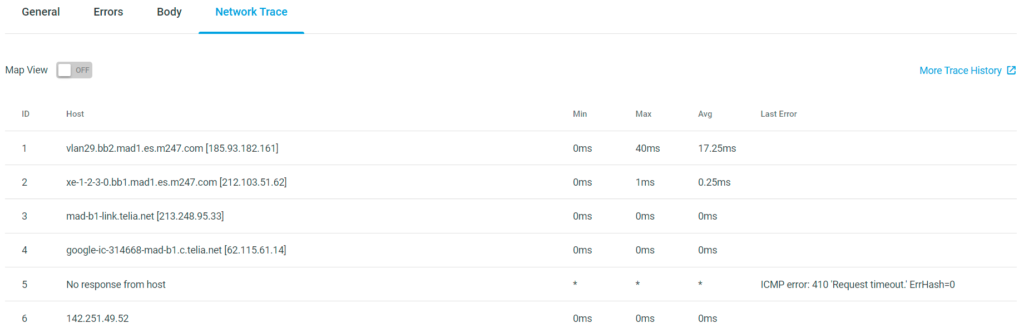
- On the Online Report page, select the appropriate monitoring location where the error or errors occurred, and then drill-down further into the Step where the error has been identified. Navigate to the appropriate line and select Trace. This will display a list of all the hops, host names, traceroute response times (Min, Max, and Average), as well as an explanation of the error or errors.
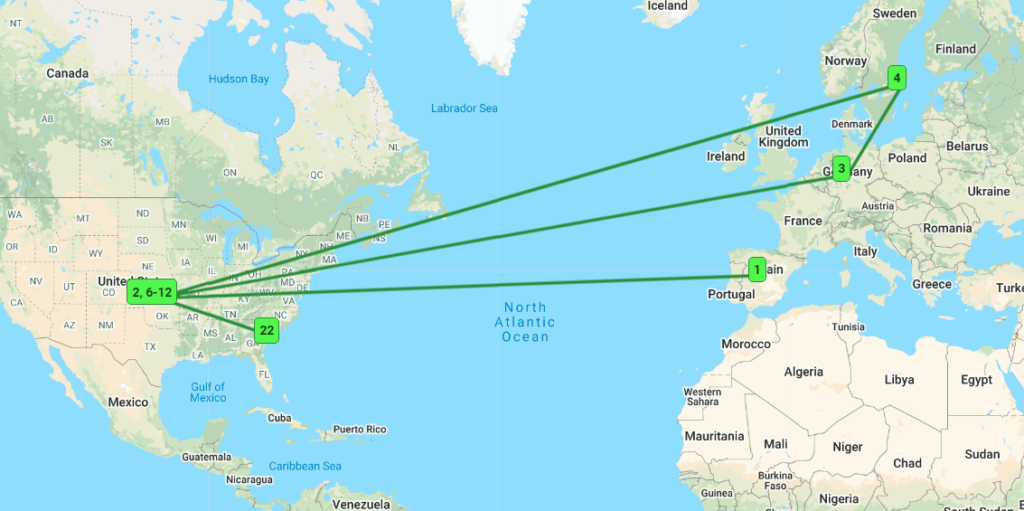
To see the traceroute details display on a map of the world, select Map View. This gives you a better visual representation of the routes of the network packets as they hop through various locations around the world.
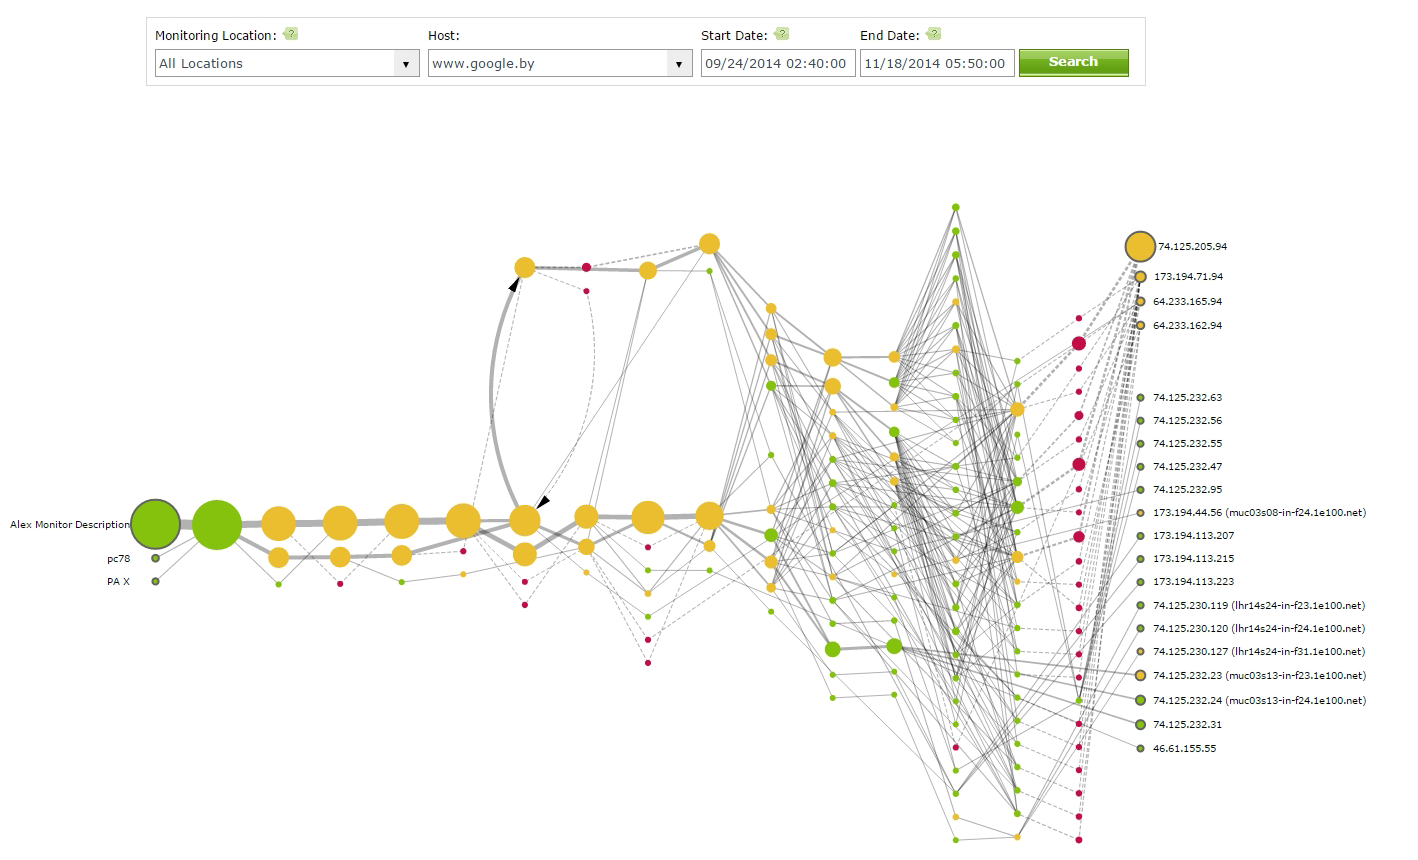
 Additionally, you have the option to view the traceroute history. From the Network Trace page, select More Trace History on the right-hand side of the page. The Dotcom-Monitor platform uses a maximum of 30 hops per traceroute iteration. Each green, yellow, or red circle reflects a single hop. Additionally, the size of the circle itself indicates the number of packets transferred through that hop. The more packets, the bigger the circle.
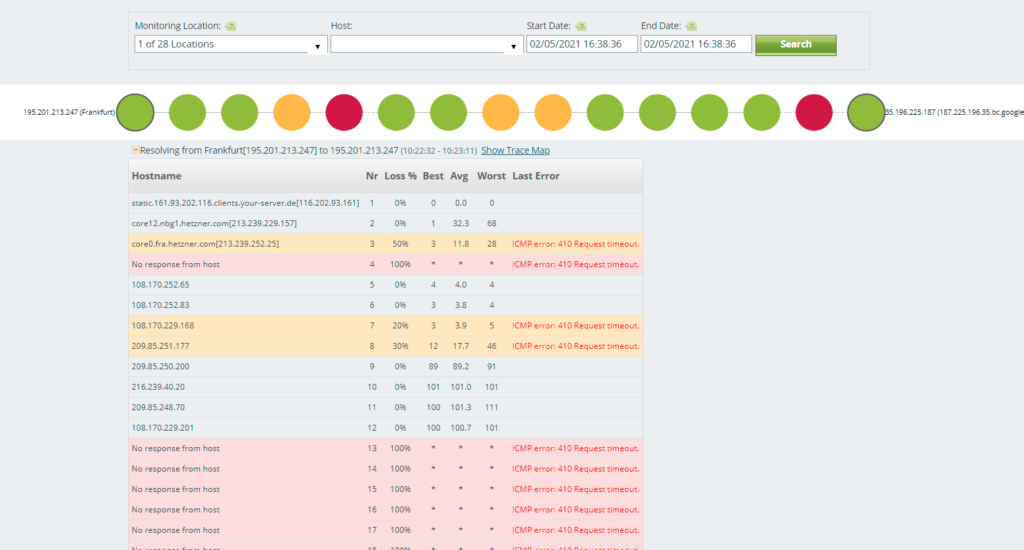
- Green Circle. Indicates a hop through which packets pass without any losses.
- Yellow Circle. Indicates a hop where packet losses were detected.
- Red Circle. Indicates packets were unable to pass through this hop. Red circles will also be connected by a dashed line to more easily distinguish where packet loss occurred.
It is important to note that errors detected may or may not be related to the traceroute data. Therefore, a visual traceroute is an effective tool in helping you diagnose and troubleshoot issues, giving an immediate visualization of traffic performance. If you look at a traceroute and do not see any yellow or red nodes, then it is very likely that your errors are not related to traffic routing issues.
However, if you happen to notice red or yellow nodes, it does not necessarily indicate that the specific error you are troubleshooting is caused by traffic routing, but it does point you in the proper direction to further drill down and identify the issue(s). You can choose from any number of monitoring locations. Below are a couple examples of the visualizations and charts you can review within the Trace Route History page.
How to Manually Run Traceroute Tests
If you need to run network diagnostics on your Windows computer, you can start the tracert utility that utilizes ICMP (Internet Control Message Protocol) messages to execute the diagnostics check. To do this, enter “tracert” in the command line followed by the domain name or IP address of the server you need to check, for example:
tracert google.com
The traceroute result will contain the address of the intermediate router and the response time for each attempt in milliseconds.
If you are using the MAC OS, run the traceroute utility followed by the domain name or IP address of the server. For example:
traceroute google.com
For Linux systems, use mtr followed by the domain name or IP address of the server.
While executing a traceroute manually can help to tackle problems detected from your local device, it is not helpful at all when your website or another network device experiences availability issues from endpoints located all over the world. In addition, the absence of an interactive graphical network route visualization makes it tricky to quickly analyze the traffic performance and identify the hops with packet losses or other connectivity issues.
Online Traceroute Services
When we visit a website, the client, or browser, sends a request to the web server. The request is passed through various connection points along the way. If the connection with the destination web server is established and everything works properly, the web resource will be displayed in the browser. However, if the website we requested does not display on our device, it means that the request has not reached the web server.
To check if the server where the website is physically located is working properly, we can use special traceroute web services. Generally, using online traceroute services allows you to poll websites from different IP addresses and find out if they actually work and the problem is not on the website’s servers side or not. If you get an answer that the site does not work for everyone, then the problem is definitely on the target web server side.
At the same time, if the online test shows that the web resource does not work only for one location, it means the error occurs on the client side or somewhere in between. Opposite to a network diagnostic from a local computer, traceroute service helps not only trace the route from your computer to a target host but to receive a detailed picture of at which hops exactly the packet loss happened for requests from the clients from around the globe. If the server of an internet service provider is the source of errors, you can contact the provider to troubleshoot the issue. However, if errors are detected on any hosts further on the route to the target web server, then, there is nothing you can do about it.
Benefits of an Automated Traceroute Service
There could be many reasons why a website is unavailable, such as mentioned above issues with the Internet service provider, devices like routers and switches, or something completely different, such as the website server itself being down or temporarily unavailable. In this case, the visual traceroute should be the first method used to figure out exactly where the problem lies. Whatever the case may be, a traceroute test with a visual traceroute helps pinpoint where the issue is occurring by briefly looking at the DNS tree structure. The visualized DNS tree structure makes the troubleshooting process more efficient.
With Dotcom-Monitor service the test can be executed from the different locations around the globe with predefined frequency to instantly notify you in the case of errors.
Visit the reporting page on the Dotcom-Monitor website for more information on visual traceroute and all Dotcom-Monitor reports.