
Dynamic Adjustable Curve Load Tests allow users to change the load manually during the test runtime.
How it works
The test starts with the specified number of concurrent users. During the test execution, you can change the user load in live mode. You can also manually adjust the load distribution between LIs zones. The test report charts update as you adjust the load, giving you a visual representation of the test results in real-time.
Configuring a Dynamic Adjustable Curve
To configure the initial settings for the Dynamic Adjustable Curve, you need to set up initial test settings:
- The starting number of concurrent users to load the site within the Start with box.
- The maximum number of users at a moment in the Maximum box.
- The maximum test duration (in minutes) in the Duration box.
Once the initial settings are configured, proceed with Payload and Geo Distribution configuration as described in Getting started with Load Test Setup and start the test.
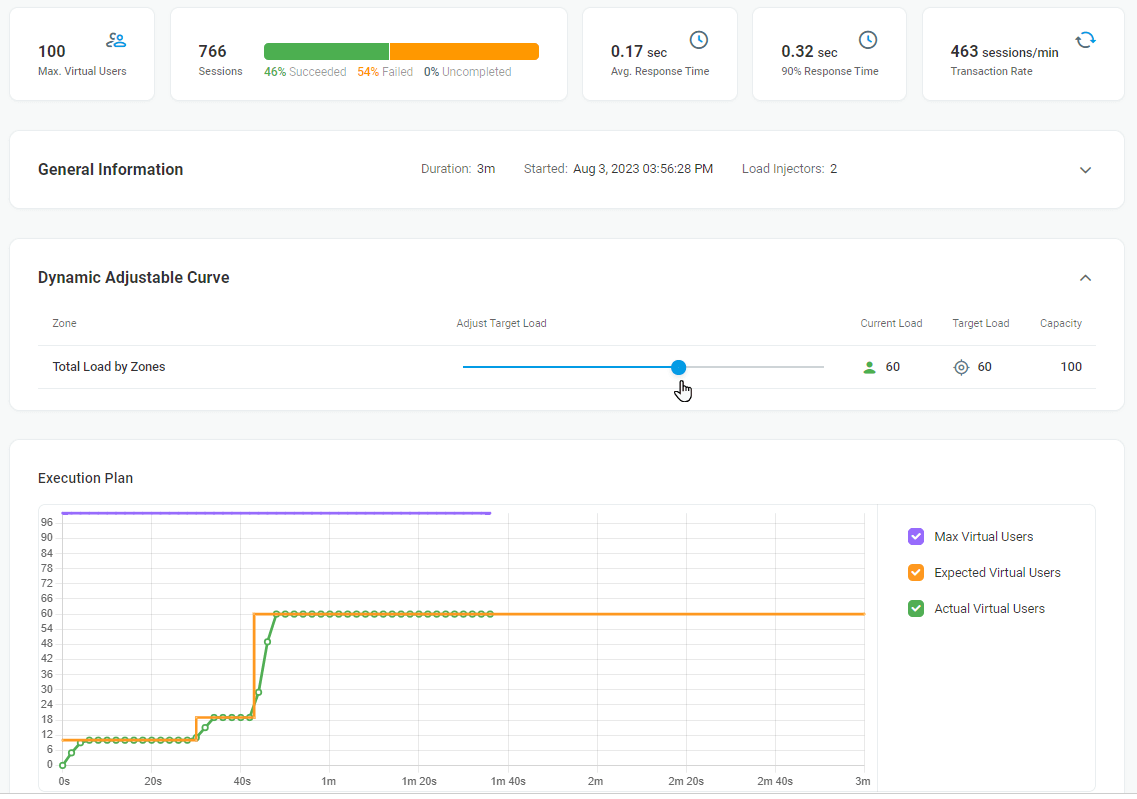
On the Report page, the curve of the actual number of virtual users in use appears on the Execution Plan chart.
In the Dynamic Adjustable Curve section, you can see the following test parameters:
- Current Load – the actual users number simulated currently.
- Target Load – the target number of users (may differ from Current Load, since LIs need some time to simulate the necessary number of users).
- Capacity – the maximum available number of concurrent users.
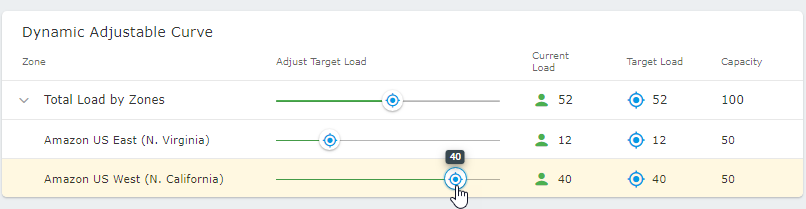
To change the load, simply move the slider to a target position in the Dynamic Adjustable Curve section.
If you have selected several zones, to adjust the load at each zone separately, expand the Total Load by Zones header and move a slider related to a necessary zone.
When the test finished, you can also review the test results on the Test Report page.