
The LoadView platform allows you to set up performance tests that can help to determine the web application breaking point, or to put it another way, the number of concurrent users at which performance degradation occurs or the application stops responding. Stress tests, unlike load tests which uses a pre-determined level of concurrent users to gauge performance under load, slowly increases the number of concurrent users until web application performance degradation occurs. Finding the web application breaking point is important for many reasons including the following:
- How the overall system and environment manages system failure and recovery.
- Determine if any additional hardware capacity or infrastructure is required.
- Observe performance metrics, such as disk I/O, memory, and CPU usage along with other server metrics.
Determining Load Curve Pattern and Concurrent Users
Determining the load curve pattern for load and stress tests are a key aspect of test accuracy. For example, if you start with too much load from the start, and the application responds with errors, it doesn’t necessarily mean that a lower load level can be handled successfully. In load testing, the load is generated by load injectors that simulate concurrent users visiting on the target application. So, a load pattern that is increased gradually with a specified number of concurrent users will be the better choice. In this way, you will be able better determine the point where failures or degradation occur to more efficiently remedy issues.
Another factor is deciding on the relevant number of concurrent users to simulate during the test. Web analytics tools, such as Google Analytics, could be the most preferable way to calculate a realistic starting load, but what should you do when you don’t have analytics data to start with? Read our Knowledge Base article for additional information regarding using web analytics to determine concurrent users for a performance test.
LoadView: Configuring Load Curves
The LoadView platform allows you to choose from multiple load curves, but when trying to find the breaking point of your web applications, you don’t want to execute a test with pre-defined concurrent users or throughput. For these reasons, the Load Step Curve and Dynamic Adjustable Curve are the preferred load curve options over the Goal-based Curve load curve when trying to understand an application’s breaking point.
We will discuss the most straightforward way to set up your load test scenario using the Load Step Curve
Calculating the Starting Load
To calculate the initial load for a load test, first consider the number of web servers in use as well as the number of CPU cores available. According to industry standards, 25 concurrent users per CPU core should be your starting point, but it’s recommended to start with a number 50 percent lower than the calculated starting point.
Starting point = 25 x Number of CPU cores
Recommended number of users to start with = (25 x Number of CPU cores) x 50 percent
For example, let us assume your web application is running on a quad-core web server. The number of concurrent users to start with would be calculated as follows:
Starting point = 25 x 4 CPU cores = 100 concurrent users
Recommended number of users to start with = (25 x 4 CPU cores) x 50% = 50 concurrent users
To specify the number of users to start the test with, use the field of the Start with scenario step.
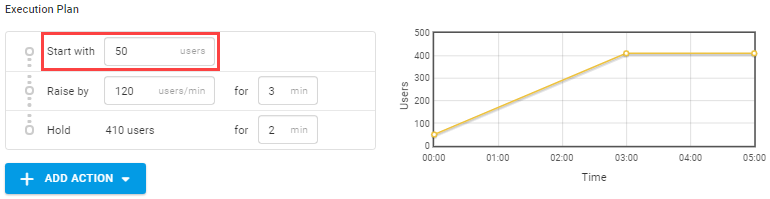
Configuring the Load Curve
Ramp-up Rate
It’s recommended to raise load by 25 percent of the starting point value at each ramp-up step.
To specify the number of users to raise the load per minute, use the corresponding field of the Raise By step.
For the described example, we have the ramp-up rate equal to 25 users per minute.
Test Duration
The test duration depends on the maximum load you want to generate. It’s recommended to raise the load to a value of 5-10 times more than the starting point depending on what are the performance requirements of your application:
- If you need to raise the load 5 times, set 20 minutes as the Raise By step duration.
- If you need to raise the load 10 times, set 40 minutes as the Raise By step duration.
In our example, let’s run the test with a duration time of 40 minutes, so the maximum number of virtual users will be about 1,000 users.
When the load curve is set, start the test and check the test report for the results. The reports will include a summary, or outline, of the test and will include graphs and line charts showing the changes in load levels and response times during the test. Other sections within the report include the log of test sessions and device information.
Read our Load Test Reports Knowledge Base article for additional insights, details, and explanations of load test reports.
Determining Web Application Breaking Point with Reports
Let’s consider a basic HTTP load test with a starting load of five users per minute. See the load curve and the corresponding test results in the picture below.

In the above example, we see significant growth in response time and the number of errors within the period, shaded in yellow, on the charts. Depending on your requirements, you can consider any point during this period as the web application “breaking point.”
For example, if an error rate of more than zero percent is considered critical for the application, the first time errors appear (or when the server stops responding) can be considered the web application breaking point. Or, in the cases where response time is critical, the breaking point occurs when the response time exceeds a pre-determined threshold.
Load Testing Web Applications: Best Practices
Executing successful load and stress tests doesn’t happen without thoughtful planning and preparation. The LoadView platform provides performance engineers with the all the necessary cloud infrastructure and load testing features to help remove the traditional complexities and barriers, like having to dedicate resources for setting up a separate test environment and other time-consuming considerations that come with on-premises load testing (and LoadView also makes it much easier than using an open-source tool like JMeter).
Scripting Real-user Scenarios
One of the keys to ensuring successful web application test results is creating scenarios that match how your users and clients use and move through your web applications. Matching behavior is a critical element when beginning the load tests process. Learn more about the EveryStep Web Recorder.
Real users can be unpredictable, so keep in mind that some level of unpredictability and randomness will be required. Within the LoadView test setup, you can choose from user behavior profiles or create custom configurations to better simulate user behavior. Read more about configuring User Behavior Profiles on our Knowledge Base article.
Executing Tests from Multiple Regions
Part of ensuring that you receive the best load and stress testing results is the ability to test from the locations where your users are located. Your public web applications are available to anyone, at any time, with an Internet connection and a browser. LoadView provides more than 20 global cloud (AWS and Azure) network locations to configure load and stress tests. Your tests should also be configured to match the regions or cities where the bulk of your users access your web applications.
Matching User Devices and Network Conditions
Setting up and configuring tests to match where your users are located, along with popular browsers, devices, and network connectivity, such as 2G/3G/4G, allow you to better fine-tune your tests and gain better insight into performance at the device/browser level. The LoadView platform supports over 40 desktop and mobile browsers/devices.
Performance Baselines
While it is necessary to find the point at which your web applications start degrading, it should not be the first thing you set out to find. If you have never carried out load tests on your web applications before, it is recommended to run load test scenarios that match your typical, everyday traffic levels before moving into stress tests. Initial load tests under normal traffic conditions may uncover some opportunities to make enhancements to your application before running full-scale stress tests under peak traffic.
LoadView: Finding the Web Application Breaking Point
With features like real browsers, the EveryStep Web Recorder, and geo-distributed load injectors, LoadView provides not only performance engineers, but anyone with the ability to quickly create test scripts for real-world user scenarios and execute load and stress tests against those web application scripts to understand performance from around the world.