
This article explains how to monitor the availability of a network drive using a PowerShell script and MetricsView. The configuration attempts to connect to a network share, sends custom metrics to Dotcom-Monitor, and triggers alerts when the network share becomes unavailable.
Prerequisites
Before configuring monitoring, ensure you have:
- Access to your Dotcom-Monitor account.
- A configured MetricsView Custom Collector.
- Administrative access to the target Windows server.
Step-by-Step Guide
Step 1: Create a MetricsView Custom Collector
- Navigate to Manage > MetricsView Collectors.
- Click New Collector.
- Configure the collector:
- Enter a descriptive name.
- Set Collector Type to Custom Collector.
- Copy the Collector ID.
- Save the collector.
You will use the Collector ID later in the monitoring script.
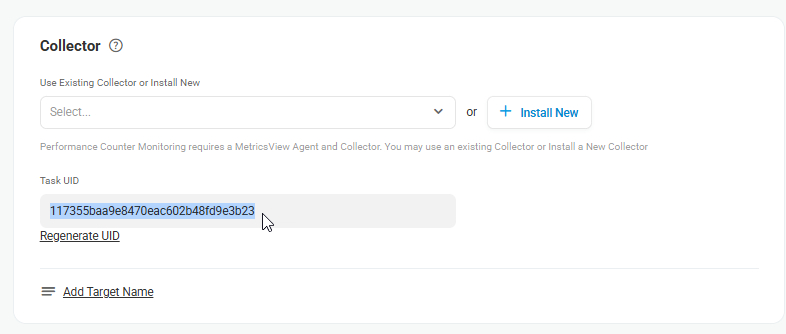
Step 2: Create a Custom Metrics Device
- Create a new Custom Metrics monitoring device.
- In the Collector section, select the collector created in the previous step.
- Configure the task settings:
- Under the Error Thresholds tab, set the Aggregate Type to Minimum (recommended) or Maximum.
- Configure alert thresholds as based on your monitoring needs. See the Configure Alert Threshold section of this step for the recommendations.
- Leave other fields at their default values unless customization is required.
- Copy the generated Task UID. The Task UID identifies the metric that receives process status values.
- Save the device configuration.
Configure Alert Thresholds
The script returns the following values by default:
1000— The network share is accessible and successfully attached.0— The network share cannot be accessed or attached.
These values can be used to trigger alerts based on the monitored network drive state. We recommend using the Minimum aggregation type, so you can set the Min. Threshold value to any value less than 1000 to detect the “The network share cannot be accessed or attached” event.
Step 3: Create the Monitoring Script
Save the following NetworkMonitoring.ps1 script in your environment:
param (
    [string]$collector = "",
    [string]$task = "",
    [string]$network = "",
    [switch]$debug = $FALSE,
    [switch]$log = $FALSE,
    [int]$success = 1000,
    [int]$internalerror = 0
)

add-type @"
using System.Net;
using System.Security.Cryptography.X509Certificates;
public class TrustAllCertsPolicy : ICertificatePolicy {
    public bool CheckValidationResult(
        ServicePoint srvPoint, X509Certificate certificate,
        WebRequest request, int certificateProblem) {
        return true;
    }
}
"@
[System.Net.ServicePointManager]::CertificatePolicy = New-Object TrustAllCertsPolicy

cls

$i = 0;
$value = "`n"

if ($collector.Length -eq 0){
  $value += "Can't proceed as Collector ID is not set.`n"
  $value += "Please set Collector ID as -collector <Collector ID>`n"
  $i++;
}

if ($task.Length -eq 0){
  $value += "Can't proceed as Task UID is not set.`n"
  $value += "Please set Task UID as -collector <Task UID>`n"
  $i++;
}

if ($network.Length -eq 0){
  $value += "Can't proceed as Network Folder name name is not set.`n"
  $value += "Please set Service name as -network <Service Name>`n"
  $i++;
}

if ($i -eq 3){
"Please use command-line options:"
""
"-collector <Collector ID>      Custom Collector ID that is used to collect data"
"-task <Task UID>               Task ID that is set for collecting statuses"
"-network <Network Folder Name> The monitored Network Folder name"
""
"-log                           Enable System EventLog notifications"
""
"You can set status code values that are used to describe state:"
""
"-success <number>              Network Folder is accessible (default 1000)"
"-error <number>                Network Folder is unavailable (default 0)"
""
exit;
}

if ($i -gt 0){
    $value
    exit;
}

try {
    $chkresult = $internalerror

    try {
        $XNetwork = New-Object -ComObject "Wscript.Network"
        $XNetwork.MapNetworkDrive("", $network)
        $chkresult = $success
        echo "SUCCESS: " + $network
    }
    catch {
        $chkresult = $internalerror
        echo "ERROR: " + $network
    }

    echo "RESULT: " + $chkresult
}
catch {
    echo $_.Exception.Message
}
Step 4: Prepare the Target Server
Start PowerShell as Administrator on the Windows server where the monitored service runs.
Navigate to the directory containing the monitoring script. Example:
cd C:\ps\
Enable PowerShell script execution if required:
Set-ExecutionPolicy RemoteSigned
You may need to confirm the execution policy change.
Step 5: Run the Monitoring Script
Use the following syntax to execute the script:
.\NetworkMonitoring.ps1 -collector <Collector ID> -task <Task UID> -network <Network Share Name> -log
Requirements:
- Collector ID: Available under Manage > MetricsView Collectors.
- Task UID: Found in the MetricsView device settings while editing the task.
- Network Share Name: Must exactly match the network share name in your environment.
To view additional usage information, run:
.\NetworkMonitoring.ps1
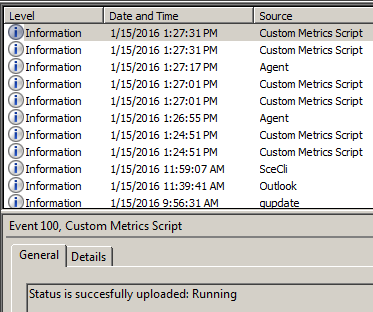
Step 6: Verify Script Execution
With the –log command you can verify if the script is working correctly in the event viewer. Review Event Viewer entries to confirm the script is successfully collecting and sending service status information. By default, the logging is done to the Microsoft Management Consol only.
Step 7: Schedule Automatic Execution
Set up the script to run periodically through Windows Task Scheduler or any other tool you use to run scripts.
Customizing Service Status Values
The service status can be in 2 states. You can override default service state values by specifying custom parameters:
-success <number>
-error <number>