
If you have been using Postman to test Web API performance or monitoring Postman traffic with Dotcom-Monitor, the Postman Collection Task can be a very fast and effective tool to set up a load test in LoadView. To start with configuring a load test, all you have to do is create a Collection from the existing Web API calls in Postman and upload it to Dotcom-Monitor.
-
What is Postman?
What is Postman?
Postman is all about API development. It’s an API client that allows developers and teams to create, test, share, and document APIs through a single platform. It provides various features, like manual and automated testing, collaboration, and creating documentation for your APIs. Postman even includes the ability to set up mock servers and monitors, so developers can make requests that can return test data to ensure functionality before moving into production.
Having these features in a platform allows development teams to streamline the API development process and deliver a more refined, higher-quality API in a short development cycle. Postman supports a plethora of API calls, including REST, SOAP, and HTTP, and API languages such as OpenAPI, GraphQL, and RAML. It also supports various authentication and authorization methods, including OAuth, API Keys, Basic Auth, Bearer Tokens, and more to ensure the API request is sent safely and securely. The best part for developers is that they do offer a free account to get started. Larger teams can take advantage of paid plans that allow access to more features and functionalities.
In Postman, users can make requests to retrieve or send data from API endpoints without having to create code or a terminal. These requests are made using the standard HTTP methods, such as GET, POST, PATCH, PUT, and DELETE, however, there are additional types of request types offered that users could take advantage of within the Postman interface.
Along with creating requests, each request can be named individually, depending on the action being requested. For example, if you are sending a GET request asking for a country or state, you could name that request “GET country” or “GET state,” which makes it easier to search for it later. After the request has been made, Postman will also show users the HTTP status code, like a 200 OK response, and how long it took for that request.
When to choose the HTTP Task instead of the Postman Collection Task
There is an aspect you need to consider upon configuring a load test using a Postman Collection, but first, let’s talk a bit about what a Postman Collection is and some of the background behind this Postman feature.
A Postman Collection is a collection of saved requests that developers use to build for a specific use case that they can then organize into folders and access whenever they need. For example, a collection could be created for fetching specific user resources or information after a user has logged into an API. Instead of having to go back to find all these different requests individually, you can put them into a collection. This makes it easy to group all your requests in one place and quickly access them later. Furthermore, users can specify authentication details for an entire collection or set them individually by request.
In LoadView, each script of a Postman test is executed by a dedicated process. Due to particularities in load allocation on the Load Injector Servers, LoadView can execute up to 30 processes at a time on a single Load Injector Server. So, you can set up the system to run up to 30 concurrent users per Load Injector. In terms of payload, this means that the more concurrent users you want to run while testing the more Load Injectors you need to use for the load test. This can increase the overall cost for large load tests (see Load Injector Pricing).
In the case when you need to scale up many concurrent users, please consider converting the Postman Collection to the multi-request HTTP load test as described for Rest Web API load testing. Since an HTTP test is not executed in a single process it doesn’t require as many Load Injector resources as the Postman Collection Task. Usually, for the HTTP test, you can run from 500 to 1000 concurrent users on a single Load Injector Server. So, you can scale the payload into much higher numbers than with Postman Collection Task without a significant increase in overall cost.
Creating a Test
Before you begin the task configuration, prepare the Postman Collection to be imported to Dotcom-Monitor as described in Uploading Postman Collection to Dotcom-Monitor.
Once you have selected the Postman Collection task, you will be prompted to import a Postman collection and adjust the task settings.
Import
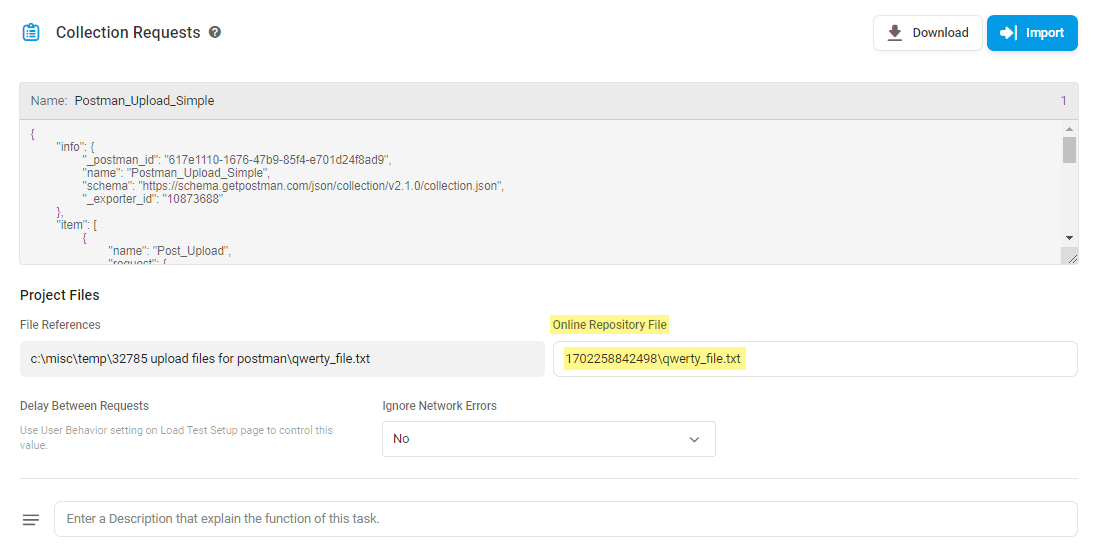
Click Import and select a suitable option to upload the collection. You can upload the JSON file with the Postman collection or provide the public link to the collection (if it was published). The collection script will be displayed in the Collection Requests section.
File Upload
If your Postman collection contains a reference to a file, once imported into LoadView the name of the file will be shown in the Project Files section.
The system automatically generates an online repository path to store the file in the LoadView cloud. The path appears in the Online Repository File field. To use the file in the test, you need to upload the file to the provided repository.
To upload the file to the online repository, please make sure to save the test, and then create a support ticket with the following information:
- The name of the LoadView test.
- The Online Repository File path as appears in the test target settings.
- A copy of the file to upload. Please attach the file to your ticket.
Please allow some time for our team to process your request.
User Behaviour Profile
The User Behavior Profile controls how the system emulates user interactions during a test. For instance, using minimal delays runs the test at maximum speed without any delays between test sessions, which helps identify performance limits under stress conditions. You can adjust the profile settings to match your specific testing needs. For more details, see User Behavior Profile.
Delay Between Requests
A delay (in seconds) between each request in the collection. The delay time is considered in the response time calculation.
Ignore Network Errors
By default, Dotcom-Monitor checks Postman network requests on network errors. If network errors are not your concern, you can configure the system to filter out this type of error. If the Ignore Network Errors option is set to Yes, Dotcom-Monitor will not raise an error on failed Postman requests. However, you will be able to see the HTTP errors in the related test session report.
Time Validation Threshold
A time interval in seconds the task should wait for the completion of requests and collection execution before ending the task and returning an error. In the case of timeout, Validation Error will be generated on the test device validation.
Request Timeout
A time interval in seconds the task should wait for a response on a single request from the collection.
Script Timeout
A time interval in seconds the task should wait for the assertion script completion before ending the task and returning an error. The maximum script timeout is 30 seconds.
Ignore Error Codes
If you want to ignore an error with a specific code and type while testing, you can configure the Ignore Error Codes option in the test target settings. If the system detects a response with the specified error type and code, the response will be considered as successful and its status will be changed to OK. Note that ignored errors will not be reflected on the reports and can’t be tracked down.
You can find a comprehensive list of Error Codes in the HTTP Status Codes List | HTTP Error Codes Explained article of this wiki.
API Performance Testing Limitations with Postman
Postman can be used to automate many of the everyday test types that developers carry out manually, such as unit testing, functional testing, integration testing, regression testing, mock testing, and more. Developers and teams can also automate testing by integrating with popular CI/CD tools, like Jenkins, to test your builds.
However, in order to carry out performance testing with hundreds or thousands of concurrent users, Postman users will need to utilize a third-party load and performance testing solution. This is where the LoadView solution can really be a great way to quickly and easily carry out performance testing for your APIs. Up to this point in the development process, a lot of work and time has been dedicated to ensuring functionality. Don’t let that go to waste by foregoing performance testing.
Performance testing takes functional testing to the next level to make sure your APIs will stand up to real-world conditions. You don’t want to blindly push code into production without testing first. You risk users encountering a less than desirable experience. By testing API response times and reliability while under load, you can get a better understanding of how your API will react and perform under peak traffic conditions and adjust resources and capacity as necessary. Postman does offer a feature called Postman Collection Runner, but it’s not a substitute for true end-to-end performance testing.
The primary goal of the Postman Collection Runner is to show if your requests pass or fail as they run consecutively. Postman doesn’t have the functionality to run large, high-volume load tests within the platform. It’s great for testing API functionality and checking to see if requests result in valid responses or not, but if you’re API is going to ultimately be used by a large number of concurrent users, you’ll want to make sure your systems and serves are going to be able to handle the expected load to your API.
LoadView Test Scenario and Execution
Once you’ve finished importing your Postman Collection and test settings, you can begin the final process of setting up your scenario and executing your load test. LoadView provides multiple test curve options to best suit your test goals. Options include the standard load step curve, goal-based curve, and dynamically adjustable curve. Each type of load curve provides you the ability to set multiple concurrent user levels and rates of transactions for the duration of your tests.
- Load Step Curve: Allows you to set your performance testing execution plan with a starting number of users, as well as additional actions, such as the amount of time to hold or raise the number of concurrent users
- Goal-based Curve: Adjusts the concurrent users to meet a pre-defined rate of transactions.
- Dynamic Adjustable Curve: This allows you to increase or decrease the number of concurrent users while the test is running, so you can see how your system responds.
Learn more about these load curves and additional LoadView test scenario settings.
One of the last steps in the load testing scenario is to choose where to run your test from. The LoadView platform offers over 20 worldwide locations that best match where your users are located to get a better idea of performance by location.
The LoadView platform aims to streamline your performance testing goals and processes. LoadView doesn’t require any additional hardware or network to manage, allowing your teams to quickly set up and run your performance tests without the hassles that other platforms require.