
Device Manager provides an overview of all devices configured in your account.
Once a device has been created, it appears in the list on the Device Manager page.
In the Device Manager list, you can see at a glance the number of devices, the status of the device, the frequency of monitoring on each device and the timestamp the device was last monitored. You can also quickly perform several actions relating to devices, including enabling, postponing, and silencing a device as well as cloning a device or task, deleting a device or task and running a status report or an SLA report.
Adding a New Monitoring Device
Click the New Device button to begin adding a new device.
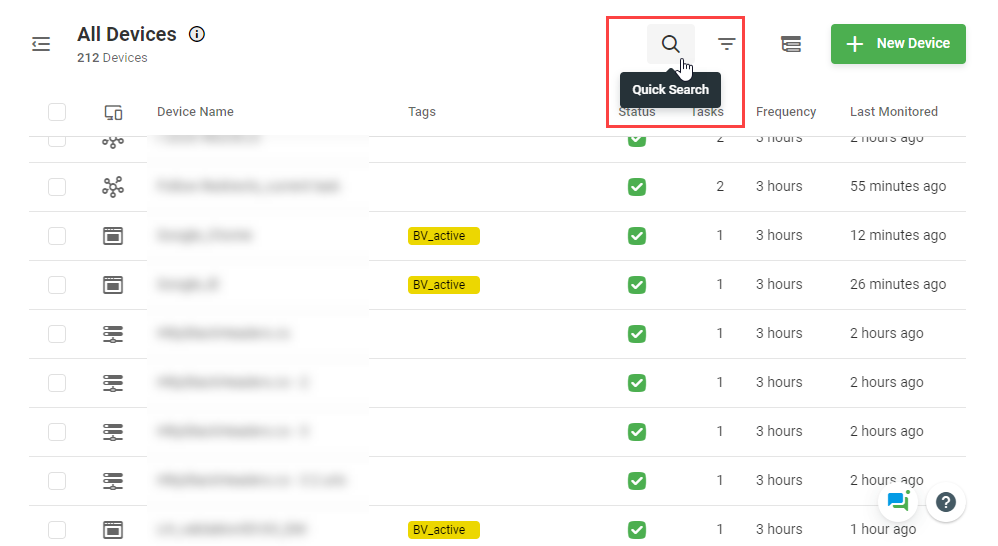
How to Search a Device in the List
To find a device with a specific name in the list of existing devices, in the search field next to the Device Manager header, begin typing the name of a device you are looking for. The list will be filtered according to the entered characters.
Note that it is important to give your devices a very specific name so that you can easily find them later.
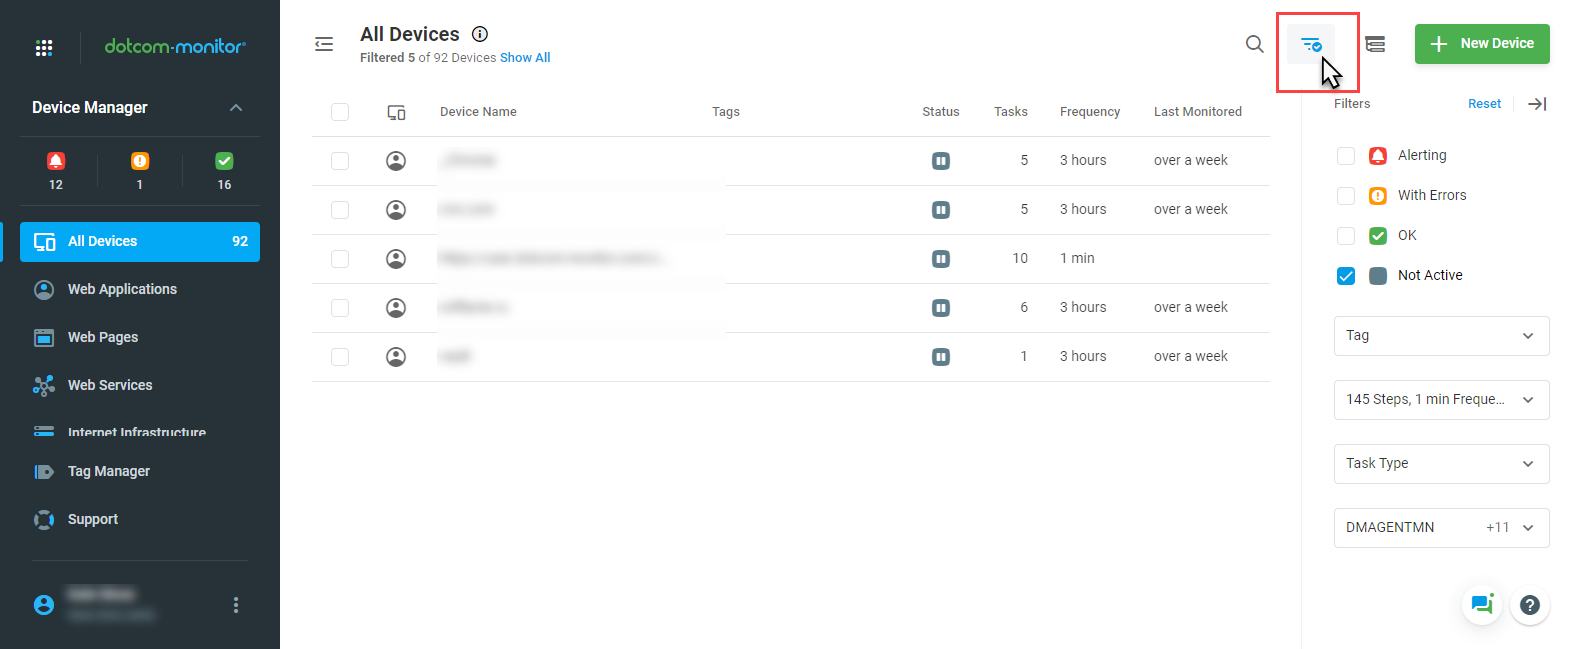
How to Filter Devices by Attributes
The list of devices can be filtered by the following attributes:
- Device status
- Package
- Tag
- Task Type
- Location
Click the filter icon in the Device Manager header. From the Filters panel, you can select the necessary filters. The list will be automatically filtered according to your choice.
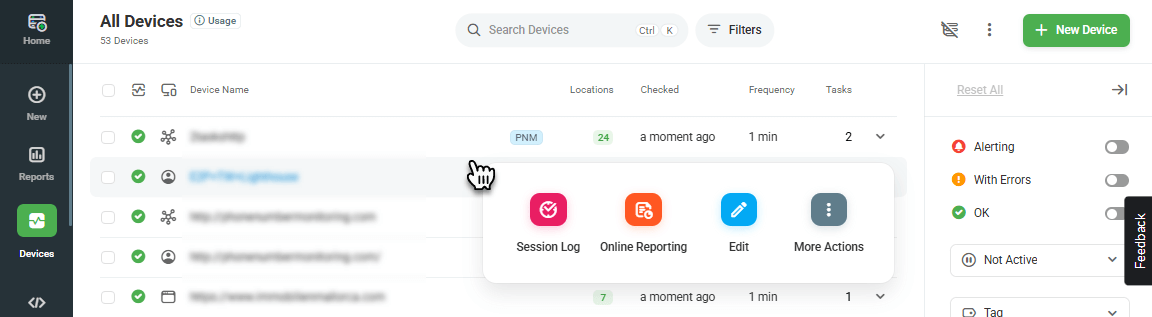
Device Management
To manage a device, click the device in the list and use actions from the Quick Access pop-up menu or access More Actions under the “three dot” ![]() button in the device row:
button in the device row:
- Reports: you can select to configure and generate such reports as an Online report for the device in a brand-new form, SLA report, or Legacy Report (same as Online Report but in a different form).
- Edit: opens the page for editing the device.
- Frequency: you can select a frequency you need to run the device with from the list.
- Locations: opens a monitoring locations dialog for editing.
- Tag As: opens Tag Manager. See more on using tags in Dotcom-Monitor in Using Tags.
- New Target: add a new monitoring target to a WebView or ServerView device. See more in Adding Several Targets within a Single Device.
- Postpone: stops the monitoring process for the specified period. See more details in the Postponing Monitoring During Routine Maintenance article.
- Run Now: runs monitoring the device regardless of the scheduler.
- Postpone > Unpostpone: activates monitoring of the postponed device.
- Clone: create a copy of the device.
- Delete: deletes the device.
- Alert Silence: disable alerts for the device for 10, 30, 60, or 180 minutes.
- Send Test Alert: sends a test alert email.
Bulk Actions
To complete a certain action on multiple devices at one time::
- Select the devices in the list.
- On the toolbar in the list header, click the necessary action button.
How to Disable Alerting for a Device
To temporarily disable alerting for a device:
- Click the device menu button
 .
. - On the device menu, point to Alert Silence.
- Select a period of time for disabling(silencing) alerts – 10-minutes, 30, 60, or 180 minutes.
If the option is configured, the alert for a device will be silenced for a specified period, and the device will be marked with the mute icon ![]() in the list. This temporary alerting limitation covers all alert types.
in the list. This temporary alerting limitation covers all alert types.
How to Clone a Device
To clone a device, on the device menu, select Clone.
The page will refresh, and a copy of the device will be appended to the list of devices with the word “copy” added to the end of the device name. The clone will include all settings of the original device.
How to Test Alert Notifications
To make sure the notification emails don’t get caught in spam, use the Send Test Alert option from the device menu in Device Manager after configuring a new device.
Instant Monitoring Check with Run Now
The Run Now feature simplifies the operation of a device during situations when you’re working on “urgent” issues. By selecting the Run Now action, you instantly initiate a monitoring check from all “spare” (specified for the selected device, but currently free of active sessions) monitoring agents. This can be especially helpful when you need fast, fresh monitoring results while addressing “urgent” issues.
To Run Now, select Run Now from the device menu.
Quick Access to Online Reports
Online Reporting is available from the Quick Access pop-up menu.
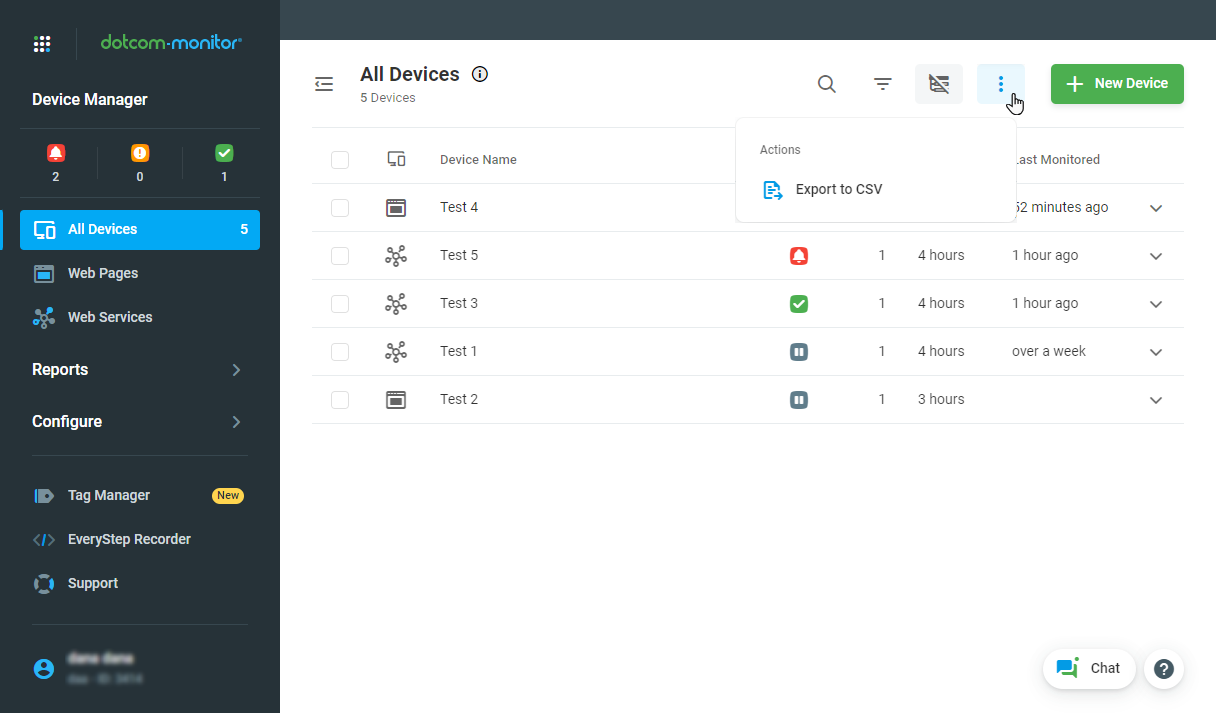
Export the Device List to CSV
To export the list of the devices presented on the Device Manager screen, from the manager’s action menu, select Export to CSV.
Monitoring Platforms
Depending on the type of packages you have purchased, you may see a Monitoring Platform appear in the list on the left sidebar menu more than once. To learn the difference between available packages, please contact sales.