
The standard deviation (STDDev) response time value is used in reports to provide greater depth of analysis. It shows how much variation there is from the average, or mean. A low deviation value indicates that the data points tend to be very close to the mean, whereas a high deviation value indicates that the data are spread out over a large range of values. A low standard deviation implies that there is a more stable, or consistent, performance within the system.
For example, if you wanted to understand the response times of a particular user scenario, such as logging into an account, searching for an item, and then logging out of the account, you might see the average response times for all transactions are relatively the same, however, it does not tell you the full story. Within each iteration that is happening, individual response times may vary dramatically. For better insight into the consistency of a particular step, or transaction, standard deviation is a better metric to evaluate.
In real-world scenarios, it’s often hard to calculate standard deviation as it relates to web page or web application response times, especially with large sets of data that include performance data from multiple monitoring locations, which is why it is necessary to use a solution, such as Dotcom-Monitor, that can easily automate and calculate the standard deviation as it relates to response times.
Calculating Standard Deviation
A solution that utilizes real browser-based synthetic monitoring, such as the Dotcom-Monitor platform, can be used to continually monitor and evaluate response times of web applications, web pages, APIs, and more across various global locations. This data can then be aggregated and organized to understand performance from the perspective of real users, helping to ensure uptime and availability across different geographies and where areas of improvement are necessary.
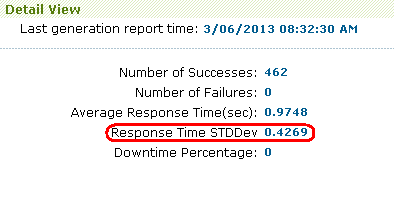
In other words, a higher value shows that something is causing response times to jump around and this indicates unstable service performance.
The Dotcom-Monitor solution utilizes the formula below for calculating the standard deviation value. In this calculation, x represents the duration and n represents the response quantity.
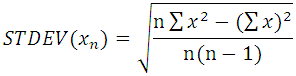
Let’s break this calculation down further to better understand how the standard deviation is calculated.
Step 1: Calculate the mean. The mean is simply the average of all the response times. This is calculated by adding all the response times together and divide by the total number of transactions.
Step 2: Calculate variance. Variance is calculated by taking each response time and subtracting it from the mean. Note that this may end up with a negative number, but each result is squared, so it will become a positive number. The last piece is to add up each of the squared values.
Step 3: Calculate standard deviation. This last step is fairly straightforward. Simply take the total of all the squared values from the previous step and find the square root of that value. That will be your standard deviation.
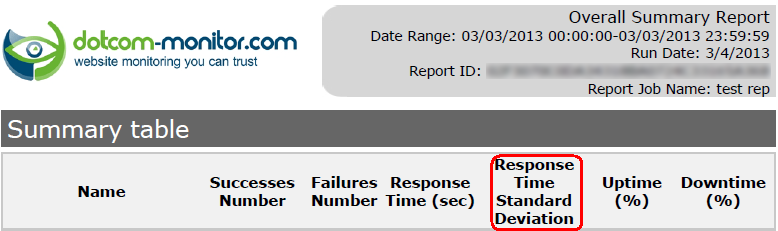
Dotcom-Monitor Reports
Within the Global and Online Reporting options, you can view performance data, such as average response, uptime and downtime, waterfall charts, and standard deviation across monitoring solutions and monitoring tasks. To see an example of the types of reports available, visit our Email Global Reports Knowledge Base article.
Additionally, for scenarios where Web Application monitoring or Web Page monitoring was used, a video playback is available for users to review. Video playback is synced with a waterfall chart, along with network metrics, to help visually pinpoint where errors occur within web applications or web pages. For more information about running Online and Performance Reports within the Dotcom-Monitor platform, visit our Online Report Overview Knowledge Base article.