
Monitor Status is a core Dotcom-Monitor dashboard that provides an at-a-glance overview of the monitoring events from all monitoring locations. Monitor Status dashboard accumulates key monitoring reports provided for the last 24-hour period for all devices created in a Dotcom-Monitor account. That allows users to track the most recent monitoring results from one screen.
In this article, we will learn how to configure the data sources for your dashboard, use the visualization to assess the health status of your monitoring targets all over the globe, and determine geo regions and monitoring devices that require your attention.
Monitor Status Dashboard Intro
The Monitor Status dashboard can be reached from the Reports menu on the left sidebar. Monitor Status dashboard includes different report types and provides access to more detailed in-depth data for further investigations.
Monitoring Environment Summary
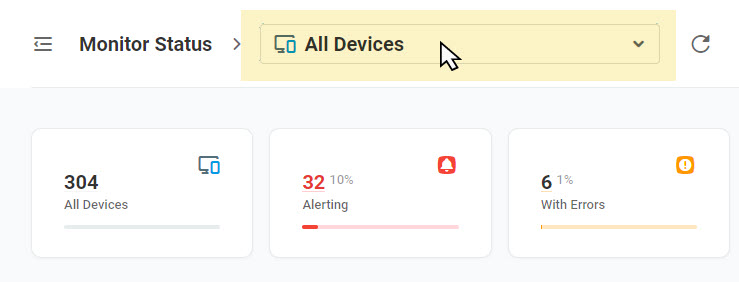
At the top of the Monitor Status screen, you can find widgets that provide a summary of your monitoring environment with such metrics as the total number of devices, the number of devices with errors and successful monitoring results, and the number of postponed devices. Clicking a widget will take you to the Device Manager screen with the list of devices filtered by the corresponding status.
Last Events Feed
The right sidebar provides access to the feeds of the last events reported by monitoring devices or recorded in the system. The sidebar can be configured to show one of the following feeds:
- Device State – recent device states reported within the last 24 hours. Click a record in the feed to see a detailed report with Device Sate Events history on all active monitoring devices.
- Audit Log – recent records from the audit log of your account with detailed action descriptions available by clicking the corresponding record in the feed. Follow the related Report link to navigate to the full version of your account’s audit log. Please check the Audit article for more details.
Monitor Status Reports
The following report widgets are presented in the main area of the Monitor Status dashboard:
- Stats By Location – an interactive map that aggregates monitoring error statistics from all available monitoring agents for the last 24 hours.
- Last Error Responses – a report that accumulates 10 recent error responses received from all active monitoring devices for the last 24 hours.
- Last Check By Location – a pivot table that summarizes monitoring results reported for 10 recent checks executed for the last 24 hours.
Customizing Monitor Status Dashboard
To narrow down the set of data sources for the Monitor Status dashboard and concentrate your attention on the specific devices, apply filters available by clicking on the All Devices field at the top of the Monitor Status screen.
Stats By Location Report
The Stats By Location interactive map facilitates tracking of monitoring error statistics by geographical region by displaying the geolocation of a monitoring agent in a color that reflects the accumulative status of the devices assigned to this location. Color depends on how critical the monitoring issues in a specific location are. For example, red for locations with more than two monitoring errors reported within the last 24 hours.
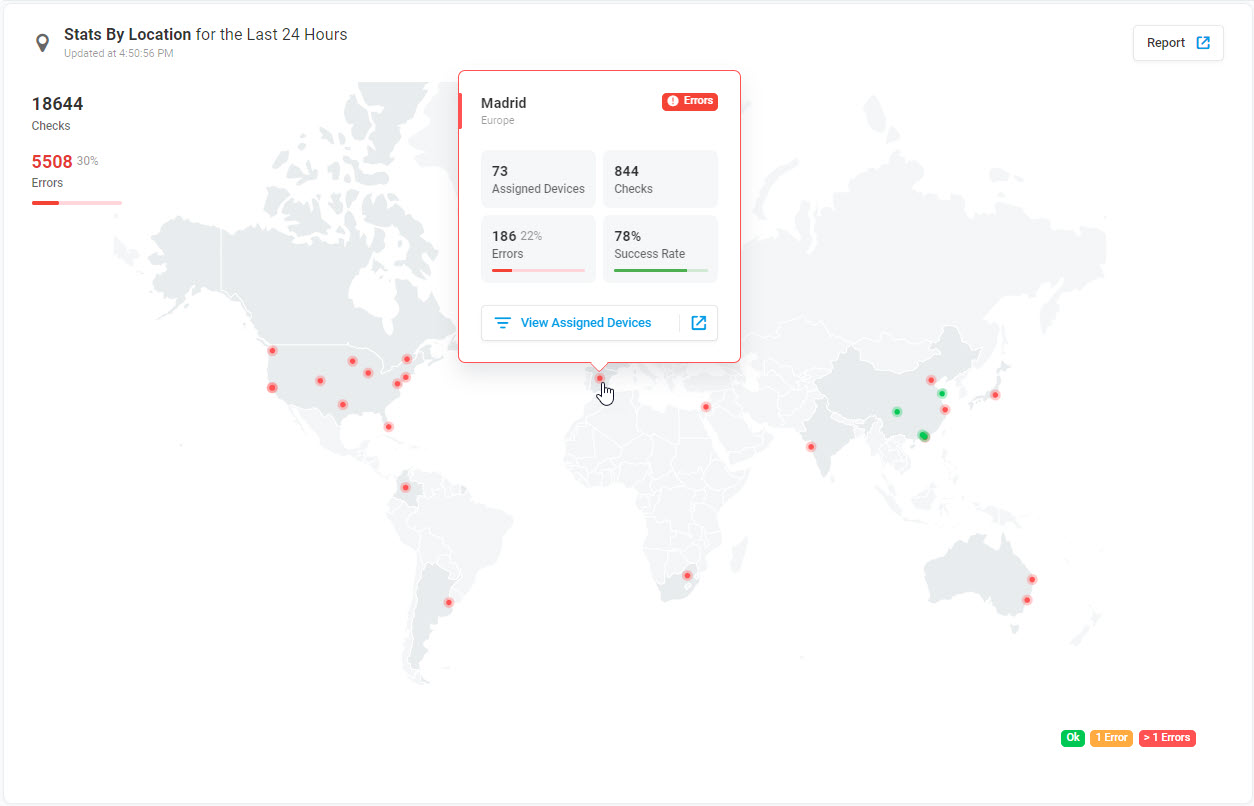
To see statistics for a specific location, point at the location on the map. To get the list of the devices assigned to the location, on the location’s info tooltip, click View Assigned Devices. The devices that are monitored from the selected location will be listed in the Device Manager window.
Creating Shareable Report Card
You can create a shareable report card to share the link to the Stats By Location report with other users on the Internet by copying and pasting the unique GUID-based URL into an email or other document.
To configure and generate the report card, follow the Report link at the right top of the Stats By Location widget, and click Create Card at the right top of the report card screen. Configure the card settings as described in the Stats By Location Report Card article of this wiki. Once the card has been created, to share the link to a newly created report card, copy the shareable link by clicking the link icon at the right top of the report card preview window.
You can access the Stats By Location report card for editing, revoking access, previewing, and copying the link from within the Shareable Report Card manager (left sidebar menu > Reports > Shareable Report Cards).
Last Error Responses Report
The Last Error Responses report shows 10 recent monitoring sessions with errors and provides brief error descriptions and direct access to an in-depth session report with a Waterfall Chart for each response with errors. To see a brief error description, hover over the error status in the corresponding report line.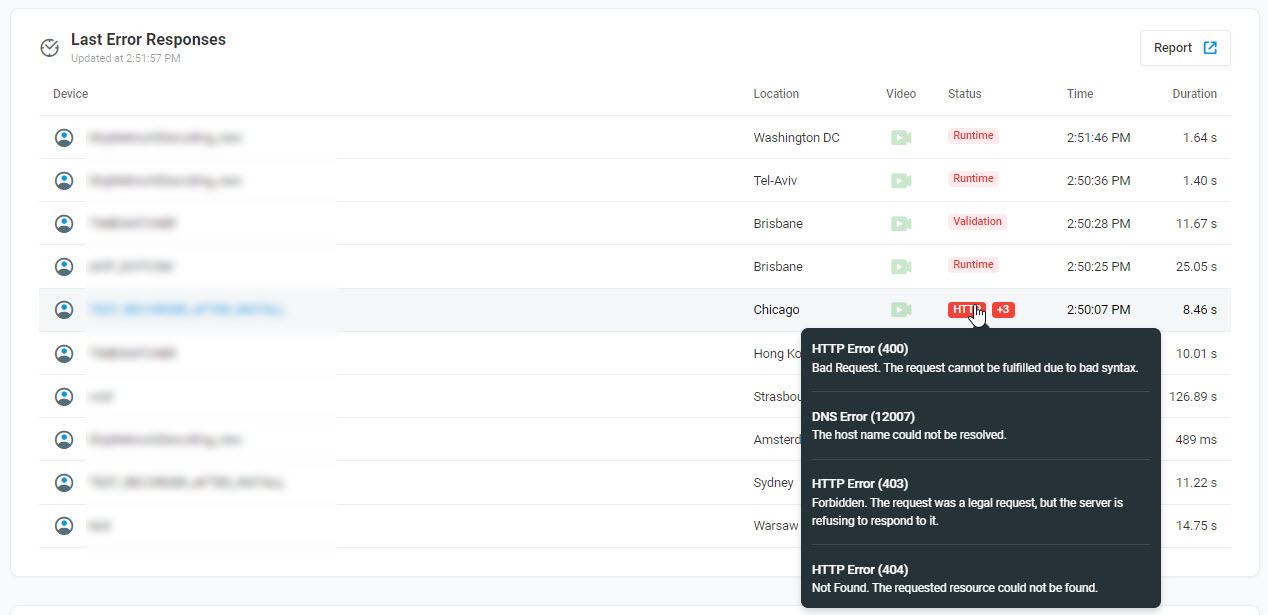
To continue error troubleshooting, you can pull a detailed session report for the response. To access the session report, click the related record in the Last Error Responses list. The report will be opened in a new tab showing the element-by-element chart with load times provided for each web element requested within the session.
To see the 100 most recent monitoring sessions, follow the Report link at the right top of the Last Error Responses widget. The Monitoring Session Log report page will be opened in a new tab. To show only records of sessions with errors in the feed, use the With Errors filter available under the Filters menu on the right sidebar of the feed screen.
Last Check By Location
The Last Check by Location report displays response statuses per device from assigned locations.
The responses are color-coded to easily identify whether the most recent response:
- Green for a successful response.
- Red for a failed response that returned errors.
- Grey for an undefined status.
Creating Shareable Report Card
You can create a shareable report card to share the link to the Last Check By Location report with other users on the Internet by copying and pasting the unique GUID-based URL into an email or other document.
To configure and generate the report card, follow the Report link at the right top of the Last Check By Location widget. To configure the card settings and generate a unique GUID-based URL for the card, click Create Card at the right top of the report card screen. Configure the card settings as described in the Last Check by Location Report Card article of this wiki. Once the card has been created, to share the link to a newly created report card, copy the shareable link by clicking the link icon at the right top of the report card preview window.
You can access the Last Check By Location report card for editing, revoking access, previewing, and copying the link from within the Shareable Report Cards manager (left sidebar menu > Reports > Shareable Report Cards).
To find more information and guidelines, visit the Shareable Dashboards article of our Knowledge Base.