-
Where can I find my account ID?
You can locate your Account ID in two ways:
Option 1: From the Login Page
- Go the Select an Account page after signing in.
- Your Account ID is displayed next to each available account in the list.
Option 2: From Within the Platform
- Log in to your Dotcom-Monitor account.
- In the left sidebar, hover over the Account menu (profile icon).
- Your Account ID will appear in the account details panel.
If you have access to multiple accounts, make sure you reference the correct Account ID for your request.
-
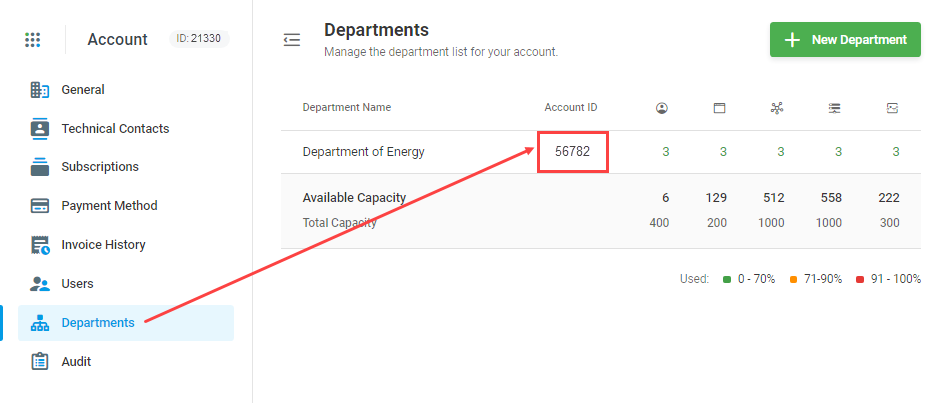
Where can I find my Department ID?
Once logged in into a master account you can find your Department IDs under Account > Account Settings > Departments.

-
How can I get a specific device ID?
To find a device ID:
- In Device Manager open the device edit page.
- Check the browser address bar for a URL similar to:
https://user.dotcom-monitor.com/c11111/client/monitoring/edit-device?id=311193
- The value after id= is the device ID. In this example, the device ID is 311193.
-
How can I get a specific task (target) ID?
To find a task ID:
- In Device Manager, expand the device entry to view the list of tasks.
- Open the task edit page.
- Check the browser address bar for a URL similar to:
https://user.dotcom-monitor.com/c11111/client/monitoring/edit-device?id=311193&taskId=626573
- The value after taskId= is the task ID. In this example, the task ID is 626573.
-
How do you define Downtime?
The approach provides the ability to carefully define how Dotcom-Monitor interprets responses as either “Up” or “Down” responses. This is accomplished using filters.
Incidentally, a filter can also both be applied to a device (cutting false triggering) and to any type of reporting.
Filtering defines the Up/Down states using the following adjustable criteria:
- Error is reported for a specified number of minutes
- Error is confirmed by a specified number of agents
- Error is detected in a specified number of tasks.
All filters and their settings are available at Configure > Filters. After a filter is applied to a device all of the device’s notifications are based on the filter’s criteria. “Default Filter” is assigned to all new devices. The default filter has a balanced configuration and is suitable for most monitoring devices.
Uptime/Downtime Calculations
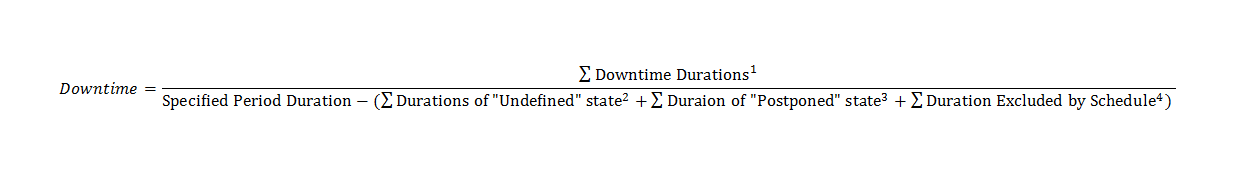
The formula for the Downtime calculation is as follows:

1. Downtime Duration is tied directly to the configurations within the filter:
- The Downtime period starts when a filter’s conditions are met. For example, when the number of agents which report a failure equals the number of agents specified in the filter, and as also specified the conditions are met for the number of minutes and tasks, then a downtime alert is sent.
- The Uptime period starts when the filter’s conditions are no longer met. Specifically, Uptime starts when the number of agents, minutes, or tasks, which have reported “up” success, no longer meet the conditions needed for the filtered “down” conditions. For example, an “up” state is indicated when the number of error (“down”) responses received by agents becomes less than the number of error (“down”) responses that agents need, as set in the filter, in order to indicate a “down” condition.
2. Duration of “Undefined” state. An Undefined state can be set when the status of each agent involved in monitoring becomes Undefined. An agent status is considered as Undefined if the agent does NOT provide any response (error or success) in a certain amount of time:
Response Wait Time Duration = (the overall agents number+1) × monitoring frequency + 15 min
For example, we use three monitoring agents and a monitoring frequency of 5 minutes. Each agent will wait for a response for Response Wait Time Duration = (3+1)×5+15 min = 35 min. Once the time expired and no response received, an agent reports Undefined.
3. Duration of “Postponed” state. Postponing a device at any moment will stop any monitoring activity until it is re-enabled.
4. Duration Excluded by Schedule. Another entity that can significantly affect Uptime/Downtime calculations is Schedules. This is an option for managing your monitoring during routine maintenance. Monitoring can be postponed for specific days of the week as well as specific hours and minutes during a day. To set up a schedule, follow the instruction.
Any change in a device settings (including device restart) during the Down state will reset the state so no uptime alert will be sent.
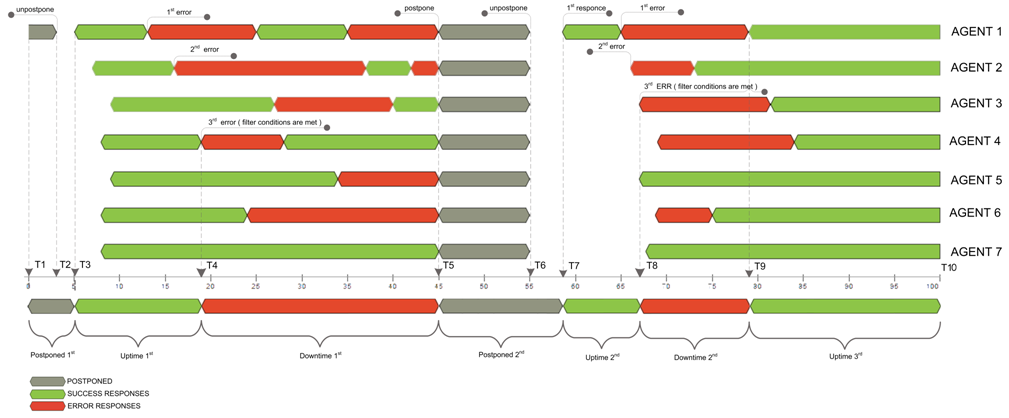
EXAMPLE:

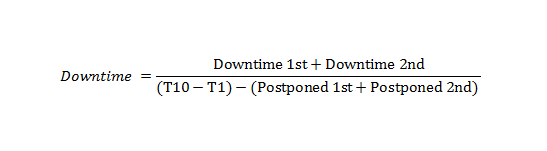
Let’s say we have device monitored from 7 locations and filter set that 3 locations must report an error for Downtime condition. First, monitoring node (agent 1) detects an error while the rest are still reporting success, then the second (agent 2) and at last third one (agent 4) detects an error at T4 which triggers filter to set Downtime beginning right from this moment. The Down state will remain until you set hypothetical Postpone at T5 because of the number of agent reporting errors higher than adjusted 3 throughout all this time. The time gap between T6 and T7 is an illustration of the fact we get the first response with a delay (monitoring session processing time includes network transfer delays and the execution itself), so “Postponed” time is being calculated as ∆ (T7–T5) (Postponed 2nd). Again, we fall into Downtime only on 3rd error from Agent 3 and get in the Up state only on the T9 response, when the number of failing agents becomes less than adjusted in the filter. Here comes the final downtime % calculation formula for this case:

-
Why do I receive errors from the Shanghai (China) monitoring agent?
The “Shanghai” (China) monitoring agent, is located behind the Great Firewall of China, which is administered directly by the Chinese government. The Chinese government has a filtering rule in place for all Internet traffic and it is not public. These filtering rules are modified frequently, which, in turn, affects monitoring results from the Shanghai, China Agent.
-
How to easily add a new monitoring agent to multiple devices?
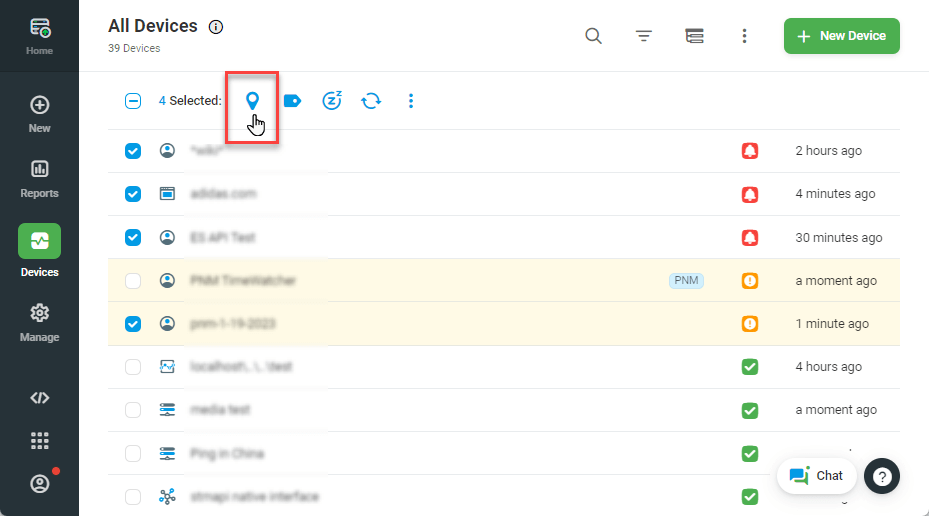
You can edit the monitoring agent locations for multiple devices at once on the Device Manager screen.
- Click Devices on the left sidebar.
- From the Device Manager, select the devices you wish to update by checking the boxes next to each device.
- Click the Locations button on the group actions toolbar.

- In the Monitoring Agents window, add or remove locations.
- Save changes.
-
What Is the difference between HTTP(S) and BrowserView/UserView Tasks?
In short, UserView and BrowserView Platforms’ tasks load a web page in a real browser and execute all page components, while HTTP(S) Task uses emulated “synthetic” browser and only downloads page element that was requested without rendering.
For more more details, see Differences between Monitoring via HTTP(S) and via BrowserView/UserView and Differences in Time Measurement Between HTTP(S) and BrowserView/UserView Tasks.
-
What is the difference between various round trip email monitoring methods?
By default, exchange servers recognize if an email address is local. If this is the case, the server does not send the email across the public internet. This is a default of most email servers.
If you wish to test sending and receiving across the public internet we recommend using our round trip email monitor + a 3rd party email account such as Gmail.
Our Round trip email monitoring requires the use of POP3 or IMAP protocols either at your location or at the 3rd party (gmail).
There are three ways to test this with Round trip:
Test Outbound
- Set up SMTP to send the email from our external monitoring locations via your SMTP server by entering the SMTP server address. (This tests that your SMTP server is working)
- Enter an email address to send the email to (gmail.com for example)
- Enter the gmail POP3/IMAP server address so the monitoring location can retrieve the email from the SMTP server.
Test Inbound
- Set up SMTP to send the email from our external monitoring locations via gmail SMTP server by entering the gmail SMTP server address.
- Enter an email address to send the email to (an account in your system)
- Enter your POP3/IMAP server address so the monitoring location can retrieve the email from the SMTP server.
Test Outbound and Inbound
- Set up SMTP to send the email from our external monitoring locations via your SMTP server by entering the SMTP server address.
- Enter an email address to send the email to (gmail.com for example)
- Setup the gmail account to auto forward back to your POP3/IMAP email account on your server.
- Enter your POP3/IMAP server address so the monitoring location can retrieve the email from your server.
Test ActiveSync
ActiveSync protocol also performs a round trip. Active sync DOES test the ability to send an email from a remote device (our monitoring locations) and to retrieve an email from the server by that remote device. But it does not send the email from one active sync server to another because the sending and receiving account are the same account on the same server, so it finds the shortest route to a local address does not require sending the message to the public internet until the message is retrieved from a remote device (our monitoring locations).
Here is the difference between Round Trip and ActiveSync- you can see email move across multiple servers using a 3rd party email provider such as gmail, while the email resides on 1 server using activesync:
3rd Party Round Trip Email Path
- Dotcom-Monitor “email client” sends a message across the public internet
- Customer’s SMTP Server forwards the message to 3rd party account on the public internet
- 3rd part (gmail) email server Receives the message
- 3rd part (gmail) Auto forwards to Customers Email Server across the public internet
- Dotcom Monitor “email client” requests email from Customers POP3 or IMAP server across the public internet (or directly from the 3rd party gmail, if you do not auto forward)
ActiveSync Email Path
- Dotcom-Monitor “email client” sends a message across the public internet
- Customers ActiveSync Server forwards the message and finds the account is local so it sends it straight to the account, not sending it out to the public internet
- Dotcom Monitor “email client” requests email from Customers ActiveSync Server across the public internet
-
Runtime Error (130) The request was aborted
When viewing the details of an online report on http/s devices you may notice the following error “Runtime Error (130) The request was aborted” in the log but the actual monitoring result displays a success. This error may occur when Internet Explorer begins a request for specific elements on a web page but then cancels the request. You may notice that a particular request occurred multiple times in the task and succeeded during a different attempt at which point the server determined that it did not need to duplicate the request.
-
How do I use the API?
The API is locked down by an IP address to only allow authorized users access. Upon configuring a Web API Integration (Manage > Integrations > New Integration), you must enable access to data beyond your Dotcom-Monitor account via the Web API. Please visit How to Whitelist IPs for Web API Access for details.
For more information on how to use the API, visit the API getting started page.
-
Common reasons for False Positives
After you set up tasks with alerts and they begin running, you may find yourself receiving multiple alerts, yet when you check the service or website, everything looks fine. It is important to pay attention to the contents of the alerts in order to figure out what is causing the error. Some errors may contain custom Dotcom-Monitor error codes, while others may contain http status codes that can help you decipher the cause of the error.
Due to the detailed nature of the Dotcom-Monitor monitoring capabilities, you may want to tweak your alerts, reports, or your recorded scripts to exclude certain elements or errors to eliminate false positives. Some of those reasons include:
- One or more monitoring locations are timing out while the rest of the locations are succeeding.
- Changes have been made to your site and certain elements that were expected are no longer found.
- Something on your website is responding slowly, causing the system to think it no longer exists,
- Network traffic is causing your site to slow down and exceed timeout limits.
- A “hiccup” in network traffic across the internet or from one monitoring location
- Third party elements are loading slowly and timing out.
- URLs to third party elements have been changed.
You can adjust for these false positives by creating Filters and applying the filter to the alerts and reports of the offending device.
You can also enable the False Positive Check on your devices. This will trigger a cascade of checks from a location that discovers a monitoring failure in order to confirm that the device is erroring more than once
-
How do I input a large number of items (devices / tasks / filters / schedules / etc.)?
The easiest way to create a large number of objects items (devices / tasks / filters / schedules / etc..) in the Dotcom-Monitor system is to open a support ticket and ask the support team for assistance.
Please be prepared to provide a spreadsheet with a list of all the objects that you want to be created. If required, the spreadsheet should be attached to the support ticket, so the support can make the necessary changes for you.
-
How do I view a Dashboard?
Once you have created a dashboard, you can view it at any time by copying and pasting the url into a new browser window. You do not have to be logged in to the system in order to view a dashboard.
To find the URL of the dashboard,
- Log in to Dotcom-Monitor and navigate to Manage > Shareable Panels or Shareable Report Cards.
- Expand the accordion menu containing your dashboards and use the actions button to the right of the dashboard you wish to access.
- Selecting Preview will open the dashboard in a new window while clicking Copy URL will copy the URL of the dashboard to your clipboard.
Now you can save the URL to a file, email the URL to others, or paste it into a browser window and bookmark the address to easily access it in the future.
-
Can I disable/silence device alerts for more than 3 hours?
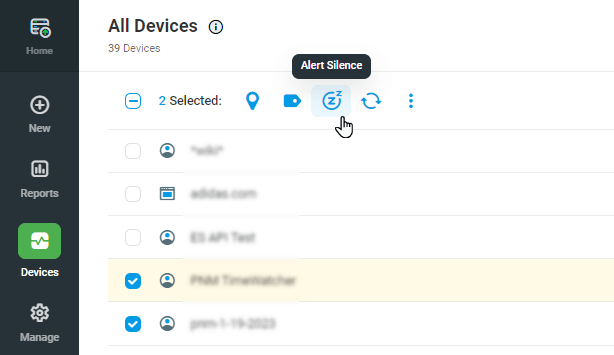
You can silence individual device alerts for up to 24 hours from the Device Manager by clicking actions next to the device, selecting Alert Silence, and silencing for the desired period.
To silence multiple devices at once, click the checkbox next to each device you wish to silence, and then click the Alert Silence button at the top of the list, and select the period you wish.

You can also use the API to silence alerts for more than 24 hr. For information on how to do this, checkout API: Disable Alerts for a Device.
-
We are receiving many alerts that the site Is down, how do we fix It?
Dotcom-Monitor systems offer a robust set of monitoring tools that should be carefully adjusted to detect the level of performance required for each monitored target. Due to the number and variety of alerting factors, you may need to tweak some of the settings on your monitors in order to eliminate false positives.
To determine if the alerts you are receiving are valid, check out this article on identifying false positives.
If you still do not wish to receive alerts the way they are currently configured, running an online report from the Device Manager for the time during which you received the alerts will give you more insight into what is triggering the alerts.
Maximum Time Expired
If the error on the online report states “(300) task Maximum timeout expired” this means that the task took longer to complete than the maximum timeout specified for the task. This may point to a legitimate issue, but it is up to you to determine at what point you need to receive alerts. If you feel that you are receiving too many alerts, you can edit the task and increase the max timeout limit.
Note that you can also increase the delay between alert notifications to reduce the frequency of messages received. For example, you may only wish to receive one alert every 15 minutes, even if more issues are detected between alerts.Location Specific Errors
If you are monitoring from multiple locations, but are only experiencing issues from a single location, there are several things you can check.
IP Restricted access
If your server access is limited via IP address, you should make sure that you have added the ip addresses of all monitoring locations to your IP address access list.
Security Certificates Required
If your server requires a certificate to access content, you must open a support ticket to upload the certificate to each monitoring location.
Great Firewall of China
If you are experiencing issues from a location in China, you may be seeing the results of the “Great Firewall of China.” As the Chinese government maintains tight control over what content is accessible from within the country, sometimes content is filtered out as inaccessible or bandwidth to certain sites are throttled so that elements from the site time out. In these cases there is often little you can do since the Chinese government is in control of the network.
Contact Support
If you are experiencing issues from one or a few specific locations, you can open up a support ticket and our support team will work with you to identify other possible issues. Sometimes there may be issues with a DNS server routing incorrectly, reverse DNS lookup, or an issue specific to the monitoring location.
UserView Timeouts
If you are running a UserView script, you may need to add a delay to the script to give the site more time to load all elements properly. You can also repeat the step, such as clicking on an href after adding a delay, so in case the link was not rendered on the page the first time, it will try to click it again.
-
Why didn't I receive an alert when an error was detected?
There are a number of factors that determine whether an alert message will be sent and to whom it will be sent.
When you create a device, a default filter is automatically applied to all devices. The default filter requires that more than one location (unless you only select one location) receives the error before an alert is triggered. This is done to eliminate false positive alerts when one location suffers from a small network hiccup. You can create a filter that does not require more than one location, but be aware that you will likely receive many false positive alerts due to the uncontrolled nature of traffic on the internet.
If you have applied a schedule to a device, the device will not be monitored during unscheduled periods, so no data will be recorded to set off an alert. We recommend that you do not apply a schedule directly to your devices so that the system is monitored 24/7 even if you do not wish to receive alerts around the clock. You can apply schedules to different alert groups so that different groups only receive alerts during their work shifts, for example.
When setting up group alerts, you can specify whether the group should receive a notification immediately when the error is detected, or if there should be a delay between when the error is first detected and when an error is sent. For example, perhaps you have a second tier support group that is only notified when an error continues to occur 30 minutes after the first tier support received an alert.
By default, the False positive check is turned on. This means that if a monitoring location experiences an error, it attempts to recreate the error before sending an error message. We do not recommend disabling this because it will increase the risk of receiving false positive alerts, however, if your task takes a particularly long time to complete one iteration, you may wish to turn off the false positive check so that you receive errors immediately rather than 10 minutes after the first error was detected (5 minutes to complete the first task, then when the error is detected, another 5 minutes to confirm the error)
Note that Alert groups can be set up and used for multiple devices. If you notice that someone is not receiving an alert, make sure that their contact information exists in all groups necessary. Be careful when editing or removing people from groups because that group may be used for additional devices.
-
We are receiving errors but our site is up?
There are many different errors that can occur while a website is still partially or fully accessible. Some of the most common errors that can occur while your website still appears to be available include:
- A Timeout has been exceeded
If the error specifies that a timeout has occurred, edit the monitoring task details and look for a Maximum Timeout value. If you are getting many timeout errors you may want to consider increasing the max timeout value or removing it altogether. Alternatively, you can perform updates to your site to improve load speed or host individual elements at a content distribution network (CDN). If you have not specified a Maximum Timeout value, then the default timeout for a task is 120 seconds.
- Text or images that are being validated are not found
If the task includes validating a particular keyword or image is found on the page, the rest of the content might still load properly while the expected element is missing.
- Elements on the page are loading slowly, causing the script to fail
Some validation may fail if the task looks for an element before the element has completely loaded. If the task is a UserView script, you may need to add a time delay before validating this particular element.
- DNS resolution may be failing for a subset of DNS servers
Sometimes, due to various networking issues across the internet or local service providers, one of the specified or top-level DNS servers may be unable to fully qualify the DNS resolution to your site. In this case, most browsers continue to query the next available DNS server and complete the resolution, but depending on how your monitoring is set up, you may still receive alerts. For more information on How to Troubleshoot DNS Errors, visit our knowledge base article here.
-
Why are we seeing errors but the task is successful?
In the Online report detail, when I expand an individual monitoring session to view granular details of the steps, why are we seeing errors but the overall monitoring task is succeeding?
There are a number of cases where an individual element or call to a server being monitored will result in a flagged or error response. Such responses are typically noted by a red exclamation mark and the text may be slightly grayed out.
- One cause of this type of flagged event could be that the website being monitored requires basic authentication. In this case, the first request for a URL would be flagged as an error because the server returns a 401 response letting the browser know that basic authentication is required. The next request is then sent from the monitor including the basic authentication credentials, which returns a successful response, so technically, the task completed successfully.
- Another possible cause could be that the requested element was already loaded from a previous request in the monitoring script, and once this is realized the request is canceled, but again, the task as a whole completed successfully.
- For additional insight into such anomalies, feel free to contact support by opening a support ticket.
Monitoring FAQ
-
Where can I find my account ID?
-
Where can I find my Department ID?
-
How can I get a specific device ID?
-
How can I get a specific task (target) ID?
-
How do you define Downtime?
-
Why do I receive errors from the Shanghai (China) monitoring agent?
-
How to easily add a new monitoring agent to multiple devices?
-
What Is the difference between HTTP(S) and BrowserView/UserView Tasks?
-
What is the difference between various round trip email monitoring methods?
-
Runtime Error (130) The request was aborted
-
How do I use the API?
-
Common reasons for False Positives
-
How do I input a large number of items (devices / tasks / filters / schedules / etc.)?
-
How do I view a Dashboard?
-
Can I disable/silence device alerts for more than 3 hours?
-
We are receiving many alerts that the site Is down, how do we fix It?
-
Why didn't I receive an alert when an error was detected?
-
We are receiving errors but our site is up?
-
Why are we seeing errors but the task is successful?