
The MetricsView platform monitors Linux processes, including Java applications, Asterisk, and custom services, using a shell script. The script sends process status values to Dotcom-Monitor and triggers alerts when a monitored process stops running.
Use this approach to implement heartbeat monitoring on Linux systems when service-level monitoring is unavailable or when you need visibility into individual process status.
Prerequisites
Before configuring Linux process monitoring, ensure the following:
- Access to a Linux server where the target process is running
- Superuser privileges to configure cron jobs
- MetricsView licenses available on your Dotcom-Monitor account
- The process name to monitor (for example:
java,asterisk, or another service)
How It Works
The monitoring workflow performs the following actions:
- A shell script checks whether a specified Linux process is running.
- The script sends:
2→ Process is running0→ Process is not running
- MetricsView receives the value.
- Alert thresholds trigger notifications if the process stops.
This enables monitoring and alerting behavior similar to standard Dotcom-Monitor performance tasks.
Step-by-Step Guide
Step 1: Create a Custom MetricsView Collector
- Login to your Dotcom-Monitor account.
- Navigate to Manage > MetricsView Collectors.
- Click New Collector.
- Configure the collector:
- Enter a descriptive name.
- Set Collector Type to Custom Collector.
- Copy the Collector ID.
- Save the collector.
You will use the Collector ID later in the monitoring script.
Step 2: Create a Custom Metrics Device for Process Status
- Open Device Manager.
- Click New Device.
- Choose Performance Counters > Custom Metrics.
- Enter a meaningful device name.
- In the Collector section, select the collector created in the previous step.
- Configure the task settings:
- Under the Error Thresholds tab, set the Aggregate Type to Minimum (recommended).
- Set Min. Threshold to 1.
- Leave other fields at their default values unless customization is required.
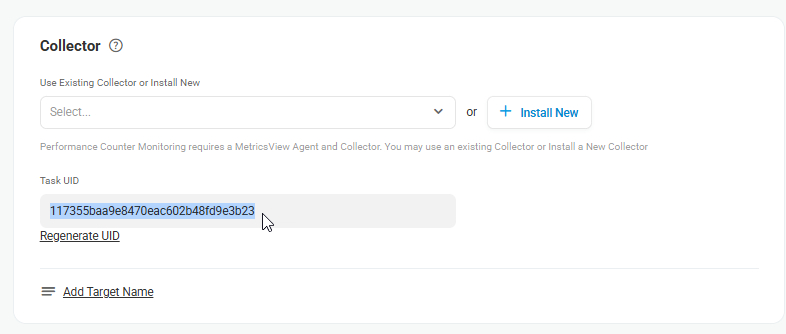
- Copy the generated Task UID. The Task UID identifies the metric that receives process status values.
- Save the device configuration.
This device configuration triggers alerts when:
Process stopped → Script sends 0 → Alert generated
Step 3: Create the Linux Monitoring Script
Create a shell script on the Linux server:
nano /root/check_process.sh
Paste the following script:
#!/bin/bash

# Validate input
if [ "$#" -ne 3 ]; then
    echo "Usage: $0 <CollectorUID> <TaskUID> <process_name>"
    exit 1
fi

COLLECTOR_UID="$1"
TASK_UID="$2"
PROCESS_NAME="$3"

URL="https://wdc.dotcom-monitor.com/apiv1/tasks/post/$COLLECTOR_UID"

# Full paths required for cron
PGREP=/usr/bin/pgrep
CURL=/usr/bin/curl

# Check process status
if $PGREP -x "$PROCESS_NAME" > /dev/null
then
    STATUS=2
else
    STATUS=0
fi

# Build JSON payload
JSON_PAYLOAD=$(cat <<EOF
{
    "$TASK_UID": $STATUS
}
EOF
)

# Send metric to Dotcom-Monitor
$CURL -s -X POST "$URL" \
-H "Content-Type: application/json" \
-d "$JSON_PAYLOAD" \
--max-time 10

exit $STATUS
Save and exit the editor.
Step 4: Make the Script Executable
Run:
chmod +x /root/check_process.sh
Step 5: Verify Metrics Are Being Received
Run the script manually using your values:
/root/check_process.sh YOUR_COLLECTOR_ID YOUR_TASK_UID PROCESS_NAME
- Collector ID: Available under Manage > MetricsView Collectors.
- Task UID: Found in the MetricsView device settings while editing the task.
Example:
/root/check_process.sh 4936df74a9d345f4aa754ab1d4e26cf8 117355baa9e8470eac602b48f79e3b23 asterisk
Expected behavior:
| Process Status | Value Sent |
|---|---|
| Running | 2 |
| Not running | 0 |
If the script executes successfully, continue to scheduling.
Step 6: Schedule the Script Using Cron
Open cron:
crontab -e
Add:
* * * * * /root/check_process.sh YOUR_COLLECTOR_ID YOUR_TASK_UID PROCESS_NAME > /dev/null 2>&1
This executes the script every minute.
Example:
* * * * * /root/check_process.sh 4936df74a9d345f4aa754ab1d4e26cf8 117355baa9e8470eac602b48fd9e3b23 java > /dev/null 2>&1
Step 7: Verify Data Collection
After adding the cron job:
- Wait several minutes.
- From whithin your Dotcom-Monitori account, locate your MetricsView device.
- Open the relevant MetricsView report ( e.g., a Device Overview or Session Log report).
- Confirm incoming values.

Expected behavior:
| Process Status | Value Sent |
|---|---|
| Running | 2 |
| Not running | 0 |
Continuous 2 values indicate successful monitoring.
Monitoring Multiple Processes
To monitor multiple processes independently and receive independent alerts for each process (for example, two Java applications), create:
- Separate Custom MetricsView devices
- Separate Task UIDs
- Separate cron entries
Example:
* * * * * /root/check_process.sh COLLECTOR_UID TASK_UID_1 java1
* * * * * /root/check_process.sh COLLECTOR_UID TASK_UID_2 java2
Troubleshooting
If no data appears:
Verify cron execution
Run:
crontab -l
Confirm the cron entry exists.
Verify process detection
Test:
pgrep -x PROCESS_NAME
If no output appears, the process name may be incorrect.
Verify script permissions
Check:
ls -l /root/check_process.sh
Ensure executable permissions are present.
Test the script manually
Run the script directly before relying on cron.