
Synthetic monitoring is a proactive performance testing method that uses scripted, automated transactions to simulate real user interactions with your applications — measuring availability, response time, and functionality before issues reach actual users.
If your application goes down at 3 a.m. or slows to a crawl in a region where you have no real users yet, you need to know about it quickly — within the next probe interval — not when a customer complaint lands in your inbox. That’s exactly what synthetic monitoring is built for.
In this guide, we’ll cover everything you need to know about synthetic monitoring: how it works, the different types of tests, which metrics matter, how it compares to real user monitoring (RUM) and APM, and how to use it effectively in production. We’ll also surface the limitations no one talks about and share best practices used by SRE and DevOps teams at scale.
What is Synthetic Monitoring?
Synthetic monitoring — also called active monitoring, directed monitoring, or synthetic testing — works by deploying automated monitoring agents that continuously send scripted requests to your applications, APIs, or web services on a set schedule. These agents operate at different technical levels: lightweight HTTP agents that send requests to check basic availability and response codes, and sophisticated browser-based agents that run full browser engines to execute JavaScript, render pages, manage sessions, and simulate complex multi-step user interactions. Dotcom-Monitor’s EveryStep Web Recorder uses real browsers — not just headless engines — to record and replay any user action across 40+ desktop and mobile browser configurations.
Because these are scripted simulations rather than passive observations of real traffic, synthetic monitoring operates 24/7 regardless of whether any real users are active. You get consistent, reproducible performance data from controlled conditions — day or night, during peak traffic or quiet maintenance windows.
The term “active monitoring” distinguishes it from passive approaches like Real User Monitoring (RUM), which only captures data when actual users interact with the system. Synthetic monitoring doesn’t wait — it probes on a defined schedule so you can detect failures and regressions quickly, often within the next probe interval, rather than waiting for user reports.
How Does Synthetic Monitoring Work?
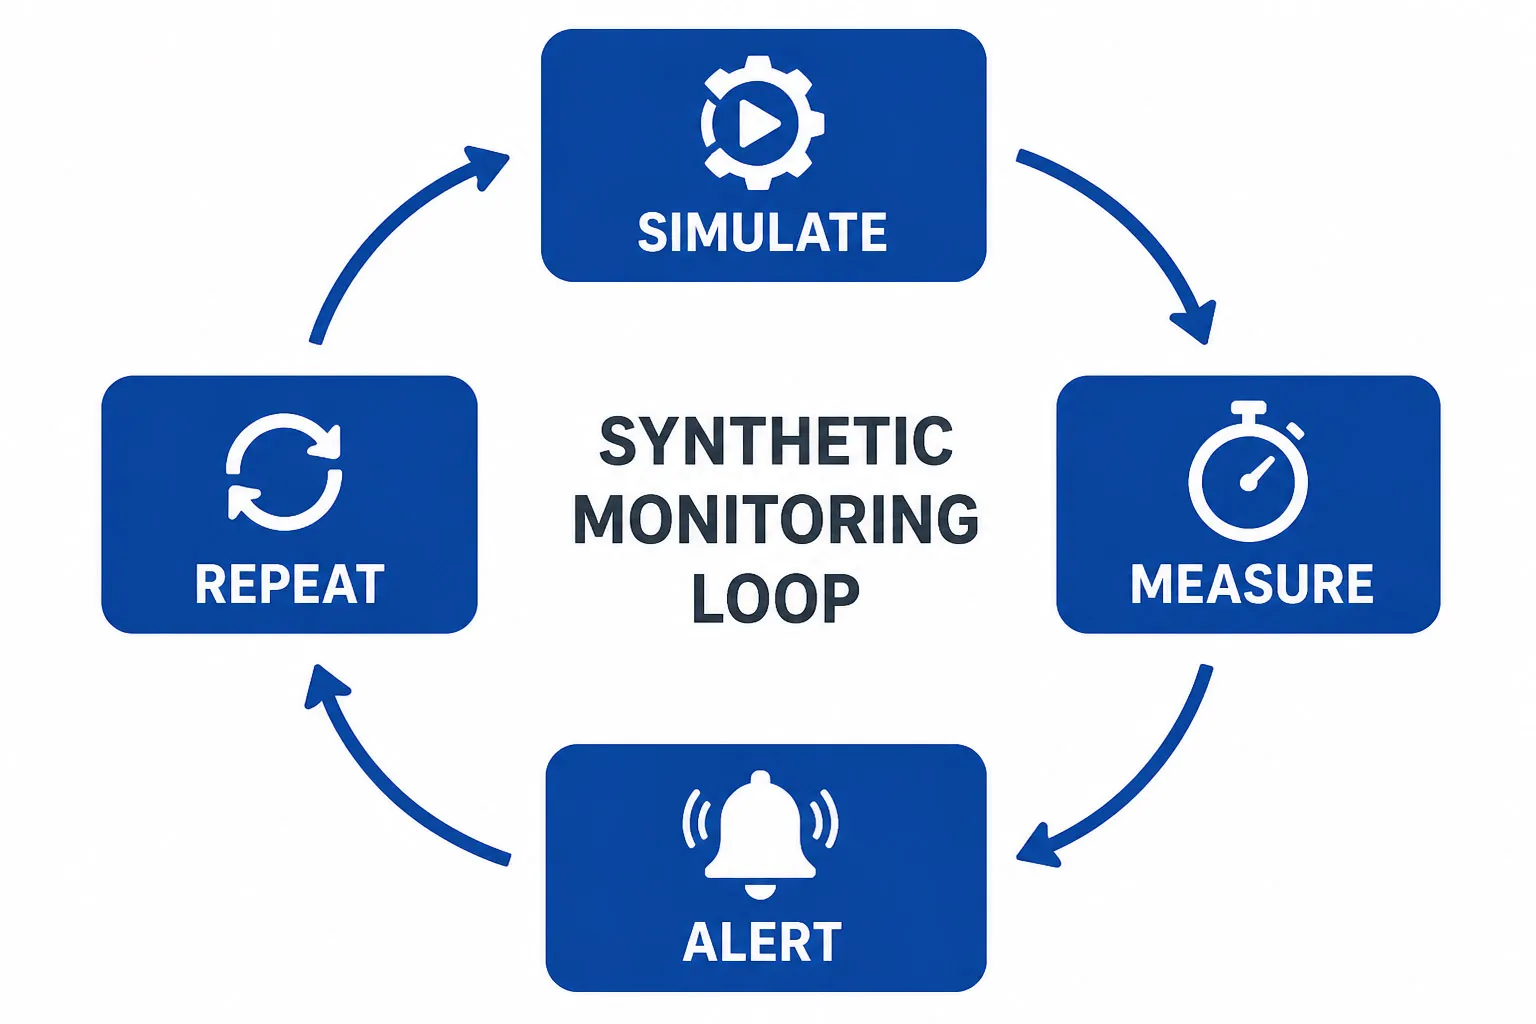
At its core, synthetic monitoring follows a straightforward loop: simulate, measure, alert, repeat. Here’s the step-by-step workflow:
- Define critical user journeys and endpoints. Identify which transactions matter most: login flows, checkout processes, API health checks, DNS resolution, and SSL certificate validity.
- Record or script your tests. Use a tool like Dotcom-Monitor’s EveryStep Web Recorder to capture real browser interactions — clicks, form inputs, navigations — which are saved as replayable scripts. For API and protocol checks, configure HTTP, DNS, or ping tasks directly in the platform.
- Deploy monitoring agents globally. Run tests from multiple geographic locations using public agents (30+ global locations) and/or private agents deployed inside your own data centers or network perimeter.
- Execute on a schedule. Tests run at configured intervals — as frequently as every minute up to every three hours. A monitoring agent transmits the scripted requests, waits for a response, and records the outcome.
- Measure technical and functional outcomes. Capture response times, HTTP status codes, page load time, Time to First Byte (TTFB), First Contentful Paint (FCP), and Core Web Vitals (LCP, CLS, and INP). Note that interaction metrics like INP reflect real user input and are best validated alongside real-user data — synthetic provides controlled, lab-style measurements.
- Alert on confirmed issues. Dotcom-Monitor sends alerts immediately upon detection by default. Configurable filters — such as threshold-based triggers, error-type conditions, or location-specific rules — let you reduce noise for less critical checks. For multi-step transaction tests, consider whether retrying a failed script may have unintended side effects before enabling automatic retries.
- Use vantage points strategically. A private agent passing a test confirms that specific service and journey is working from that internal vantage point — helping you isolate whether an issue is internet-facing, edge-related, or internal. External global agents measure the full user-facing path: DNS resolution, CDN edges, ISP routing, and geographic latency.
See Dotcom-Monitor’s Synthetic Monitoring in Action → Explore the Synthetic Monitoring Solution Page
7 Types of Synthetic Monitoring Tests
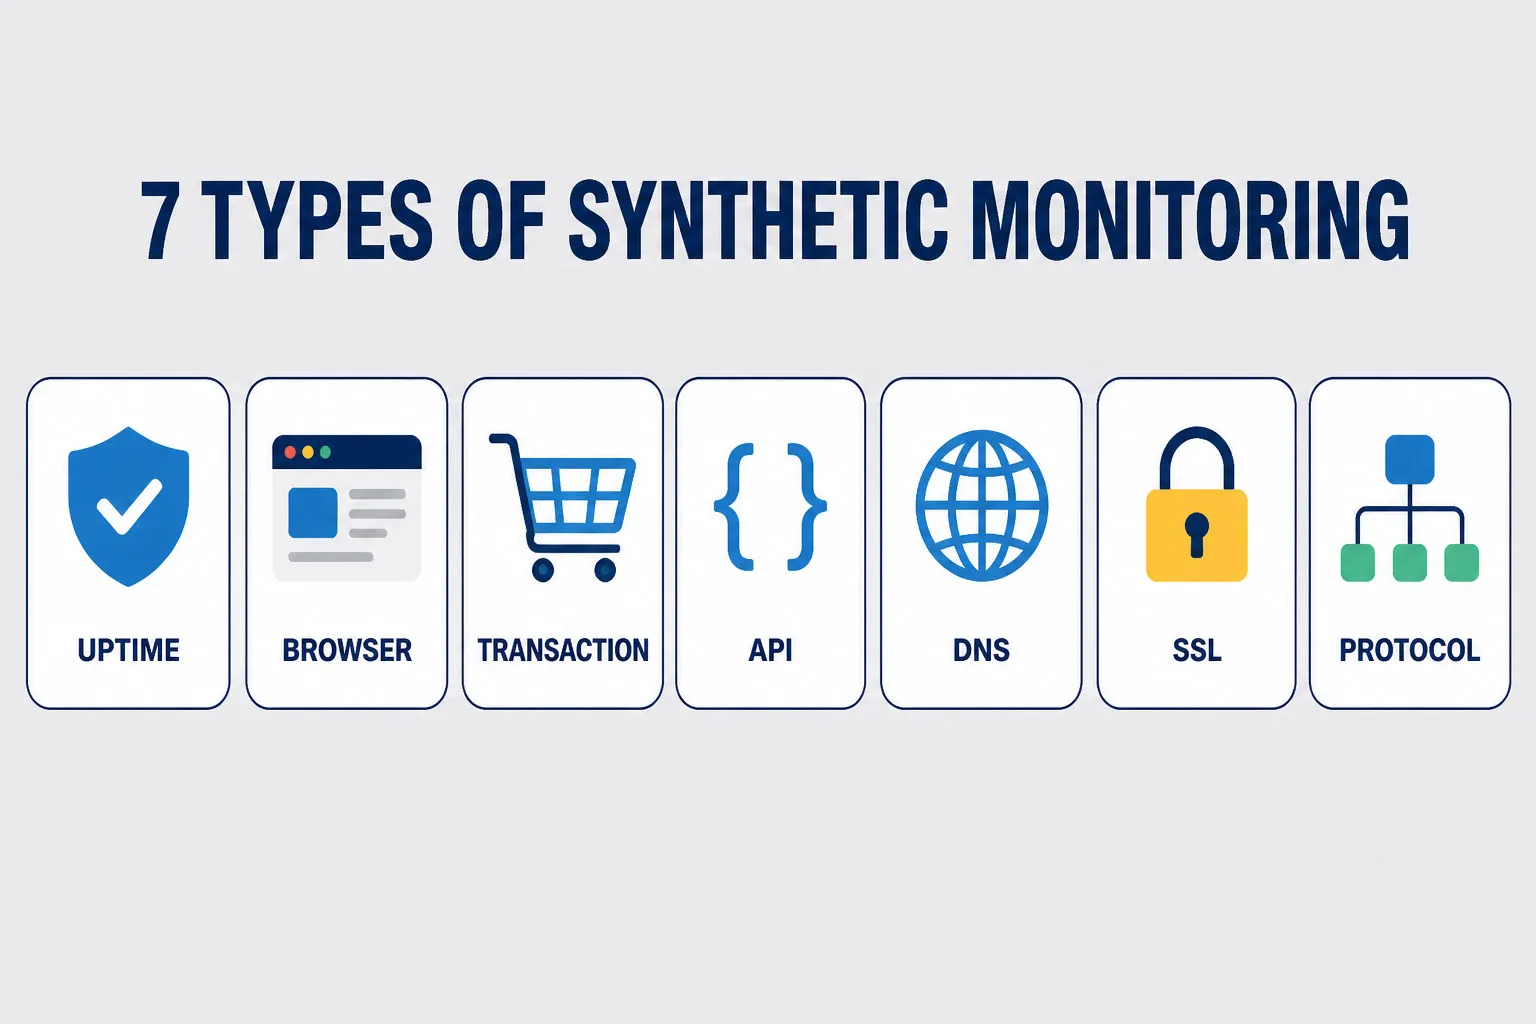
Synthetic monitoring isn’t one-size-fits-all. Different test types serve different purposes, and mature monitoring strategies combine several of them.
Availability / Uptime Monitoring
Uptime monitoring uses network and endpoint probes to confirm a server or service is reachable and responding. These checks operate at different network layers, each validating something distinct:
- Ping Monitoring (ICMP) — tests basic network reachability to a host when permitted by firewall rules. A passing ping confirms the host is on the network, but does not prove the application is healthy.
- Port Monitoring (TCP) — tests whether a specific port is open and accepting connections. Confirms transport-layer reachability.
- HTTP/HTTPS Uptime Checks — validate an application endpoint at the application layer, checking status codes, response content, and SSL validity. For application uptime, HTTP checks with response and content assertions are the most meaningful layer to monitor.
Dotcom-Monitor offers all three as distinct products — Ping Monitoring, Port Monitoring, and HTTP-based Uptime Monitoring — because a passing ping does not guarantee a healthy application.
Browser / Page Performance Monitoring
A real browser loads a full web page — executing JavaScript, rendering CSS, loading third-party resources — and records granular load timing. Dotcom-Monitor’s web page monitoring runs in real Chrome, Edge, Firefox, and mobile browsers (40+ configurations) rather than just a headless engine, producing authentic performance data that reflects actual user experience. Key metrics include TTFB, FCP, LCP, DOM load time, and total page load time. Waterfall charts and video recordings synced with those charts let you pinpoint exactly which resources are slowest. This matters for SEO: Google’s Core Web Vitals (LCP, CLS, INP) are a ranking factor, and consistently poor scores will impact your search visibility.
Transaction Monitoring
Transaction monitoring simulates a full user journey — a multi-step sequence like searching for a product, adding it to a cart, entering payment details, and completing checkout. Dotcom-Monitor’s EveryStep Web Recorder captures these journeys by recording real browser interactions, which are replayed continuously by monitoring agents. Any broken step — a form that won’t submit, a button displaced by a UI change, a redirect loop introduced by a deploy — is caught immediately. This is the most powerful test type for protecting revenue-critical business flows.
API Monitoring
Tests the health, performance, and correctness of REST and SOAP API endpoints. Validates HTTP methods (GET, POST, PUT, PATCH), checks response status codes, verifies response payloads, and measures latency. Dotcom-Monitor supports REST API monitoring, SOAP API monitoring, Postman Collection monitoring, and Insomnia Collection monitoring — covering the full range of API types teams use in practice. Multistep API tests chain requests together (authenticate → create → fetch → delete) to validate entire workflows. SSL/TLS certificate checks can run alongside API tests to confirm certificates are valid and not approaching expiry.
DNS Monitoring
Verifies that your DNS servers resolve hostnames correctly and within acceptable response times. DNS issues can cause widespread, hard-to-diagnose outages — when DNS fails, users can’t reach your application even if your servers are running perfectly. Dotcom-Monitor’s DNS monitoring validates resolution accuracy, response times, and full DNS propagation chain health across global locations. It also validates DNSSEC chain-of-trust to ensure DNS responses haven’t been tampered with, monitors SOA record consistency, and flags anomalous DNS changes — such as unexpected IP addresses or unauthorized record modifications — that may indicate misrouting or cache poisoning. DNS monitoring supports A, AAAA, MX, NS, CNAME, PTR, and SOA record types.
SSL Certificate Monitoring
Tracks SSL/TLS certificate validity, expiry dates, and revocation status. An expired or misconfigured certificate causes immediate trust warnings in every browser, directly impacting user confidence and conversion rates. Automated SSL monitoring alerts you days or weeks before a certificate expires, giving your team time to renew without an outage.
Protocol and Network Monitoring
Beyond web and API checks, Dotcom-Monitor monitors the full stack of network protocols: email (SMTP, POP3, IMAP), VoIP and SIP, FTP, UDP, WebSocket, and traceroute path analysis. Ping monitoring (ICMP) and port scanning round out network-layer visibility. These tests are particularly valuable for organizations running complex infrastructure where application health depends on multiple underlying services.
3 Key Synthetic Monitoring Metrics to Track
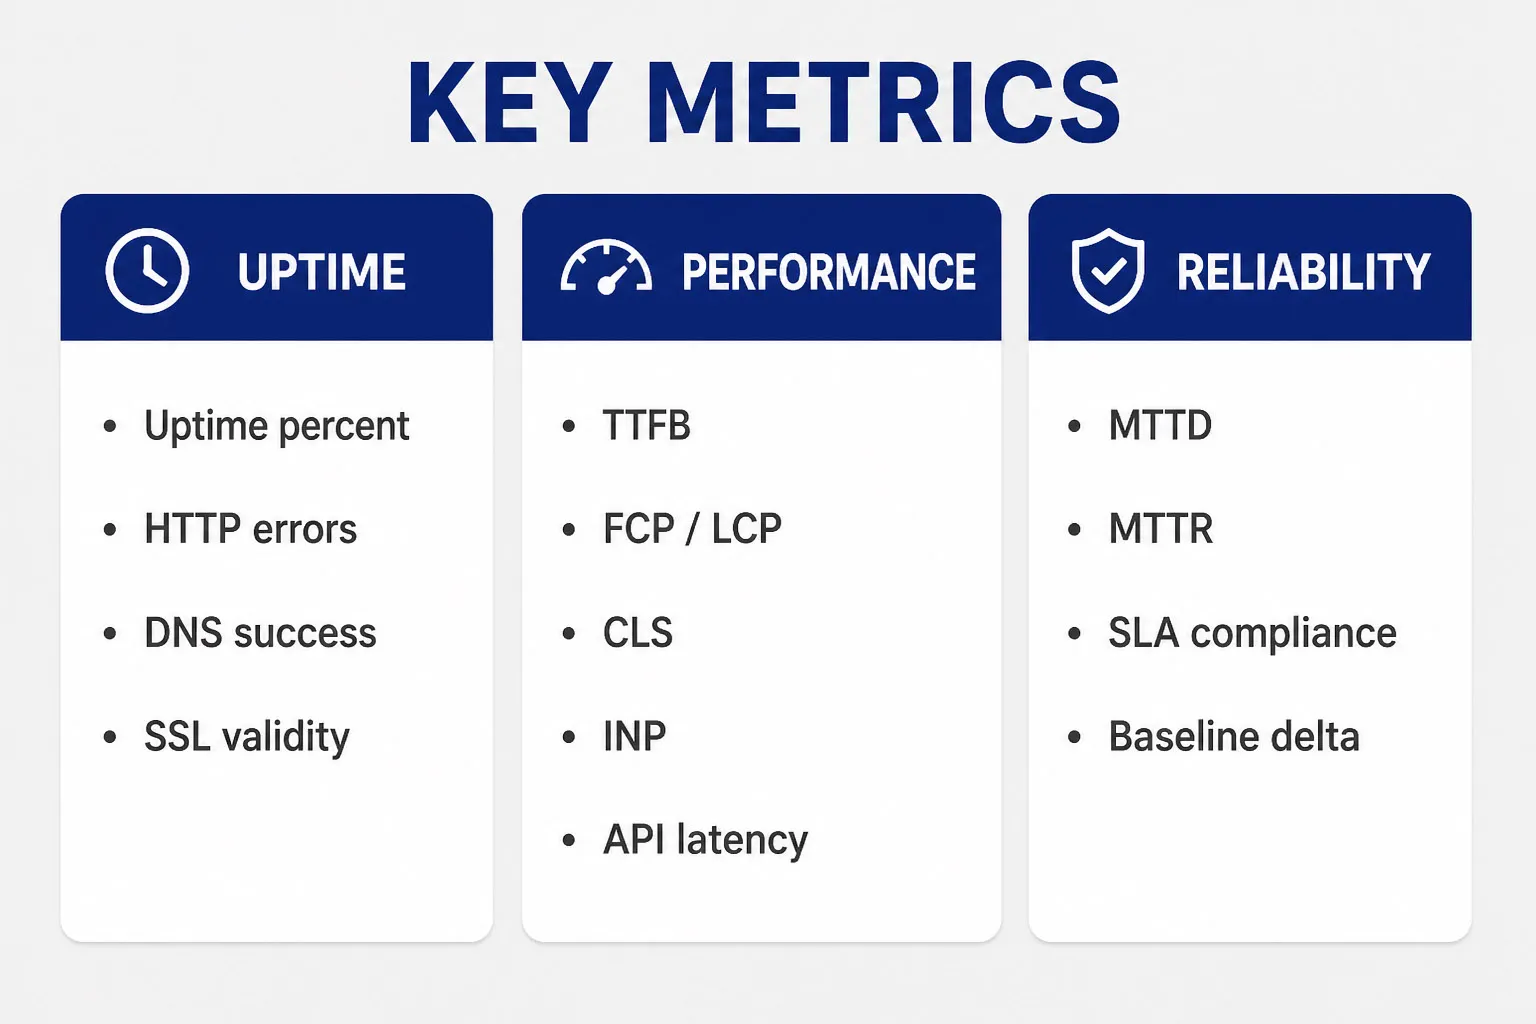
What you measure determines what you can improve. The most operationally important synthetic monitoring metrics fall into three categories:
Availability Metrics
- Uptime percentage (target: 99.9% or better per SLA)
- Error rate by endpoint and geographic region
- HTTP status codes (4xx client errors, 5xx server errors)
- DNS resolution success rate and response time
- SSL/TLS certificate validity and days until expiry
Performance Metrics
- Time to First Byte (TTFB) — server responsiveness
- First Contentful Paint (FCP) and Largest Contentful Paint (LCP) — Core Web Vitals
- Cumulative Layout Shift (CLS) — visual stability
- Interaction to Next Paint (INP) — responsiveness Core Web Vital (lab measurements approximate field values)
- Total page load time and DOM load time
- API response time (p50, p95, p99 latency)
- Transaction step timing — which step in the multi-step journey is slowest
Reliability & SLA Metrics
- Mean Time to Detection (MTTD) — how fast issues are caught within the probe interval
- Mean Time to Resolution (MTTR) — how fast they are fixed
- SLA/SLO compliance percentage over rolling time windows
- Performance baseline delta — change in response time vs historical average
Synthetic Monitoring vs. Real User Monitoring vs. APM

These three monitoring approaches serve distinct purposes and are often confused. Here’s how they differ:
| Dimension | Synthetic Monitoring | Real User Monitoring (RUM) | APM |
|---|---|---|---|
| Data source | Scripted simulations from agents | Actual user sessions (JS snippet) | Backend instrumentation (traces, logs) |
| When data is collected | 24/7, on a defined probe schedule | Only when real users are active | During real application execution |
| Type | Active / proactive | Passive / reactive | Internal / code-level |
| Best for | Uptime, regression detection, SLA validation | Real UX, geographic performance, session analysis | Root cause analysis, code-level bottlenecks |
| Works pre-launch? | Yes | No | Yes (in staging) |
| Works in low-traffic windows? | Yes | Limited | Yes, but fewer requests = fewer samples |
| Covers third-party services? | Yes (API and DNS tests) | Partially | Depends on instrumentation |
| Catches unknown user paths? | No (scripted only) | Yes | Partially |
The key insight: synthetic monitoring and RUM are complementary, not competing. Synthetic monitoring gives you consistent, proactive baseline measurements. RUM tells you what’s happening for diverse real users across every device, browser, and network condition. Using both together gives you the most complete picture of digital experience.
APM sits at a different layer, providing code-level traces and server-side performance data. Together, all three form comprehensive monitoring coverage across user experience and backend performance. For a full observability practice, teams typically combine APM with logs, metrics, and distributed traces to support root-cause investigation.
Why Teams Use Synthetic Monitoring: 8 Key Benefits
- Catch issues before users do.Synthetic tests run continuously, even during off-hours. You’ll know about a broken checkout flow at 2 a.m. before your customers wake up to find it.
- Establish performance baselines.By running the same tests repeatedly over time, you build a reliable baseline of expected performance. Deviations beyond defined thresholds — confirmed across locations or consecutive intervals — can trigger alerts, filtering out transient network noise.
- Validate new deployments quickly.Run synthetic tests against your staging environment before going live to confirm nothing broke, then continue monitoring immediately post-deployment to validate production behavior — catching regressions before they affect real users.
- Protect SLAs and SLOs.Synthetic monitoring produces continuous, objective performance data you need to prove SLA compliance to customers and quickly identify when a third-party vendor is failing to meet agreed standards.
- Hold third-party vendors accountable.Modern applications depend on CDNs, payment processors, analytics platforms, and SaaS APIs. Synthetic tests can monitor each of these independently, giving you evidence when a vendor’s degradation is impacting your users.
- Reduce MTTR.Because synthetic checks capture consistent steps, timings, and artifacts — including video recordings synced with waterfall charts in Dotcom-Monitor — they often make issues easier to reproduce and triage. Intermittent or state-dependent failures may still require deeper server-side investigation, but having the exact step sequence and timing significantly narrows the search.
- Monitor pre-launch and low-traffic areas.Launching in a new geography? Building a new feature not yet in production? Synthetic monitoring can test those areas before any real user ever visits them.
- Support capacity planning.Historical synthetic monitoring data reveals trends: is your API getting slower as your user base grows? Are peak-traffic periods causing degradation? This data feeds directly into capacity and infrastructure planning decisions.
Synthetic Monitoring Use Cases by Team and Industry
By Team
- SRE and platform teams: Own uptime SLOs. Use synthetic monitoring to track SLO burn rates, set error budgets, and get alerted on violations before they breach SLA thresholds.
- DevOps and application engineering: Run synthetic checks against staging environments as part of release validation. Monitor post-deployment to catch regressions quickly and reduce rollback decision time.
- API and backend teams: Monitor REST and SOAP API endpoint availability, latency, and correctness. Run multistep API tests that chain authentication, CRUD operations, and validation in sequence.
- Ecommerce and digital experience teams: Protect checkout flows, product search, and account login. Monitor Core Web Vitals to protect both user experience and SEO rankings. Studies in ecommerce have shown measurable conversion impacts from load time delays — though the specific threshold varies by industry, user expectations, and baseline performance.
By Industry
- Financial services: Monitor online banking platforms, payment gateways, and trading systems for availability and sub-second response times. Validate SSL/TLS configuration continuously.
- Healthcare technology: Ensure EHR systems, patient portals, and telehealth platforms are accessible and performant — particularly critical during high-demand periods.
- Ecommerce and retail: Monitor inventory APIs, cart functionality, and checkout flows for continuous availability.
- Media and streaming: Validate CDN performance, API endpoints for recommendation engines, and streaming service availability.
- Public sector: Monitor citizen-facing portals and services that must maintain availability commitments defined in public SLAs.
7 Challenges and Limitations of Synthetic Monitoring
Synthetic monitoring is a powerful tool, but it has real limitations every team should understand.
- Scripted coverage gaps: Synthetic tests only cover the user journeys you’ve scripted. The combination of different user paths, device configurations, network conditions, application states, and edge cases creates a combinatorial space that’s impractical to script comprehensively. Real User Monitoring fills this gap by capturing what actual users encounter.
- Test fragility: Browser-based transaction scripts are sensitive to UI changes. When a button text changes, a form field is renamed, or a page is restructured, tests can break — even if the application itself is working fine. This generates alert noise and requires ongoing maintenance.
- Maintenance overhead: As your application evolves, your test scripts must evolve too. For large applications with frequent releases, keeping scripts current is a real operational cost.
- No subjective UX signal: Synthetic monitoring measures objective metrics: response times, error rates, availability. It cannot capture user satisfaction, visual design issues, accessibility problems, or the subjective feel of a confusing interface.
- Simulated conditions differ from reality: Synthetic agents run from controlled environments. They may not replicate the diversity of real user devices, mobile networks with variable bandwidth, corporate proxies, or regional ISP routing.
- Backend blindspot: Synthetic monitoring is an outside-in view. It tells you the application is slow, but not why at the code level. APM and distributed tracing are needed for code-level root cause analysis.
- Cost at scale: Running frequent tests from many global locations with complex transaction scripts can become expensive, especially as agent count, test frequency, and data retention requirements grow.
9 Synthetic Monitoring Best Practices
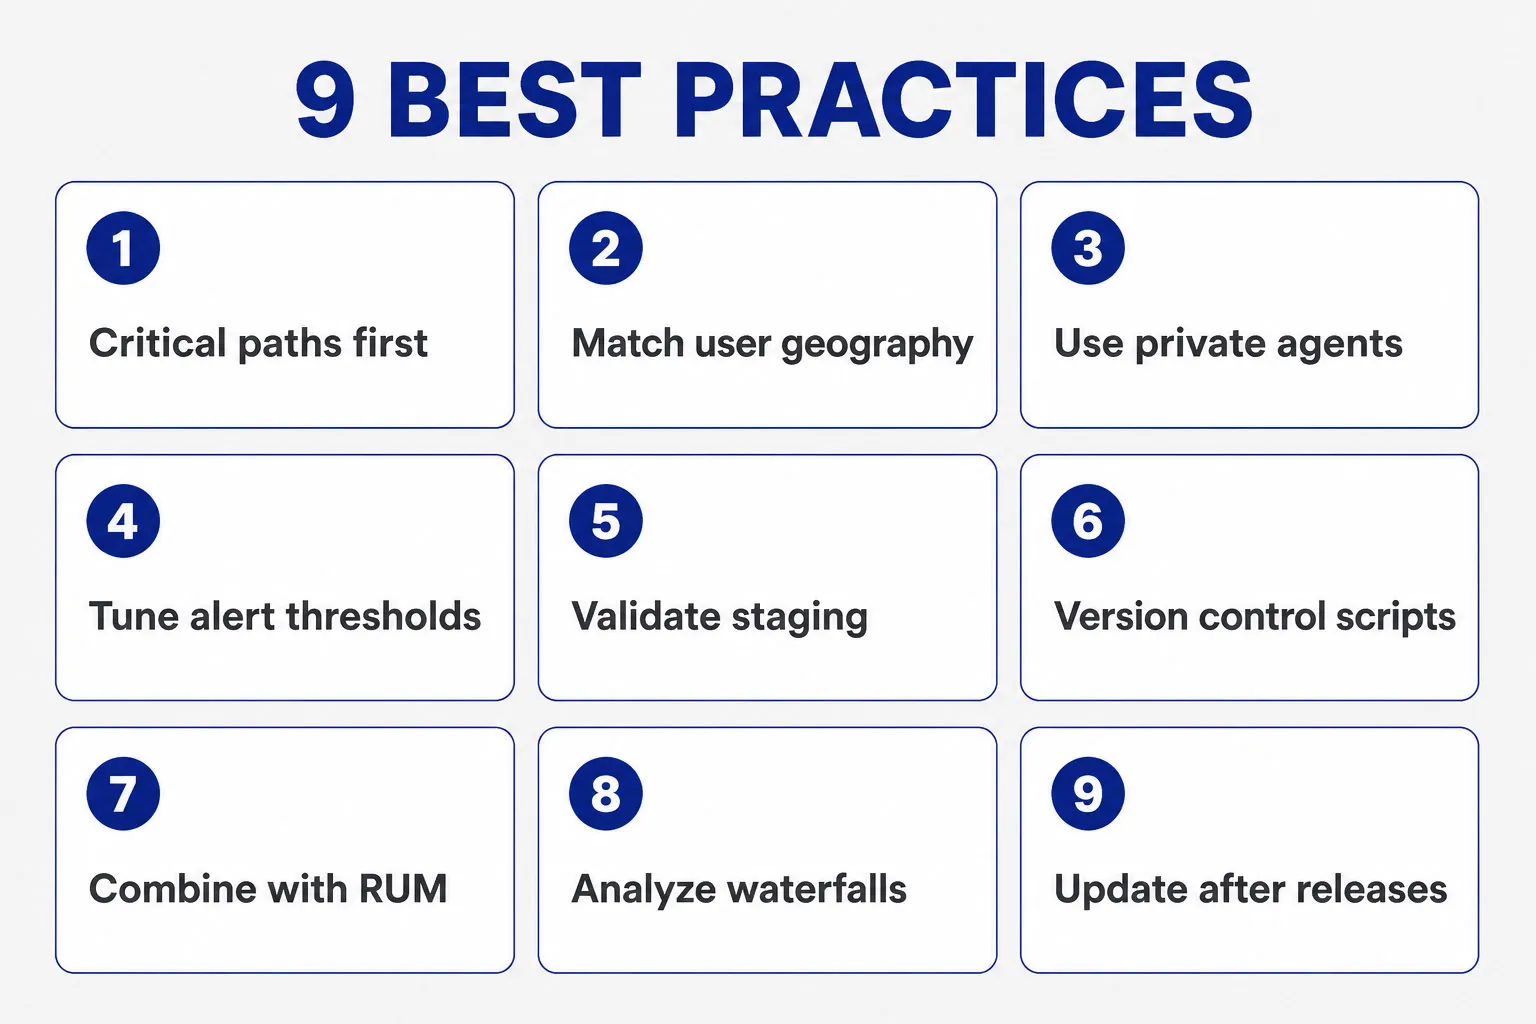
- Start with your critical paths. Don’t try to test everything at once. Begin with the 3–5 user journeys that directly drive revenue or are covered by SLAs: login, checkout, core API, and your most-visited landing pages.
- Monitor from where your users are. Run tests from the geographic regions where real users are located. A test passing from a US-East node tells you nothing about performance in Southeast Asia or Western Europe. Dotcom-Monitor’s 30+ global locations let you match agent placement to your user geography.
- Use private agents for internal environments. For services behind a firewall — internal APIs, intranet apps, staging environments — deploy a private agent inside your network. Remember: a private agent passing a test confirms that specific service is working from that vantage point, not that your entire internal environment is healthy.
- Set meaningful alerting thresholds. Configure alert conditions based on your established performance baseline — for example, alert when response time exceeds 1.5–2x the baseline average, or when availability drops below your SLO threshold. Dotcom-Monitor supports configurable filters so you can tune sensitivity per check rather than alerting on every fluctuation.
- Validate staging before going live. Run Dotcom-Monitor checks against your staging environment before each release to catch regressions early. After deployment, monitor production immediately for the first 30–60 minutes — the period when most deploy-related issues surface. Use Dotcom-Monitor’s alerting integrations (Slack, PagerDuty) to route post-deploy alerts directly to your on-call team.
- Keep test scripts in version control. Treat monitoring scripts as code. Store them in Git, review changes in pull requests, and roll back when a script update causes false alarms.
- Combine with RUM for full coverage. Use synthetic monitoring for proactive detection and baseline measurement. Layer RUM on top to capture the real-world experience of actual users across diverse conditions. The two together provide comprehensive monitoring coverage of your digital experience.
- Analyze waterfall charts regularly. Don’t just look at total load time. Review waterfall charts to see which individual resources — third-party scripts, large images, slow API calls — are contributing most to load time. Dotcom-Monitor’s video capture synced with waterfall charts makes this diagnosis significantly faster.
- Review and update scripts after major releases. After any significant UI change or API refactor, audit your synthetic test scripts to ensure they still reflect accurate user journeys and haven’t been invalidated by the release.
How to Analyze Synthetic Monitoring Data?
Collecting synthetic monitoring data is only valuable if you act on it. Here’s a practical workflow for turning raw test results into performance improvements:
- Review availability and error rate dashboards daily. Look for patterns: are errors concentrated in a specific region, a specific endpoint, or a specific time of day?
- Track performance trends over time, not just point-in-time snapshots. A page that takes 2.1 seconds today but took 1.6 seconds three weeks ago has a regression — even if it hasn’t breached your alert threshold yet.
- Use waterfall charts and video to pinpoint bottlenecks. Identify the slowest resources on each page. Dotcom-Monitor’s video recordings synced with waterfall charts show exactly what the browser experienced during a failure — no guessing.
- Correlate synthetic failures with deployment events. When a test starts failing, check your deployment log. A release shortly before the failure is a strong signal worth investigating first.
- Conduct root cause analysis (RCA) on recurring failures. Don’t just resolve alerts — document them. Recurring failure patterns in specific regions or at specific times often indicate systemic infrastructure issues worth addressing proactively.
- Report on SLA/SLO compliance regularly. Use historical synthetic monitoring data to generate uptime reports for stakeholders and customers. Objective, timestamped data builds trust and is essential when disputes arise with third-party vendors.
What to Look for in a Synthetic Monitoring Tool?
Not all synthetic monitoring platforms are created equal. When evaluating a solution, look for these capabilities:
- Global monitoring network — 30+ locations so you can test from where your users actually are
- Private agent support — deploy agents inside your own network for intranet and staging monitoring
- Broad test type coverage — uptime, browser, transaction, API (REST, SOAP, Postman, Insomnia), DNS, SSL, and protocol checks in a single platform
- Real browser testing — monitoring that runs in actual Chrome, Edge, Firefox, and mobile browsers, not just headless engines
- Visual debugging tools — waterfall charts, video recordings synced to monitoring runs, and filmstrip screenshots for fast diagnosis
- Flexible script recording — tools like EveryStep Web Recorder that capture real user interactions without requiring hand-coded automation scripts
- Performance metrics depth — TTFB, FCP, LCP, CLS, INP, and full navigation timing breakdown
- Alerting integrations — PagerDuty, Slack, Teams, email, SMS, WhatsApp, and webhook support for your on-call workflow
- On-demand triggered checks — ability to run checks via API so you can trigger monitoring as part of release workflows
- SLA/SLO dashboards — built-in reporting on uptime and performance commitments with shareable dashboards
- Transparent pricing — predictable cost model that scales with your needs
Start Synthetic Monitoring with Dotcom-Monitor
Dotcom-Monitor provides enterprise-grade synthetic monitoring from a global network of 30+ monitoring locations, supporting uptime checks, real-browser page tests, transaction monitoring via EveryStep Web Recorder, API monitoring (REST, SOAP, Postman, Insomnia), DNS monitoring with DNSSEC validation, SSL certificate monitoring, and a full suite of protocol checks — all in a single platform.
Whether you’re protecting an ecommerce checkout flow, monitoring a public-facing API, validating SLA compliance for enterprise customers, or keeping internal applications running for your team, Dotcom-Monitor gives you the proactive visibility to detect and resolve issues before they impact real users.
