Dotcom-Monitor's Online Reporting features offer powerful tools to track and analyze website and server performance. With real-time data visualization, including Waterfall Charts and Visual Traceroute, customers can monitor uptime, response times, and other critical metrics. Customizable reporting options allow for the generation of detailed performance reports, which can be easily shared or downloaded for further analysis.
Online Analytics
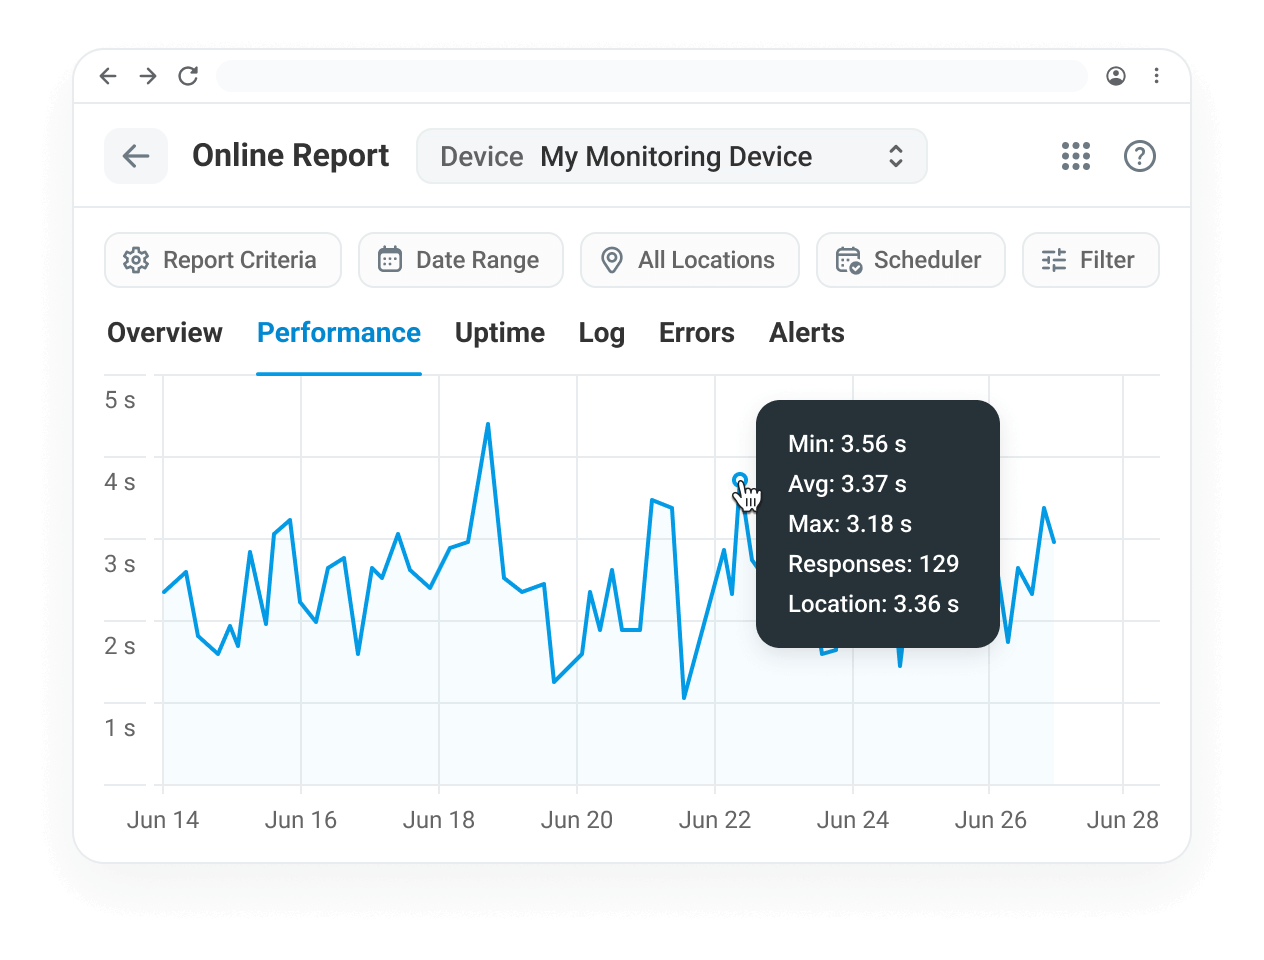
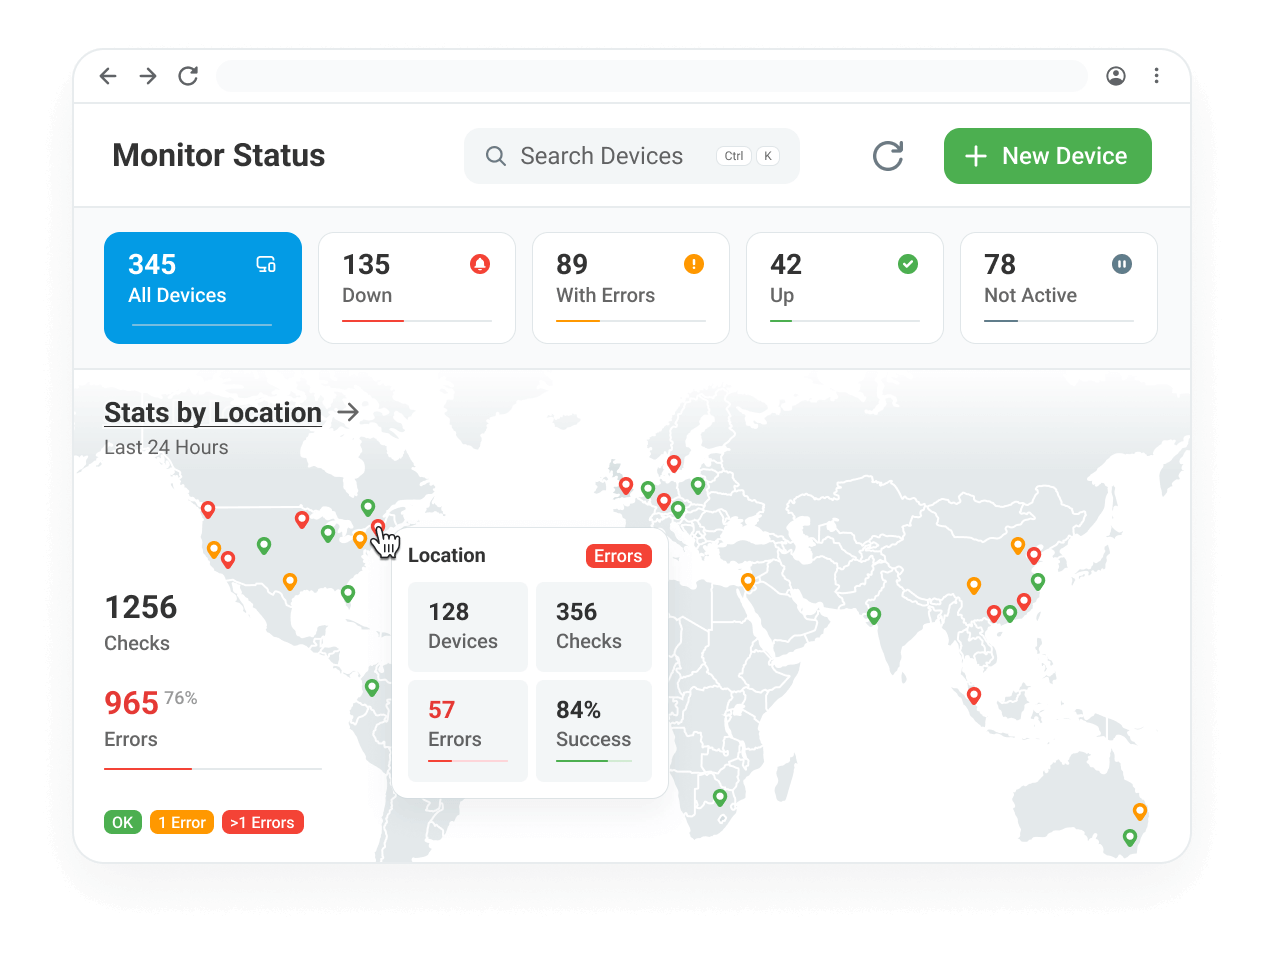
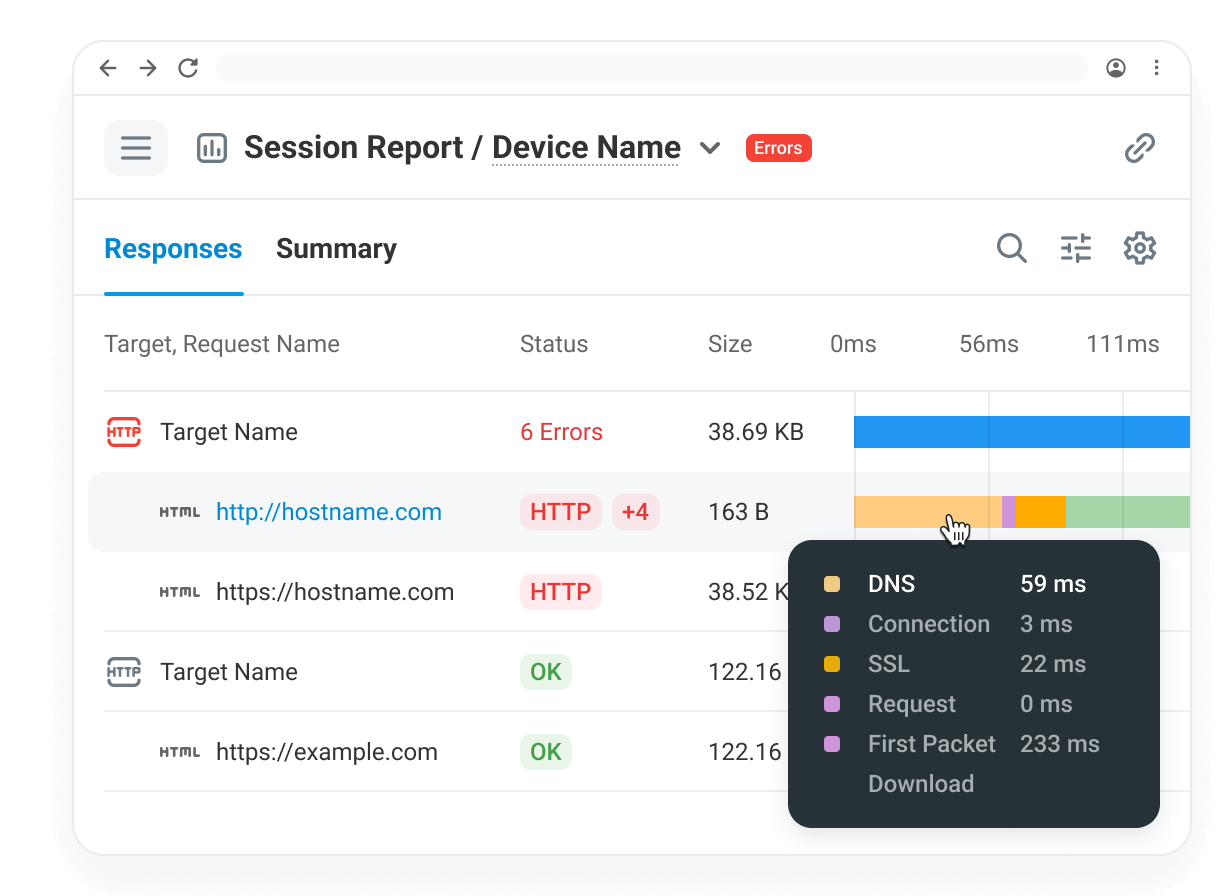
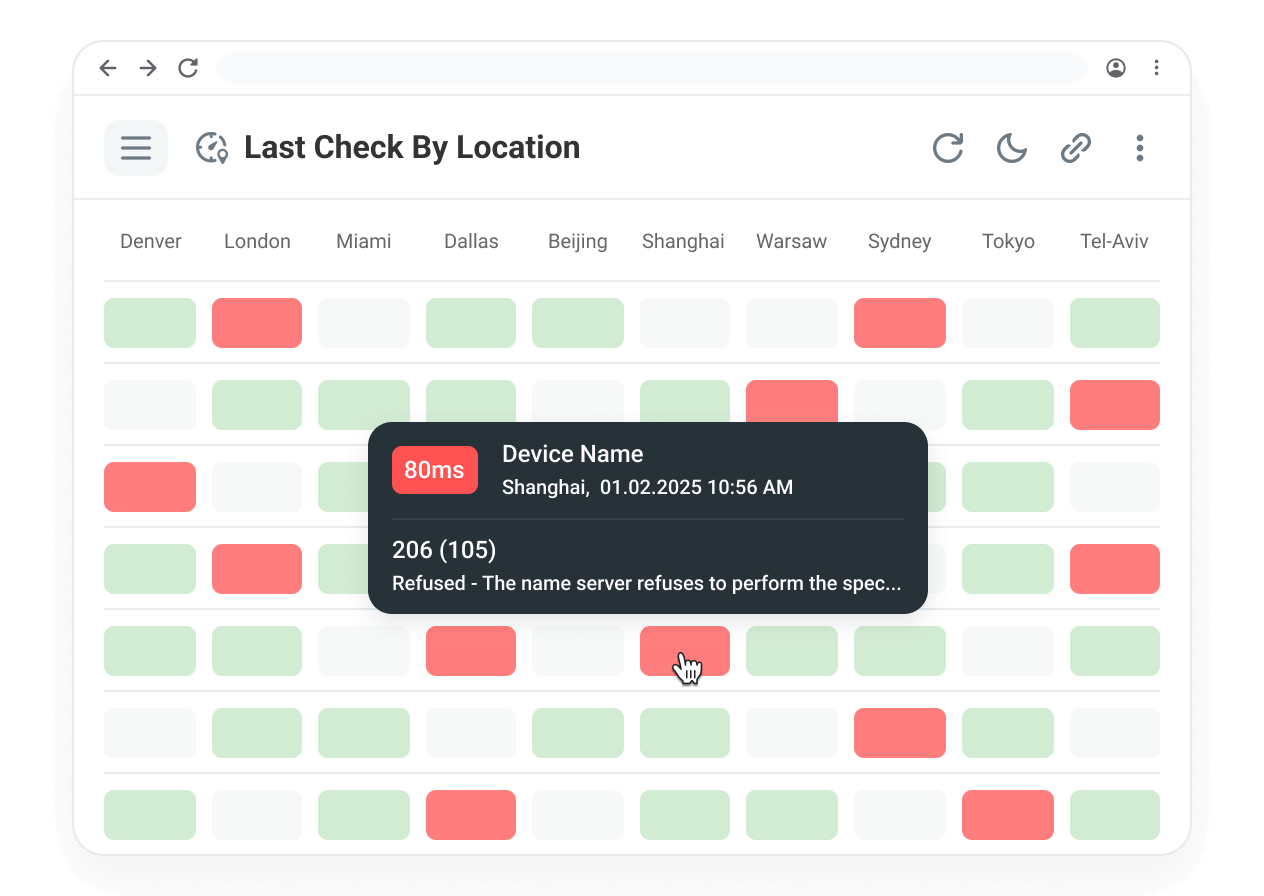
Key features such as performance charts displaying response times, uptime statistics, and error analysis, all organized across different monitoring locations. Allows to drill down into detailed session logs, filter by specific parameters like location and error type, and view recorded session videos. The tool also supports generating performance reports with Waterfall charts, tracing errors with visual traceroute, and reviewing failures in the logs. This helps users effectively track and troubleshoot their web services in real-time.
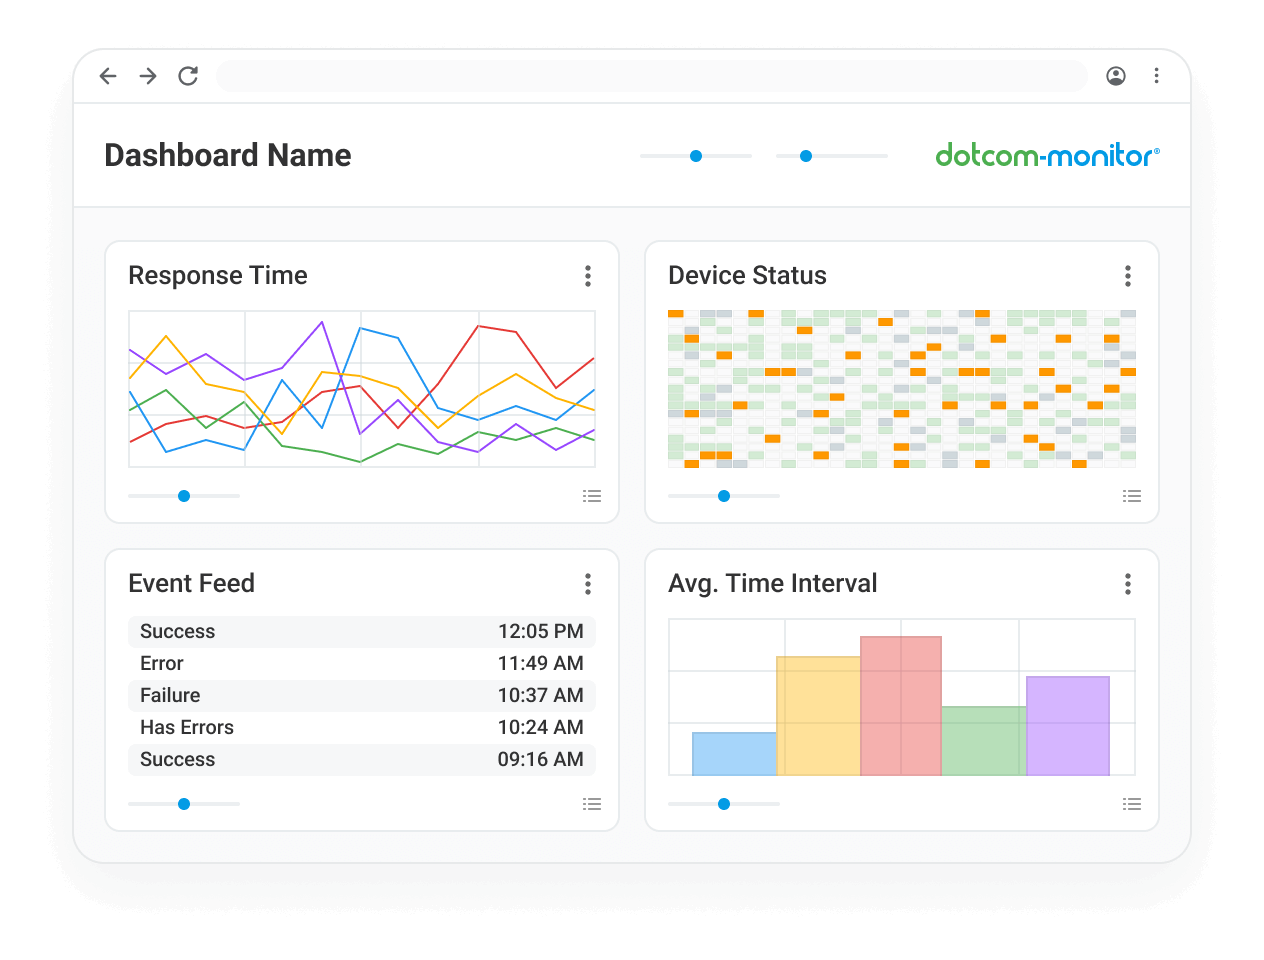
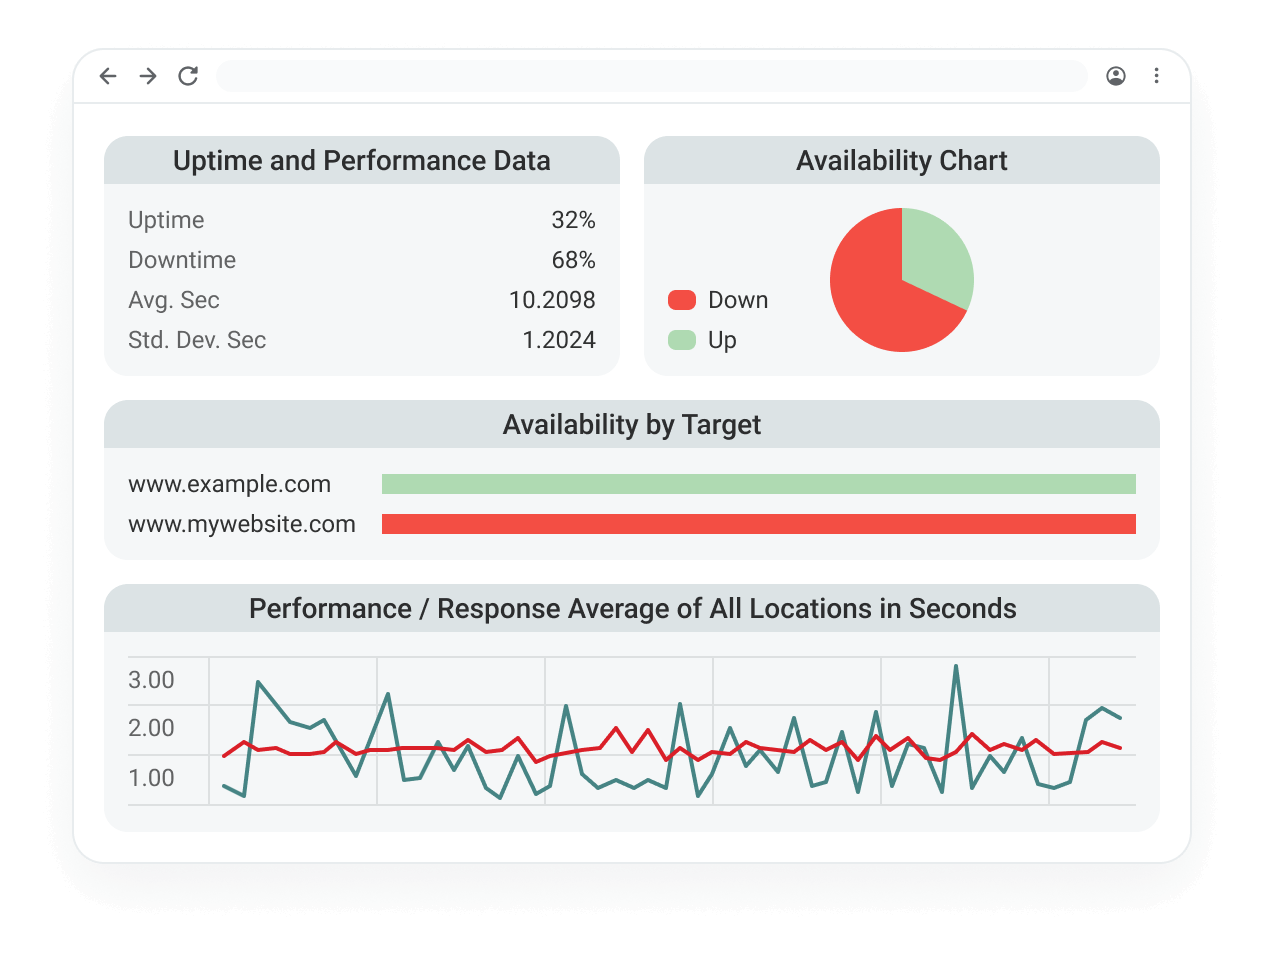
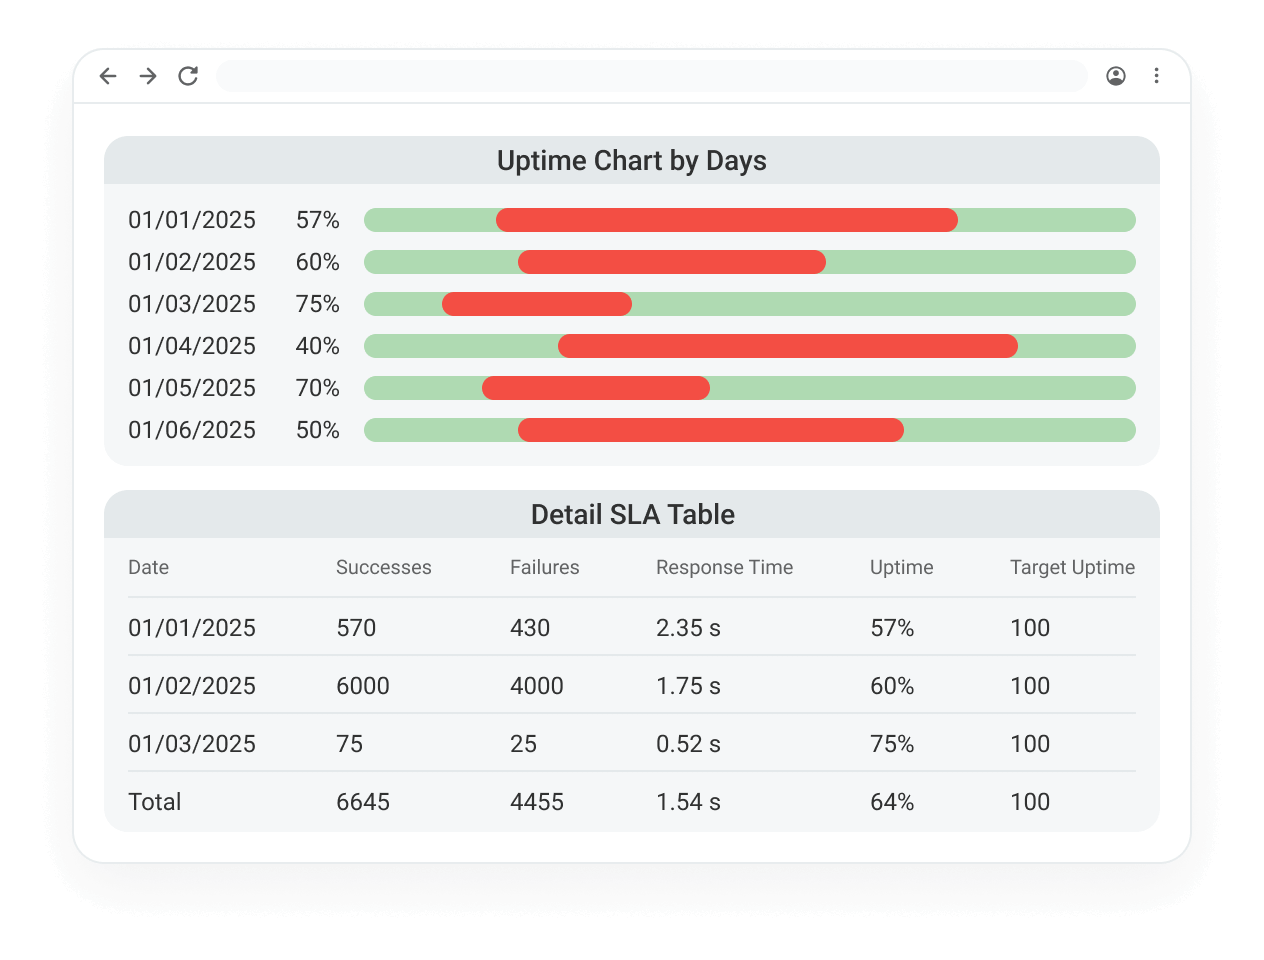
Create customizable, real-time dashboards that provide a comprehensive view of their monitoring data. These dashboards can be easily shared with team members or external stakeholders, offering insights into website and server performance at a glance. Users can add various panels to their dashboards to track uptime, response times, and other key metrics. This flexibility ensures that teams have the information they need, whenever they need it, with the ability to configure and share dashboards tailored to specific monitoring needs and preferences.
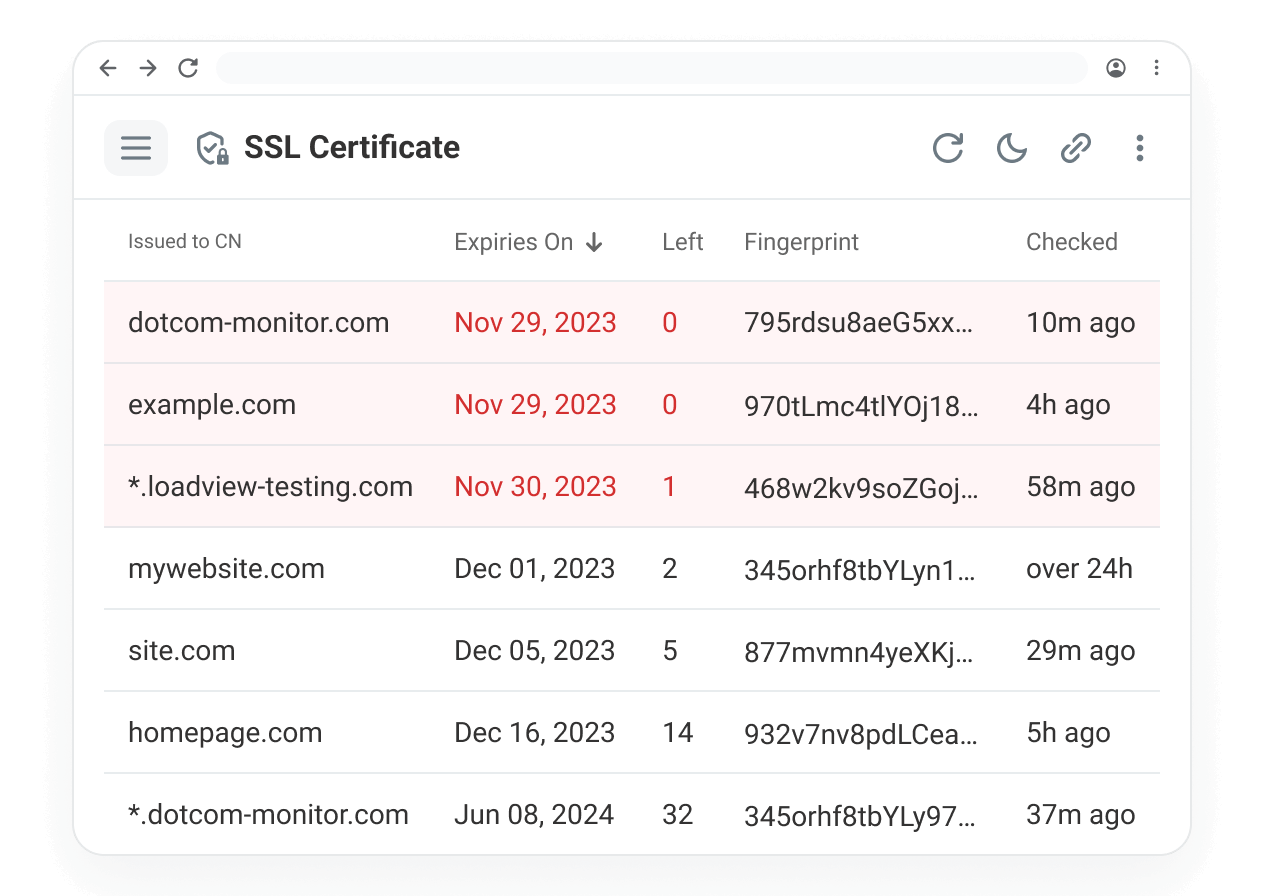
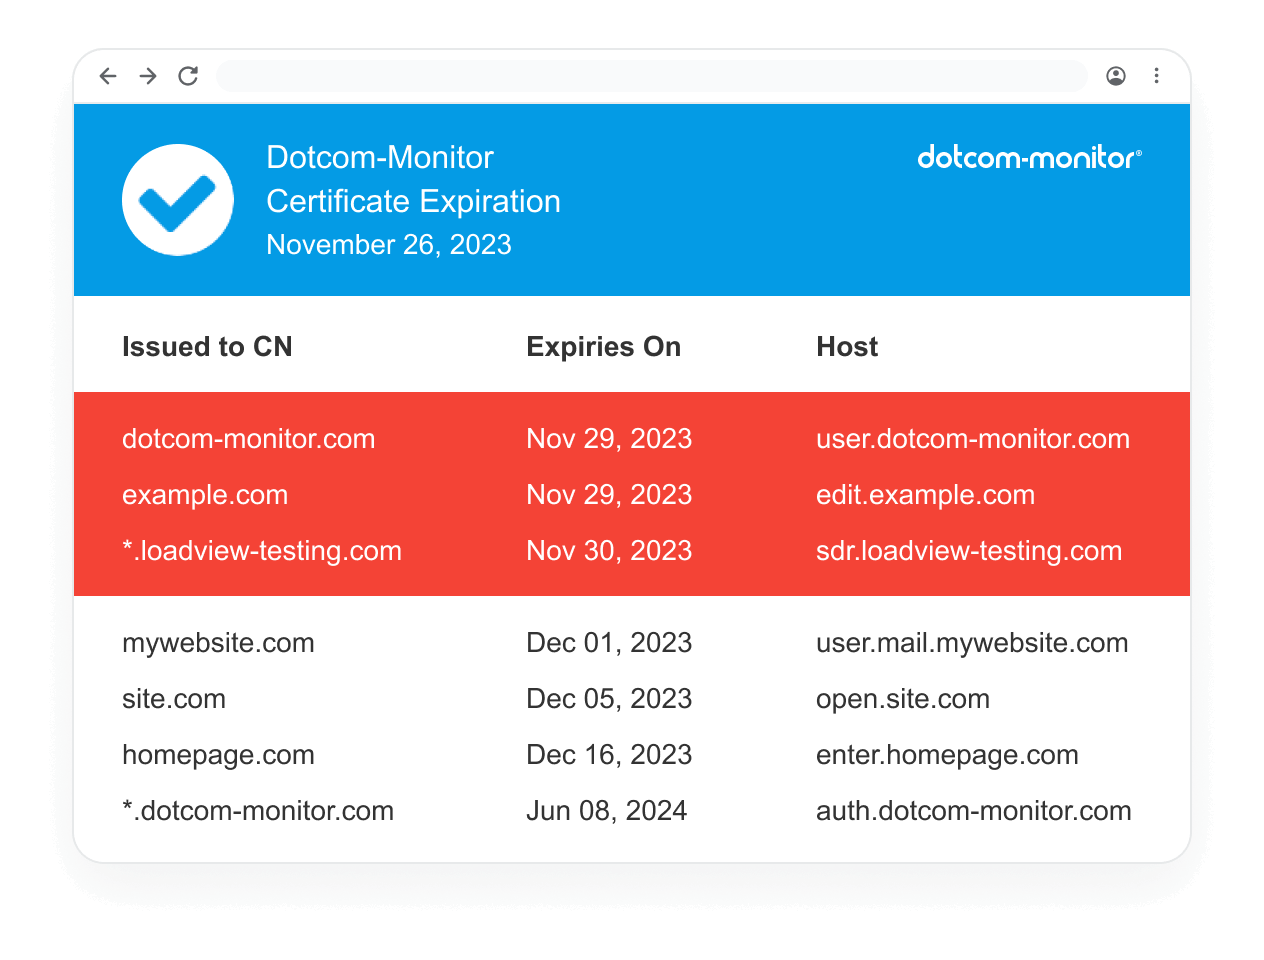
Dotcom-Monitor offers a range of customizable email reports to track website and server performance. These reports, available in formats like TXT, CSV, and PDF, can be scheduled daily, weekly, or monthly. Report types include summaries of overall performance, individual device status, task-specific metrics, and SSL certificate checks. Users can filter data to focus on specific errors, locations, or tasks, and apply schedules to exclude certain time periods. The reports are designed to keep teams informed and help proactively manage system health and performance.