Dotcom-Monitor has the ability to playback a video recording of a website, or web application monitoring session.
The video record is synced with an interactive waterfall chart displaying details of the web pages’ code performance. It’s the fastest way available to diagnose web application errors minimizing downtime. You don’t have to guess about what to fix, or what website users are experiencing. The web operations team can simultaneously see the network data and a video of the user’s experience, so diagnosing the problem that users experience is faster.
A video file is created in these situations:
1. When a Device is first created a video is recorded by each selected monitoring Agent location (aka “Agents”) during the Agents first session of monitoring.
2. A video is recorded when a Device changes State i.e. a video is recorded when a Device’s State changes from “Success” to “Fail”.
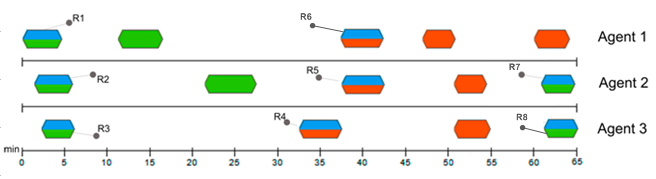
Example:
Figure 1 (below) shows three Agents monitoring a Device at a 5-minute interval. The first three video attachments are recorded when monitoring begins (R1, R2, and R3 monitoring session responses), resulting in three attached video files.
When a state change to Fail occurs, three additional video files are generated (R4, R5, and R6 — the “error” monitoring session responses). The next videos will be attached during the R7 and R8 monitoring sessions, triggered by the next status change.
Figure 1.