On the Test Report page under the Sessions tab you can review test session details like start time, session duration, execution status, the ID of a virtual user that started the session and the geo location the session was started from.
Filtering
By Execution Status
Load test sessions can be filtered by execution status:
- Succeeded – select to show only sessions with successfully executed test requests.
- Failed – select to show only sessions with errors occurred while test request executions.
In some cases, you may not find any sessions under the Sessions tab while your test is successfully completed. Or you may see fewer sessions than you expected. If that occurs, select the Include Uncompleted option to display sessions with the Uncompleted status. By default, we do not include statistics on uncompleted sessions into the error statistics and session log. If the option is activated, sessions that were automatically stopped by LoadView will be displayed in the log. To find more details on why a test session can be aborted and how to address this problem, see the Uncompleted Sessions article of our Knowledge Base.
By Time Period
To filter sessions based on their start and end time, specify the time interval that you want to analyze. It will filter sessions that finished earlier than the beginning of the interval and started later than the end of the interval. The report will show only sessions that were running during the specified interval. By default, we use the start and end time of the test to show all the test sessions.
By Geo Location
To filter sessions started on a specific LI or at a specific geo region, use the following filters:
- Zone – Select to filter by geographical location from which the sessions were started.
- Agent ID – Select to filter by LIs the sessions were started from.
- User ID – Select to filter by a particular virtual user ID.
To display or edit Zone, Agent, or User ID filters (if configured), click View next to the filter field.
Sharing and Interpreting CSV Session Reports
To send a CSV session report to any specified email address, click Export Sessions in the top-right corner of the session report page and enter the desired recipient email (it does not need to belong to your account member). An email with a CSV report will be sent to the provided email address.
The table below contains descriptions of the common data fields included in a CSV report. Some CSV exports may include additional columns depending on the configuration (for example, custom metrics or validations).
| Column | Description |
|---|---|
| Zone | The geographic checkpoint zone or load injector region executing the test (e.g., Amazon/us-east-1). |
| AgentID | Internal numeric ID of the load injector performing the check. |
| AgentIP | IP address of the load injector that executed this session. |
| UUID | Unique identifier for the overall load test session (links all related steps). |
| UserID | Internal identifier of the virtual user that initiated the session. When a CSV file with username–login pairs is used, this ID corresponds to the row number in the uploaded CSV file. |
| CycleNo | The number of the test cycle executed by the virtual user with the corresponding UserID (indicates repetition index). |
| Level | Hierarchy level of the step in the session tree (e.g., root vs. child steps). A parent step duration includes the time of its children.
While level numbering may vary depending on the request type (browser vs. HTTP(S)), the hierarchical parent–child structure remains consistent:
|
| ID | Unique step ID within the session (unique within this UUID). |
| ParentID | The ID of the parent step (used to reconstruct step ordering/hierarchy). |
| Name | A human-readable name for the step (e.g., “Step 1: Home…” or navigation description). |
| URL | The URL requested for this step. |
| StartTime | Timestamp when the step/request started. |
| Duration | Total elapsed time (in milliseconds) from the moment the step started until completion of download. |
| DnsTime | Time spent performing DNS resolution for this request (in ms). |
| SSLTime | Time spent in SSL/TLS negotiation (in ms). |
| ConnectionTime | Time spent establishing the TCP connection (in ms). |
| RequestTime | Time spent sending the request until the first byte from the server begins returning (in ms). |
| FirstPacketTime | Time at which the first byte of response was received (may overlap with RequestTime metrics). |
| DownloadTime | Time spent downloading the response body (in ms). |
| Status | Result status of the step (S = Success, F = Failure). |
| UncompletedSession | Flag indicating if the session was incomplete (e.g., session termination or script exit). |
| Errors | Error code or description if the step failed; blank if none (e.g., HTTP error or network error). |
Viewing Session Details
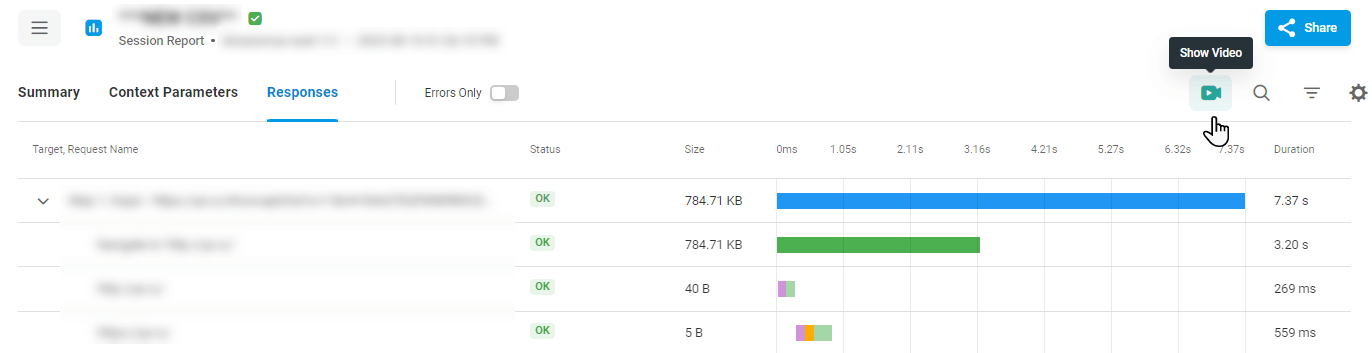
To view a session summary and responses, click the session record in the list.
To show only responses with errors, on the session report page, click the Errors Only toggle.
To view a description of an error in the sessions list, point to the Error code in the corresponding column. You can also find an HTTP(S) task body under the Body link in the failed session description.
The most common reasons that could lead to errors in a test are the following:
- Errors in the test configuration. In the case of a web application test, check the device configuration.
- CPU overload on LI servers. Check the CPU usage chart on the Summary tab.
- Client-side errors, such as hardware/software infrastructure and application issues.
See also: Error Codes
Viewing Session Video
By default, LoadView records video of web page and web application transactions. Capturing a video of test sessions allows you to understand how the page or application appears and performs for a real user. The video can then be used for troubleshooting purposes.
To view the video from a specific location, click the corresponding session record to view the session report. On the session report page, click the video button on the report toolbar.