
This article explains how to monitor Windows service status using a PowerShell script and MetricsView. The configuration collects service status data, sends custom metrics to Dotcom-Monitor, and triggers alerts when a monitored service stops running or changes state.
Use this approach to monitor Windows services, custom applications, and background processes running on Windows servers.
Prerequisites
Before configuring monitoring, ensure you have:
- Access to your Dotcom-Monitor account.
- A configured MetricsView Custom Collector.
- Administrative access to the target Windows server.
Step-by-Step Guide
Step 1: Create a MetricsView Custom Collector
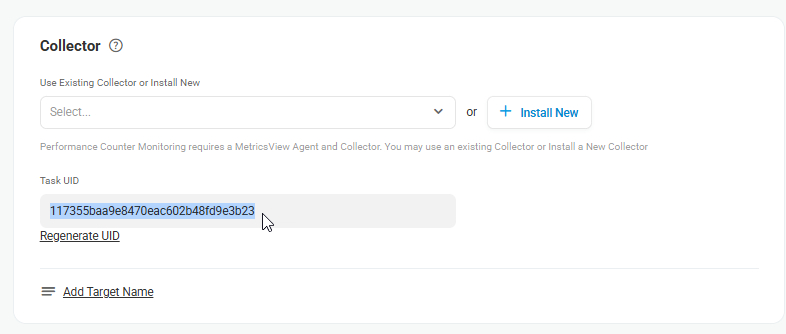
- Navigate to Manage > MetricsView Collectors.
- Click New Collector.
- Configure the collector:
- Enter a descriptive name.
- Set Collector Type to Custom Collector.
- Copy the Collector ID.
- Save the collector.
You will use the Collector ID later in the monitoring script.
Step 2: Create a Custom Metrics Device
- Create a new Custom Metrics monitoring device.
- Select the collector created in the previous step.
- Configure the task settings:
- Specify the Custom Counter Path.
- In the Error Thresholds section, set the Aggregate Type to Minimum (recommended) or Maximum.
- Configure alert thresholds as based on your monitoring needs. See the Configure Alert Threshold section of this step for the recommendations.
- Leave other fields at their default values unless customization is required.
Configure Alert Thresholds
Windows services can return one of seven states. The script converts each state into a numeric value by default:
- Service is stopped – default 1000
- Service is starting – default 2000
- Service is stopping – default 3000
- Service is running – default 4000
- Service is resuming work after pause – default 5000
- Service is pausing – default 6000
- Service is paused – default 7000
Using Minimum aggregation is recommended because you can configure alert thresholds below 2000 to detect when a service stops.
Step 3: Obtain the Monitoring Script
Request the ServiceMonitoring.ps1 script through a Dotcom-Monitor support ticket if it is not already available in your environment.
Step 4: Prepare the Target Server
Open PowerShell as Administrator on the Windows server where the monitored service runs.
Navigate to the directory containing the monitoring script. Example:
cd C:\ps\
Enable PowerShell script execution if required:
Set-ExecutionPolicy Unrestricted
You may need to confirm the execution policy change.
Step 5: Run the Monitoring Script
.\ServiceMonitoring.ps1 `
-collector <CollectorID> `
-task <TaskUID> `
-service "<Service Name>" `
-log
Requirements:
- Collector ID: Available under Manage > MetricsView Collectors.
- Task UID: Found in the MetricsView device settings while editing the task.
- Service Name: Must exactly match the service name shown in
services.msc
Step 6: Verify Script Execution
With the –log command you can verify if the script is working correctly in the event viewer. Review Event Viewer entries to confirm the script is successfully collecting and sending service status information.
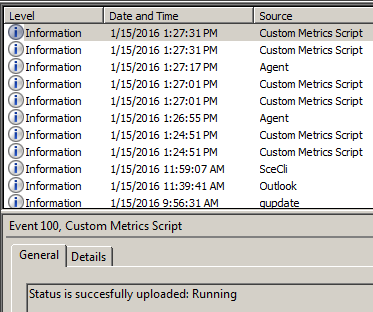
By default, the logging is done to the Microsoft Management Consol only.
Step 7: Schedule Automatic Execution
Set up the script to run periodically through Windows Task Scheduler or any other tool you use to run scripts.
Customizing Service Status Values
The service status can be in 7 states. You can override default service state values by specifying custom parameters:
-stopped <number>
-starting <number>
-stopping <number>
-running <number>
-continuing <number>
-pausing <number>
-paused <number>
Example:
.\ServiceMonitoring.ps1 `
-collector 117355baa9e8470eac602b48fd9e3b23
-task 67890 `
-service "Spooler" `
-running 100 `
-stopped 0
Built-In Script Help
To display available parameters and usage information:
.\ServiceMonitoring.ps1
This returns built-in help for supported options and configuration settings.
-
Why Dotcom-Monitor Can Help You Monitor Windows Services
A service, or Windows service, is a background application that can be launched in various ways. A service can be started automatically on Windows start or started if another application needs it for its work. Windows Services run in the background and usually don’t interact with users. Most services can be stopped by a user, but there are also those that cannot be stopped since they are necessary for the normal operation of some components of the operating system.
Typically, various servers are implemented as the services (for example, database servers), monitoring utilities, and other applications that can work completely independently of user actions. Windows OS has a lot of its own services, and you can work with them as well as with other custom services from the Task Manager > Services or by running services.msc from the command line.
So why is it so important to monitor Windows Services? One of the important criteria of a server’s performance is the state of its Windows services. There are some critical Windows services that must be up continuously while the server is up.
Also, there are a lot of applications such as Active Directory that are using their services running on a Windows server. Or, for example, you have created your own software that uses multiple custom services installed on a Windows server to work. If these services are an essential part of the applications, they must be running without any errors.
Thus, monitoring of Windows services on the servers is one of the main tasks of a system administrator to keep tabs on the server performance.
Monitoring the State of Windows Services with Powershell
To monitor the status of Windows services you can use Powershell. For example, using the Get-Service cmdlet, you can get a list of all services installed on the system, their status and startup type:
PS C:\Windows\system32> Get-Service
This command will list all services and their status (started or stopped) and display names. With some scripting experience, it is possible to configure a custom Windows services monitoring solution on the Powershell’s commands (e.g., Get-Service, Get-Process, Send-MailMessage, etc. ) basis.
Using Dotcom-Monitor’s MetricsView Service for Windows Services Monitoring
Although using Powershell and custom scripts that are written for Windows services monitoring is a common approach, it becomes problematic when the number of monitored servers and services grows. In this case, it is recommended to use automated monitoring tools such as MetricsView by Dotcom-Monitor.
MetricsView allows users to set up monitoring of the services on the remote Windows servers. The tool does not require any Powershell scripting skills or deep knowledge in system administration from a user. Using a user-friendly graphical interface, one can install a MetricsView software on the target Windows server, create a monitoring task including error threshold, set up frequency and the scheduler of the monitoring, pull reports on the dynamics of the services. Moreover, MetricsView offers a built-in alert notification system to send notifications when the monitored services change their status.