Home » Features » Private Agents

Monitor Everything Behind Your Firewall — Without Opening It

A Private Agent is a Dotcom-Monitor monitoring node you install on your own hardware, inside your own network. It runs the same synthetic checks our public locations run — real-browser transactions, API calls, protocol and network probes — against intranet apps, internal APIs, and infrastructure the public internet can never reach.

Every connection is initiated by the agent, outbound. No inbound firewall rules, no internal host published to the internet, and no vendor VPN terminating inside your network.
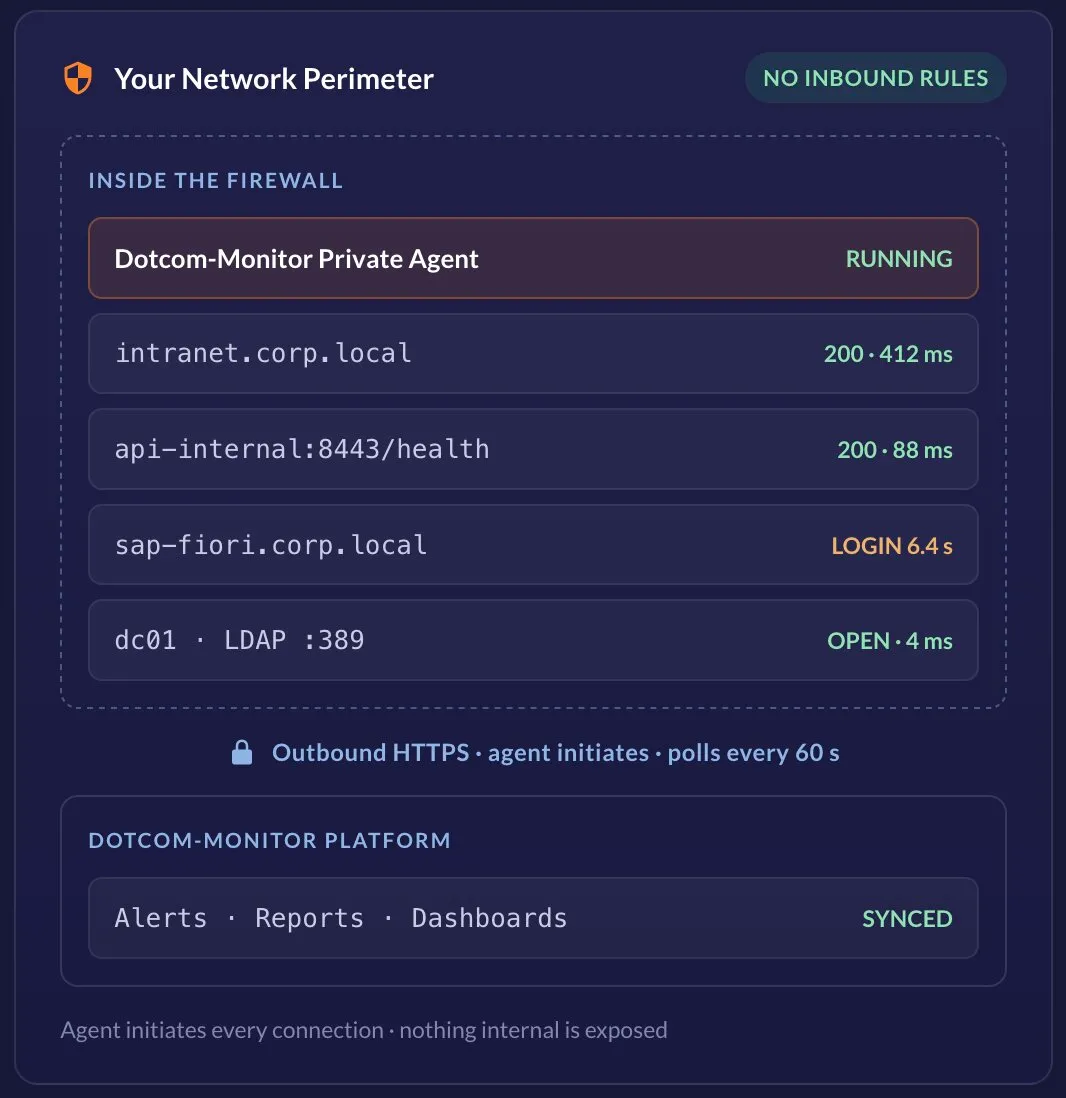
Illustration of a Dotcom-Monitor Private Agent running inside a corporate firewall, monitoring internal hosts including intranet.corp.local (200/412 ms), api-internal:8443/health (200/88 ms), sap-fiori.corp.local (6.4 s login) and dc01 LDAP :389, and syncing alerts, reports, and dashboards to the Dotcom-Monitor platform via outbound HTTPS every 60 seconds
Outbound-only

No inbound firewall rules

2 editions

Full & Protocol

Windows · Linux

64-bit host, your hardware

From $4.95

Per agent, per month
What is a Private Agent?

A Monitoring Location You Own, Inside Your Own Network

A private monitoring agent is a monitoring component installed on a host inside your internal network that runs synthetic checks against applications, websites, and services which are not reachable from the public internet.

For Dotcom-Monitor, that means intranet portals, internal APIs, staging environments, line-of-business systems, and infrastructure sitting behind firewalls or VPN tunnels — all tested with the same engine that runs our public monitoring locations.

At a Glance

What it is

Self-hosted monitoring node

Runs on

Your Windows or Linux host

Editions

Full · Protocol

Connectivity

Outbound HTTPS only

Appears as

A monitoring location

Managed from

Manage > Private Agents

Protocol Edition

From $4.95 /agent /month

Full Edition

From $199 /agent /month

Private Agents don’t replace external monitoring locations — they extend monitoring into your environment. Once registered, an agent appears in your account as its own monitoring location alongside our global public locations, so you can run the same device from both sides of the perimeter and compare the results. When the outside view and the inside view disagree, that disagreement is usually the diagnosis.

Runs checks against addresses only your network can resolve
Appears as a selectable monitoring location in Device Manager
Results land in the same reports, dashboards, and alerts as public data
Dedicated to your account — only your organization can use it or see its data
Architecture

How a Private Agent Talks to the Platform

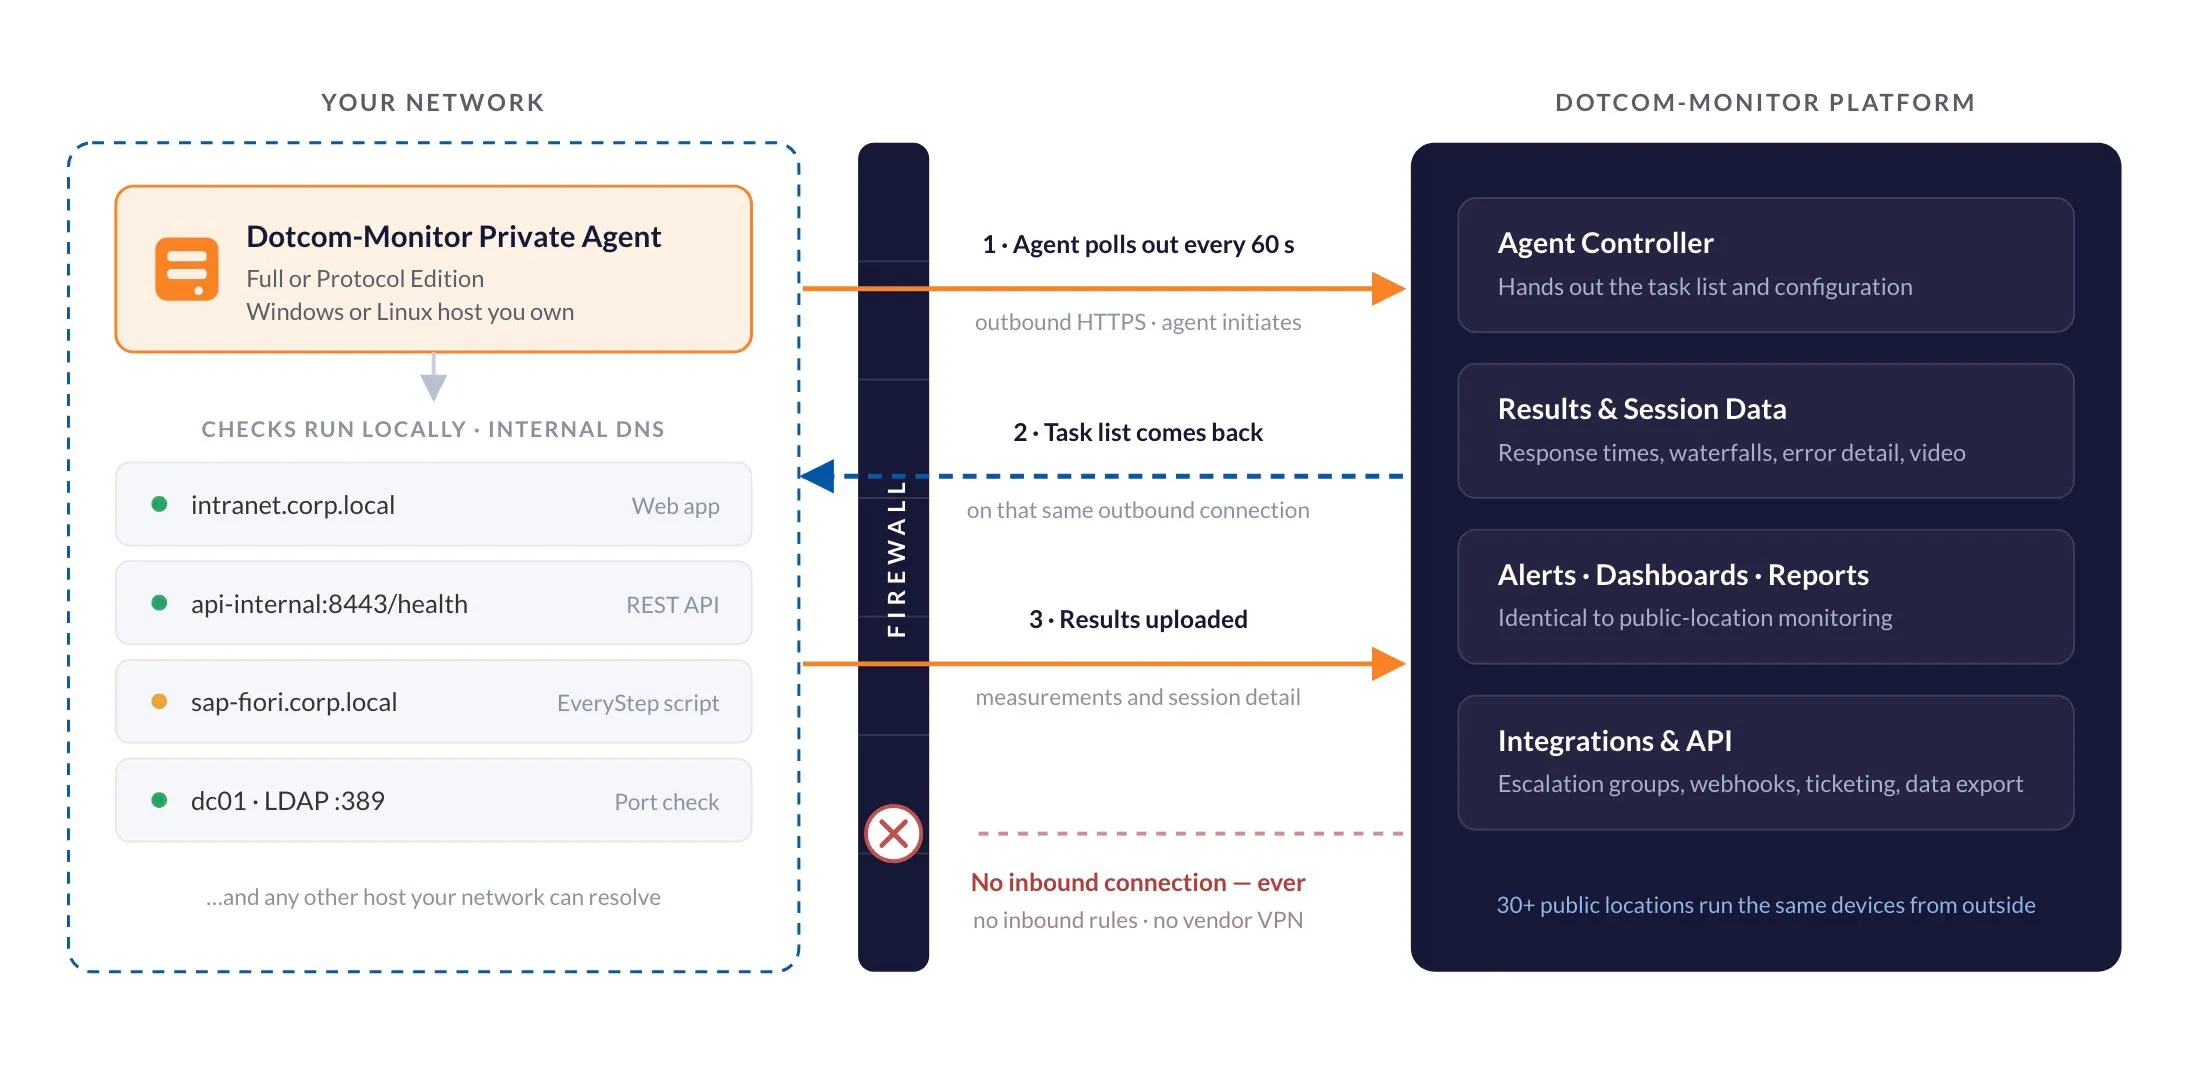
The connection model is the part security teams care about most, so here it is in plain terms: the agent always initiates. Dotcom-Monitor never connects in to your network, and there is no persistent tunnel to keep open.

Architecture diagram of a Dotcom-Monitor Private Agent behind a corporate firewall, showing the outbound-only communication model: the agent polls the Dotcom-Monitor platform every 60 seconds, receives its task list on the same outbound connection, and uploads results — with no inbound firewall rules and no vendor VPN

The only firewall change you need is outbound access to a published Dotcom-Monitor allowlist. Everything else — task delivery, results, alerting — travels on connections the agent opened itself.

1

Agent Polls Out

Every minute the agent makes an outbound HTTPS request to the Dotcom-Monitor controller and asks whether there is anything to run. If not, it sleeps for another minute.

2

It Pulls Its Task List

Configuration comes down over the same outbound channel: which devices are assigned to this agent, their targets, intervals, thresholds, and scripts.

3

Checks Run Locally

Requests originate from inside your network, against internal DNS and internal addresses — exactly the path your users take.

4

Results Go Up

Only measurements, response data, and session detail are uploaded — over the same outbound HTTPS connection the agent opened.

5

Alerts Fire Normally

From there it’s identical to public-location monitoring: the same alert rules, escalation groups, integrations, dashboards, and reports.

Why “stateless” matters: because the agent polls rather than holding an open session, there is no long-lived inbound-capable connection for a security team to review — but it also means the platform learns an agent is gone only when results stop arriving. That timeout is configurable per agent under Manage > Private Agents, and you can have the platform alert you when an agent goes quiet or when its failed-session ratio climbs.

Choose your edition

Full Edition or Protocol Edition

Two builds of the same agent. The Full Edition drives a real browser, which is what makes multi-step user journeys and Lighthouse metrics possible — and what makes it heavier. The Protocol Edition drops the browser layer for a lightweight footprint on smaller hosts.

Capability
Full Edition
Protocol Edition
Real-browser monitoring (BrowserView / UserView)
Multi-step web transactions (EveryStep scripts)
JavaScript execution & dynamic rendering
Lighthouse reports — public and login-protected pages
Authentication workflows
HTTP / HTTPS monitoring
REST, SOAP & API monitoring
Postman & Insomnia collections
Network & service checks — TCP port, DNS, SMTP, FTP, ping
Resource usage
Higher
Lower
Installation footprint
Larger
Lightweight
Price
From $199 per agent, per month
From $4.95 per agent, per month

Rule of thumb: if the thing you need to watch is a login, a form, a cart, or a portal a human clicks through, you need the Full Edition. If it’s an endpoint, a port, a record, or a service, the Protocol Edition is enough. The price gap reflects the real one — a Full Edition agent drives a live browser on a 16 GB host — so most teams deploy Protocol Edition broadly across sites and add Full Edition only where a scripted journey earns it.

Monitoring scope

Everything the Platform Monitors — Aimed Inward

A Private Agent isn’t a stripped-down probe. It executes the platform’s real device types, so the checks you already trust on public endpoints work identically on internal ones.

Web Pages & Apps

Real-browser page loads and full EveryStep transaction scripts against intranet portals, SSO flows, and internal line-of-business apps.

APIs & Web Services

REST, SOAP, GraphQL and WebSocket endpoints, plus whole Postman and Insomnia collections run from inside the network.

Servers & Protocols

TCP port and Telnet checks, DNS resolution, SMTP/POP3 mail paths, FTP, and other protocol-level service availability.

Network Reachability

ICMP ping and traceroute across the same paths your users and site-to-site tunnels take, from either end.

Devices assigned to a Private Agent can also be assigned to public locations at the same time. Running one device from both an internal agent and an external node is the fastest way to separate “our app is broken” from “our egress path or DNS is broken.”

Security Model

Designed to Pass an InfoSec Review

Installing a vendor agent inside the perimeter raises two questions: what does it need to reach, and what can reach it? A Private Agent needs outbound HTTPS to a published Dotcom-Monitor allowlist — the same direction of traffic your firewall already permits for any workstation — and nothing outside your network needs to reach it at all.

No Inbound Exposure

You never publish an internal host, open a listening port to the internet, or terminate a vendor VPN inside your network. The agent reaches out; nothing reaches in.

Your Data Stays Yours

An agent is dedicated to a single Dotcom-Monitor account. Only your organization can assign devices to it or view the results it produces.

Pinned to Approved Hosts

The optional Allowed IPs list restricts which server addresses an agent may monitor from. An agent moved to an unlisted IP is blocked automatically.

Client Certificate Support

For internal services that require mutual TLS, export the certificate to the agent’s certificate folder and reference it by name in the task’s SSL settings.

Credentials Never Hard-coded

Scripts running on a Private Agent reference encrypted values from Secure Vault instead of embedding passwords in the script body or video reports.

Proxy-Aware

If your egress goes through a forward proxy, the agent can be configured to use it — proxy address and port are set in the agent’s advanced settings.

Where teams deploy them

What Private Agents Are Actually Used For

Some of these are obvious the moment you have an internal app. Others are the ones experienced teams add after their first bad week.

Intranet Portals & Internal Line-of-Business Apps

ERP, CRM, payroll, HR systems, the help desk, file shares, SharePoint, internal wikis. Scripted logins from inside the network tell you the portal is working before three hundred employees tell you it isn’t.

SSO and Identity Paths

When SSO degrades, every integrated application looks broken while each app’s own metrics stay green. A scripted login through your identity provider isolates the real culprit in one check.

Staging & Pre-Production Environments

Point the same devices at staging on an internal agent and at production on public locations. You catch regressions on the release candidate using the exact checks that guard production.

Recording Scripts for Internal Apps

The web-based EveryStep Recorder can’t reach an application that isn’t public. Enable Allow Record and Play Script on an agent and the recorder captures the journey through that agent — so internal apps get real scripted monitoring, not just port checks.

Branch Offices and per-Site Experience

One agent per location turns “it’s always slow in the Denver office” from an anecdote into a per-site chart. Place agents by failure domain — near users, near the app tier, behind the VPN — and let their disagreement point at the layer that’s actually failing.

Monitoring from Your Customer's Network

If you sell software that enterprises run behind their own firewall, an agent inside that environment catches problems caused by their network — which still feels like your problem to them.

Internal APIs and Service-to-Service Calls

Run whole Postman or Insomnia collections against services that are only addressable inside the cluster or VPC, on the same schedule and alerting as your public API monitors.

Domain Controllers and Core Infrastructure

One check that consistently earns its keep: query response time on your domain controllers. LDAP and Active Directory slowdowns surface as inexplicable application slowness everywhere else.

Third-Party Dependency Triage

Run paired checks — one public, one from inside your normal egress path. Public passing while private fails points at your egress or DNS; both failing makes it the vendor’s problem, with evidence.

Deployment

From Zero to a Live Internal Monitoring Location

Installation is a short, ordinary IT task. The longest part is usually getting the outbound allowlist approved.

Have Private Agents Enabled on Your Account

Private Agents are a paid add-on to any Dotcom-Monitor subscription — from $4.95 per agent, per month for the Protocol Edition and $199 per agent, per month for the Full Edition. Once enabled, the Manage > Private Agents section and the installer download become available in your account.

1

Allow Outbound Access to the Dotcom-Monitor Controller

Whitelist either our IP range or the controller hostnames from the host that will run the agent. No inbound rules are required. Exact values are in the technical specifications below.

2

Create the Agent Object in Your Account

Go to Manage > Private Agents > New Agent, choose Full Edition or Protocol Edition, name it after the site or failure domain it represents, and save.

3

Install and Register on the Host

Download the matching installer from the same screen, run it as an administrator, then sign in through the registration dialog and select the agent object you just created. Registration takes a few minutes.

4

Assign Devices to It

Open any device, go to the Locations tab, and select your agent from the Private Agents section. Results start flowing into the same reports, dashboards, and alert rules as every other location.

5

Sizing tip: browser-based monitoring is bound by CPU, not bandwidth. A practical starting point is one concurrent browser device per core, minus one for the operating system — so an 8-core host comfortably runs about seven. Protocol-only checks are far cheaper and scale into the hundreds per host. Numbers and formulas are in the specifications block below.

For the engineer doing the install

Technical Specifications

Everything you’d normally have to open a support ticket for, in one place.

Requirements, network access, sizing & operations System requirements · outbound allowlist · concurrency limits · certificates · updates

System requirements

 Full EditionProtocol Edition
CPU2-core or higher (see sizing below)2-core or higher
Memory16 GB RAM8 GB RAM
Disk2 GB free2 GB free
WindowsWindows Server 2016 or higher, 64-bitWindows 10 or higher, 64-bit
Linux64-bit distribution64-bit distribution
Windows prerequisites.NET Framework 4.7.2+, administrative access; Remote Desktop service enabled for browser-based tasks; Windows Media Player for streaming media tasks.NET Framework 4.7.2+, administrative access
HostA dedicated, stable machine is strongly recommended — not a shared utility box that gets rebooted without warning.

Outbound network access

Allow outbound HTTPS from the agent host to Dotcom-Monitor. Whitelist either the IP range or the hostnames — the range is recommended because it survives DNS changes.

  • IP range (recommended): 8.29.56.0/23
  • Hostnames: *.dotcom-monitor.com, *.dotcom-monitor.us
  • Configuration service: privateagentcontroller.dotcom-monitor.com/PrivateAgentController/RemoteConfigurationService.svc and the privateagentcontroller2 equivalent — used to receive configuration settings.
  • Connection endpoint: privateagentcontroller.dotcom-monitor.com/PrivateAgentWebProxy/entrypoint.wproxy and the privateagentcontroller2 equivalent — used to establish the connection and upload results.
  • Account endpoints: userauth.dotcom-monitor.com, user.dotcom-monitor.com (and their .us counterparts).
  • Inbound rules required: none.
  • Forward proxy: supported — set the proxy address and port in the agent's advanced settings.
Three things break agents far more often than architecture does: proxy authentication, TLS inspection and certificate trust, and whether the agent resolves internal DNS the same way your employees do. Validate those three before troubleshooting anything else.

Communication model

  • Communication is stateless. The agent checks in with the controller roughly every 60 seconds to ask whether there is work; if there is nothing to run it sleeps for another minute.
  • There is no persistent connection, so agent availability is inferred from uploaded results. If no data arrives within a configurable window, the agent is marked unavailable. That timeout is set per agent under Manage > Private Agents.

Capacity & concurrency

  • Browser-based devices (BrowserView / UserView): each device is a browser instance. Practical ceiling is cores − 1. Default concurrency is 4; raise it in the agent's Concurrent Monitoring setting and restart the agent for the change to take effect.
  • Protocol devices (Web Services / Internet Infrastructure): an 8-core host executes roughly 50 devices in parallel. With a 2-second average execution time and a 1-minute interval, that works out to about 1,500 protocol checks per minute per agent.
  • To raise the parallel-device ceiling on hosts larger than 8 cores / 16 GB, contact technical support — it is an account-side setting.
  • Streaming media checks consume noticeably more resources than HTTP checks; size accordingly.
  • Need more headroom? Install additional agents. Two agents on one site behave as two independent locations.

Agent health

  • Failed Ratio — the proportion of failed sessions to total sessions the agent was asked to execute, shown per agent under Manage > Private Agents. Under 10% is considered acceptable; consistently above 10% points at session limits, host resources, or connectivity.
  • Sessions that return a monitoring error still count as successful for Failed Ratio purposes, as long as the results reached the platform. Failed Ratio measures the agent, not the target.
  • Agent-level alerts (agent unreachable, failed ratio exceeded) are configured per agent and are delivered by email. Device-level alerts use the full alerting stack — integrations, escalation groups, schedules, and all.
  • A per-agent usage report is downloadable as CSV.

Client certificates

  • Export the certificate as a PFX with the private key marked exportable. It does not have to be exported from the agent machine — any machine on your network works.
  • Copy the file into the agent's certificates folder, restart the agent service, then reference the file name in the task's SSL / Certificate Check > Client Certificate field.
  • Full step-by-step, including the required export password: Installing a certificate on a Private Agent.

Versions & updates

  • Autoupdate is on by default and applies minor version updates automatically.
  • Activating an older version manually turns autoupdate off — re-enable it deliberately.
  • Major version changes are a clean reinstall: uninstall, remove the program folder, download the current installer for your edition, install.
  • Version selection and rollback are handled in the Agent Version Manager utility installed alongside the agent.

Not the same as LoadView agents

The monitoring Private Agent is distinct from LoadView's On-Site Proxy Agent and On-Prem Load Injector, which generate load for performance tests rather than running synthetic monitoring. Different installers, different management screens, different sizing. If you need to load-test an internal application, you want the LoadView agents — see the load testing product.

Full installation walkthroughs, screenshots, and troubleshooting live in the Private Monitoring Agent knowledge base.

Built on Private Agents

Solutions That Use Internal Monitoring

If you’re here because of a specific problem rather than the technology, start with one of these.

Watch site-to-site tunnels and client VPN access from both ends, and catch silent tunnel drops in minutes instead of at 9 a.m.

Full-stack coverage of protocols, servers, SNMP, and the internal applications sitting behind your firewall.

Ping, traceroute, and port checks run outside-in and inside-out, so you can tell which side of the perimeter is failing.

What Our Customers Say

"We had a site-to-site tunnel between our data center and AWS that would silently drop every few weeks at 3 AM. A Dotcom-Monitor Private Agent pinging across the tunnel caught it within a minute and paged the right on-call."
— Network Engineering Lead, Financial Services · Verified customer

Extend Monitoring Past Your Perimeter

Private Agents are an add-on to any paid Dotcom-Monitor plan — from $4.95 per agent, per month for the Protocol Edition and $199 for the Full Edition. Tell us what’s behind your firewall and we’ll scope the right edition and agent count with you.

A sales engineer will help you choose the edition, size the host, and get the outbound allowlist through your security team.

Already a customer? Support can enable Private Agents on your existing account.

Frequently asked questions

Common Questions About Private Agents

No. The Private Agent initiates every connection outbound over HTTPS to the Dotcom-Monitor controller — to fetch its task list and to upload results. Nothing from Dotcom-Monitor connects into your network, and no internal host is published to the internet. You only need to allow outbound access to our IP range or controller hostnames.

Windows and Linux, 64-bit. On Windows, the Full Edition requires Windows Server 2016 or higher and the Protocol Edition requires Windows 10 or higher, both with .NET Framework 4.7.2 or later. Linux hosts are supported for both editions — contact us for the current distribution list and installation package.

The Full Edition drives a real browser, so it runs page-load monitoring, multi-step EveryStep transaction scripts, authentication workflows, JavaScript rendering, and Lighthouse reports — including on login-protected pages. The Protocol Edition drops the browser layer: it covers HTTP/HTTPS, REST and SOAP APIs, Postman and Insomnia collections, TCP port, DNS, SMTP, FTP, and other protocol and network checks, with a smaller footprint and lower resource requirements. Many customers run both.

Private Agents are a paid add-on to a Dotcom-Monitor subscription, priced per agent per month. The Protocol Edition starts at $4.95 per agent, per month and the Full Edition starts at $199 per agent, per month — the difference reflects the resources needed to drive a real browser. You can mix editions across sites, and volume and enterprise pricing is available, so contact sales for a quote covering the agent count you need. Once the add-on is enabled, the installer download and the Manage > Private Agents screen become available in your account.

Yes, with the Full Edition. Record the journey with the EveryStep Recorder using the Private Agents option in the “Record and Play Script from” menu — the recorder then reaches your application through the agent, which is the only way to script an app that isn’t publicly reachable. Credentials used in the script should be stored as encrypted variables in Secure Vault so they never appear in the script body or the video report.

It depends on the check type. Real-browser devices are CPU-bound — plan on roughly one concurrent browser per core minus one for the OS, so about seven on an 8-core host. Protocol checks are far lighter: an 8-core host runs around 50 devices in parallel, which works out to roughly 1,500 checks per minute at a two-second average execution time. If you need more, install additional agents or contact support to raise the concurrency ceiling.

Because the agent polls rather than holding an open connection, the platform detects an outage by the absence of uploaded results. You set the tolerance window per agent, and the platform can email you when an agent stops reporting or when its failed-session ratio rises above your threshold. A common approach is to run two agents and have each monitor the other, so a host failure is caught by its pair.

No. A Private Agent appears as a monitoring location in your account, grouped under a “Private Agents” section alongside our public locations. Its data flows into the same dashboards, reports, SLA calculations, alerts, and integrations. That’s what makes side-by-side internal and external comparison useful — same device, same metrics, two vantage points.

Yes. The optional Allowed IPs setting restricts an agent to a specific list of server IP addresses. If the agent is installed on or moved to a host with an unlisted IP, it is blocked from monitoring — a useful guardrail in environments where images get cloned or VMs get migrated.

No. The monitoring Private Agent runs synthetic monitoring from inside your network. LoadView’s On-Site Proxy Agent and On-Prem Load Injectors generate load for performance testing behind a firewall. They are separate installers, managed from separate screens, with different sizing. If you need to load-test an internal application, see load testing.

Contact sales to have Private Agents enabled on your account, then follow the Private Monitoring Agent knowledge base articles for installation and registration. Most teams are running their first internal check the same day the outbound allowlist is approved.