- Application Performance Monitoring
- Agentless · Outside-in
Application Performance Monitoring for the User, Not the Server
Dotcom-Monitor’s application performance monitoring software watches your apps the way users actually experience them — from 40+ real desktop and mobile browsers, across 2G to 4G networks, on tier-3 checkpoints spread over six continents. No agents to install. No code to change. No SDKs to maintain.
- No credit card required
- All four platforms included
- Live in under 5 minutes
- Cancel anytime · No auto-charge after trial
UV
- Application Monitoring
UserView
Multi-step transaction monitoring — record real user journeys in a real browser and replay them worldwide every few minutes.
BV
- Page Speed
BrowserView
Element-level page-load analysis across 40+ real browser/device combinations — full waterfall, errors, and screenshots.
SV
- Infrastructure
ServerView
Continuous checks for the protocols and internet services your app depends on — DNS, SSL, mail, FTP, VoIP, and more.
WV
- Web services
WebView
SOAP, REST, and JSON API monitoring — chain requests, pass tokens, validate payloads, import Postman & Insomnia.
UserView
Multi-Step Transaction Monitoring
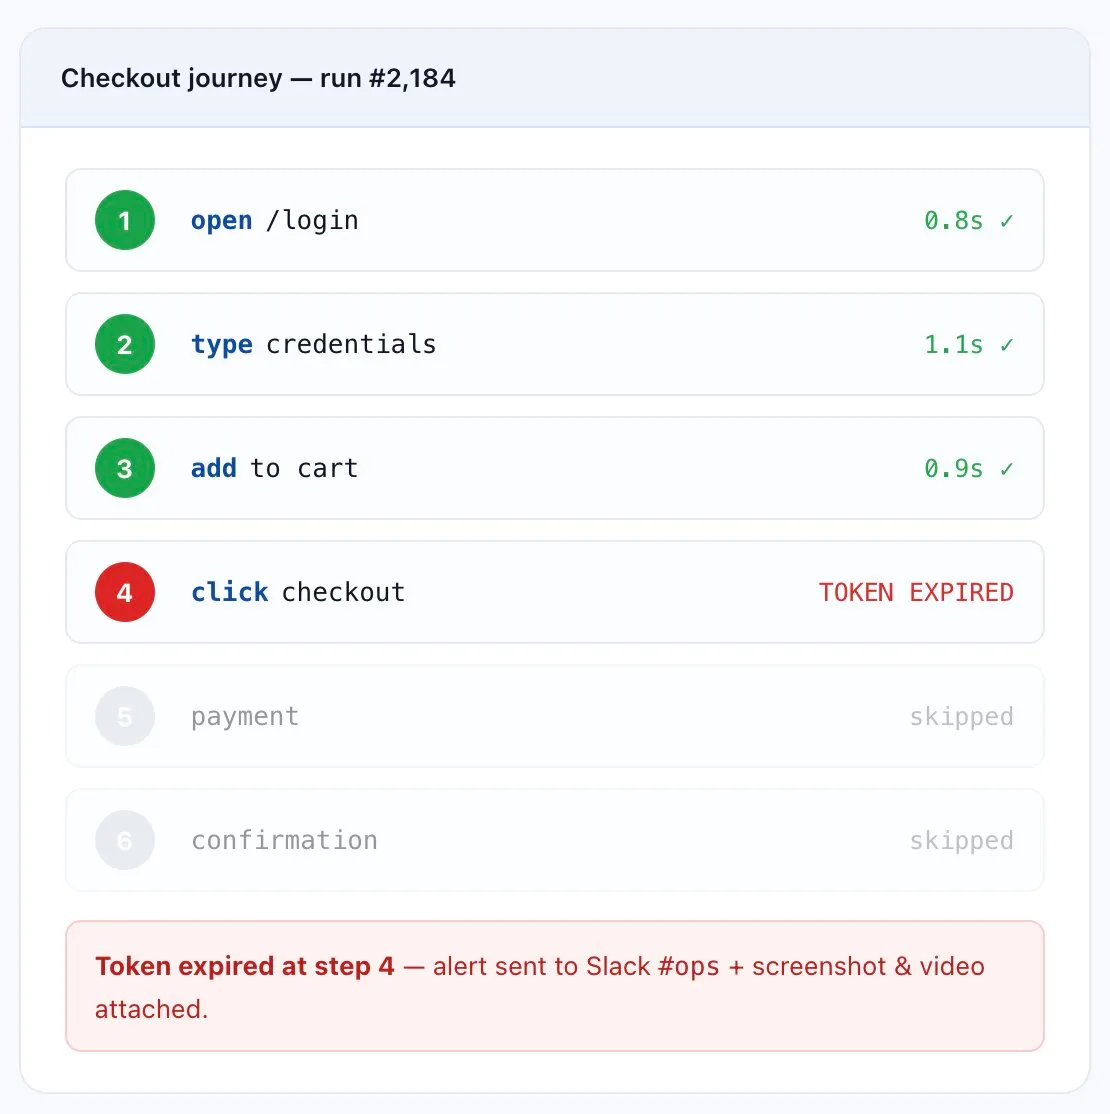
Record real user journeys in a real browser — login, search, add-to-cart, checkout, post-purchase confirmation — and replay them every few minutes from monitoring locations around the world.
- Catches the break that only happens at step 4 of 6 — when a session token expires or a payment provider’s CSP header changes.
- Step-level timings, screenshots, and HAR exports for every run.
- Runs scripted logins end-to-end through Okta, Auth0, Azure AD, and Ping.
Use it for: critical user journeys, SLA verification, e-commerce funnels, regulated workflows.
BrowserView
Element-Level Page-Load Analysis
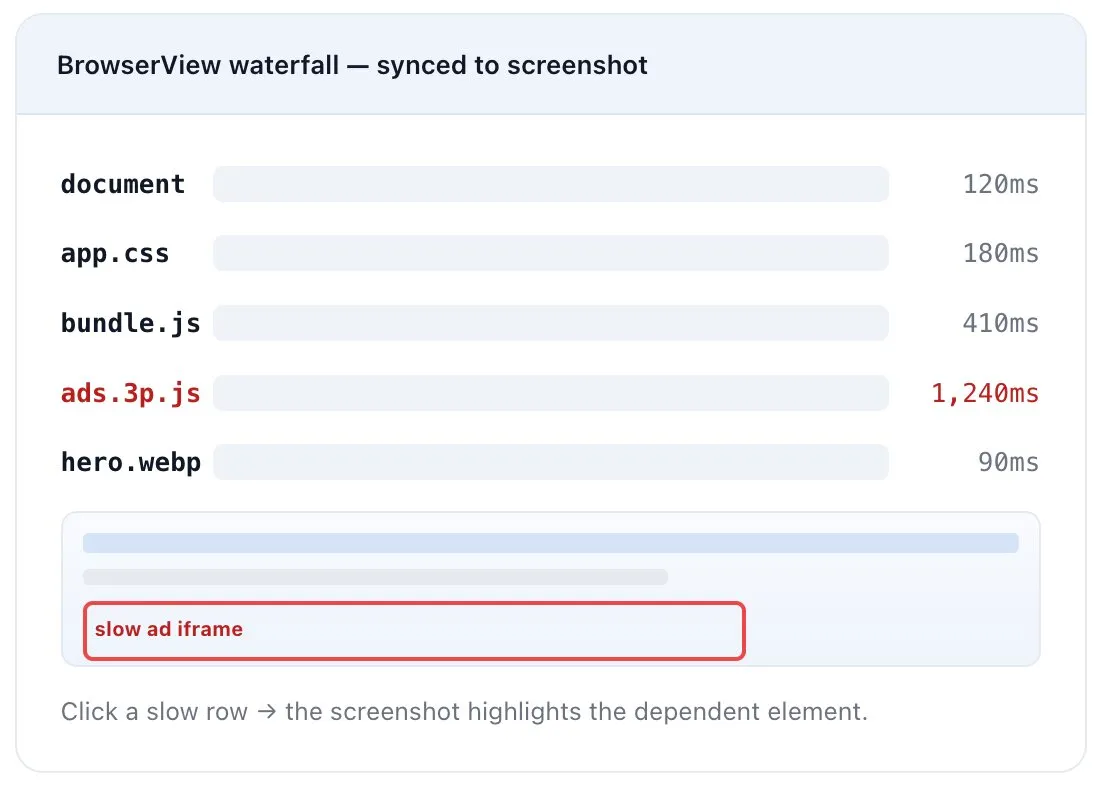
Load any URL in a real browser across 40+ desktop and mobile browser/device combinations. Get a full waterfall, every resource’s timing, render-blocking assets, JS errors, console output, and a screenshot at the exact moment of the issue.
- See which resource — yours or a third party’s — slowed the page.
- JS errors and console output captured from the real browser session.
- Screenshot stitched to the waterfall row that caused the problem.
Use it for: marketing landing pages, post-deploy regression checks, third-party tag monitoring, Core Web Vitals tracking.
ServerView
Infrastructure & Internet-Service Checks
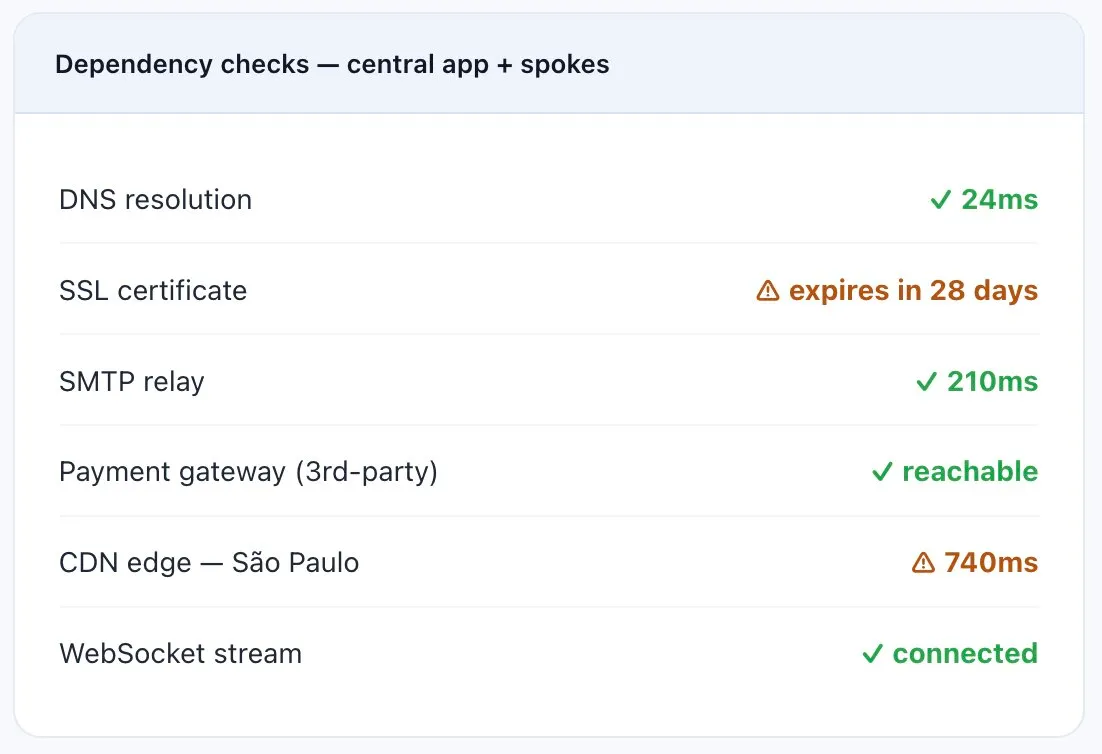
Continuous checks for the protocols and services your app depends on: DNS, SSL certificates (including expiry), SMTP/IMAP/POP3, FTP, ICMP, Telnet/TCP ports, Traceroute, VoIP/SIP, streaming media, WebSocket, and more.
- Surfaces issues that take down apps even when the app itself is healthy — expired certs, DNS misconfiguration, network-path changes, or a downstream provider going dark.
- Certificate-expiry alerts far enough ahead to actually rotate them.
- Traceroute monitors from multiple regions to spot ISP-level routing changes.
Use it for: protocol health, certificate management, third-party dependency monitoring.
WebView
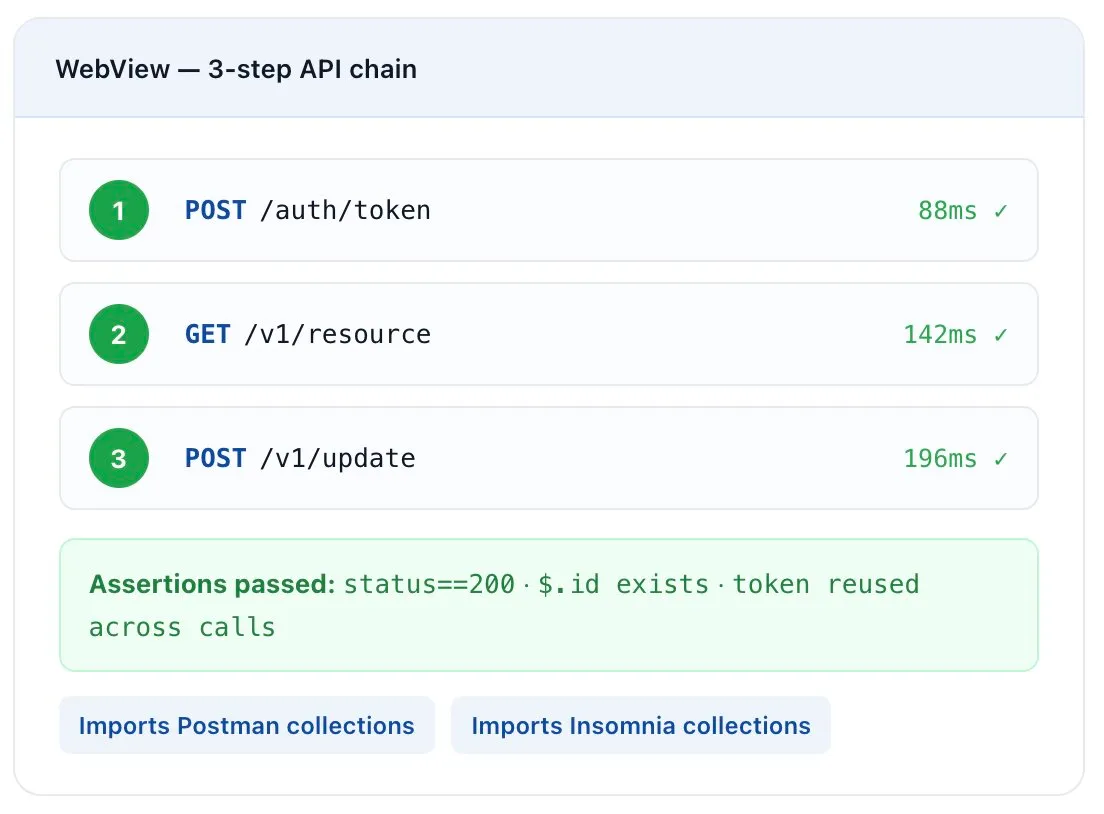
SOAP, REST & JSON API Monitoring
Continuous functional and performance monitoring for every API endpoint your app — or your customers — depend on. Chain multiple requests, pass auth tokens between calls, validate response payloads with assertions, and run from multiple geographies.
- Supports Postman and Insomnia collection imports — turn the work your engineers already did into a monitor in minutes.
- Variable passing keeps tokens alive across a multi-call workflow.
- Payload assertions on JSON, XML, and XPath.
Use it for: public APIs, internal microservices, partner integrations, webhook reliability.
Coverage
Real-Browser APM Across 40+ Browsers and Devices
If you’re only testing in Chrome on a fast Mac, you’re missing what most of your users actually see. Coverage is the foundation of any synthetic strategy.
Cross-Platform Browser & Device Coverage
40+ real desktop and mobile browser/device combinations — Chrome, Firefox, Safari, Edge, plus mobile Safari on iOS and Chrome on Android — running on actual browser engines, not headless approximations. Schedule the same monitor across multiple browsers and locations to catch regressions that only show up on, say, Safari iOS in São Paulo.
Browser × device matrix
Desktop | Tablet | Mobile | |
|---|---|---|---|
Chrome | Android | ||
Safari | iOS | ||
Firefox | |||
Edge |
Each combination runs from monitoring locations across six continents.
Framework & Language Compatibility
Single-page apps, server-rendered apps, micro-frontends, hybrid mobile — if it runs in a browser, Dotcom-Monitor can monitor it. Tested against HTML5, AJAX-heavy apps, and any framework that ultimately renders to the DOM.
React
Angular
Vue
Next.js
Svelte
Nuxt
Java
.NET
Node.js
PHP
Python
Ruby
Any DOM-rendered app
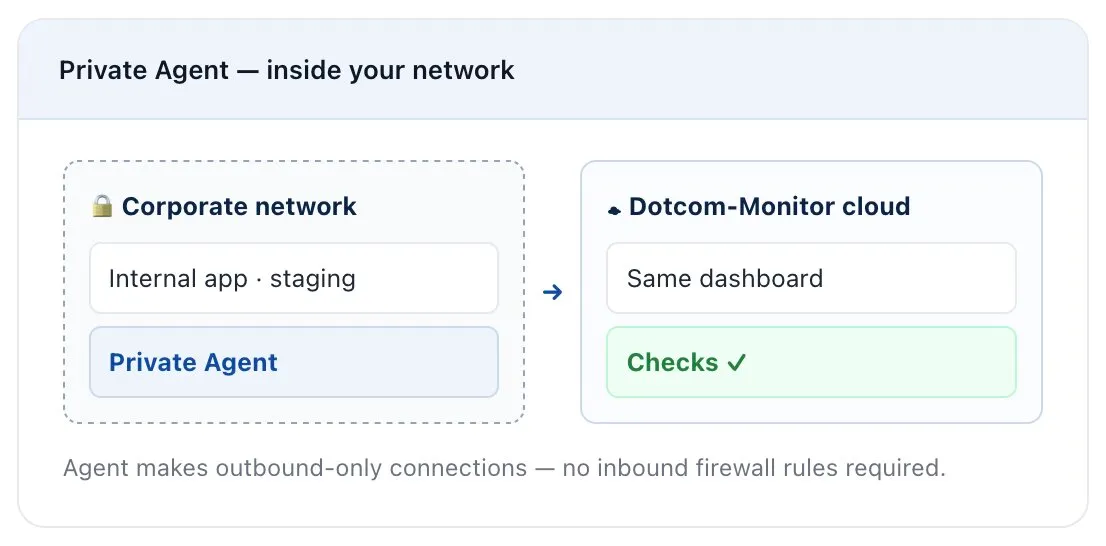
Internal App Monitoring With Private Agents
Monitor apps that don’t have a public IP — internal tools, staging environments, apps behind corporate VPN or SSO. Deploy a Private Agent inside your network, and Dotcom-Monitor’s cloud dashboard treats those checks the same as public ones.
- Works with external identity providers — Okta, Auth0, Azure AD, Ping — so a scripted login runs end-to-end on every check.
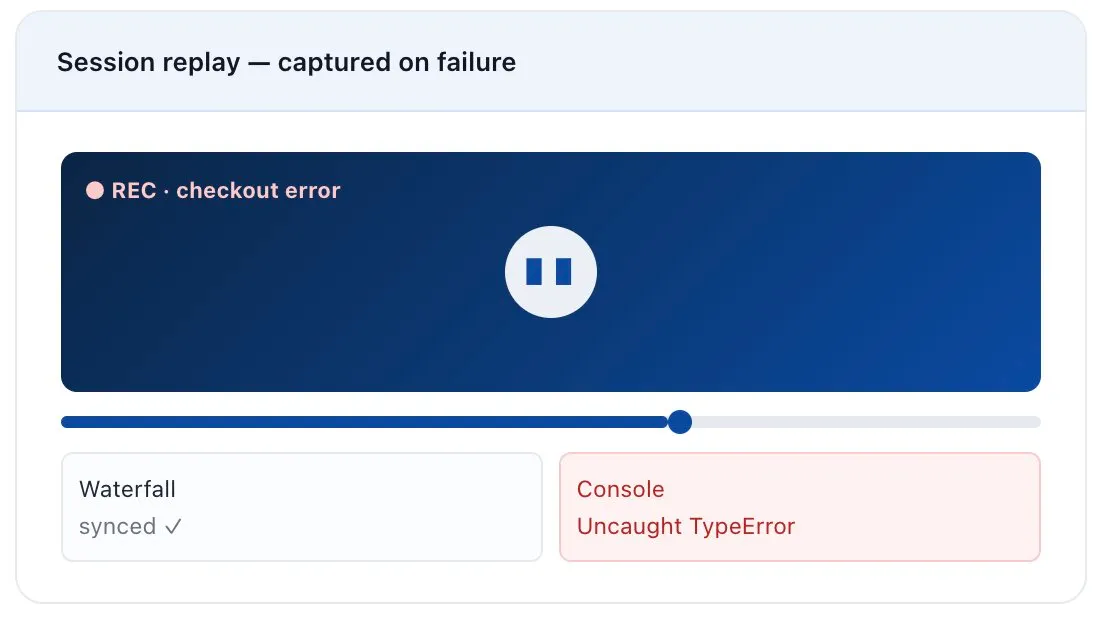
Error-Driven Video Recording
Stop asking users to send a screenshot. When a transaction fails or a page misbehaves, Dotcom-Monitor records the full session as video — only on errors by default, or on every run if you want continuous evidence.
- Pair the video with the waterfall and console log and root-cause analysis goes from hours to minutes.
Web Page Monitoring
Web Page Monitoring for Real User Experience
Page-load performance is where most user frustration starts. Dotcom-Monitor measures it the way browsers actually render — not how your CDN’s edge node reports it.
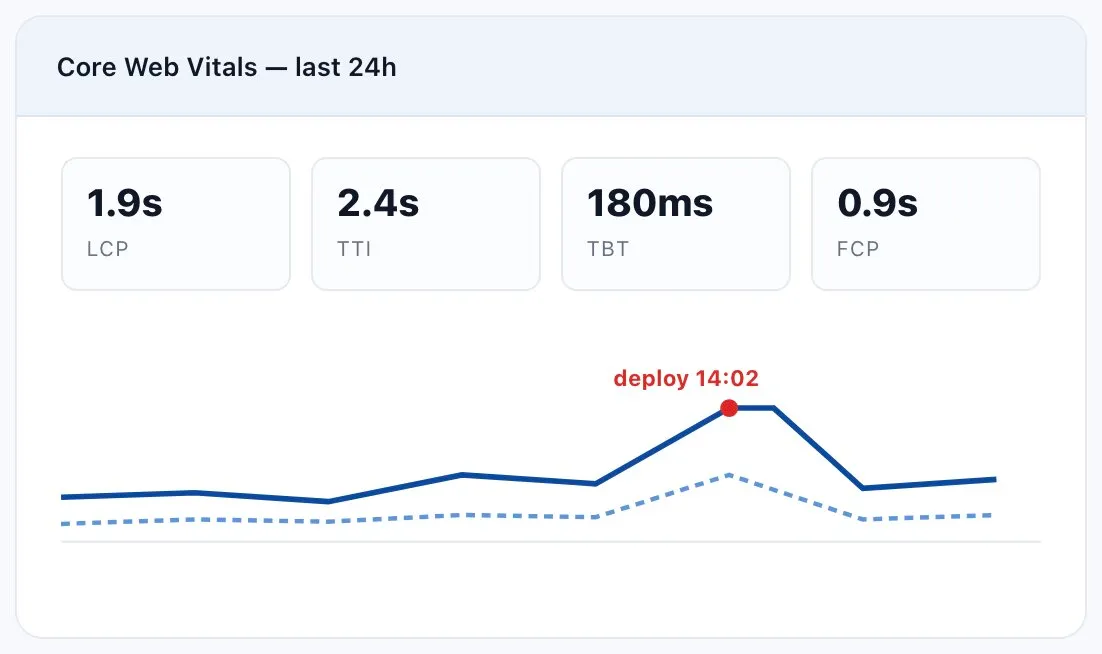
Real-Time Insights From Real Browsers
Measure Largest Contentful Paint, Time to Interactive, Total Blocking Time, and First Contentful Paint from actual desktop and mobile browser sessions. Set thresholds tied to your Core Web Vitals targets and alert when they degrade.
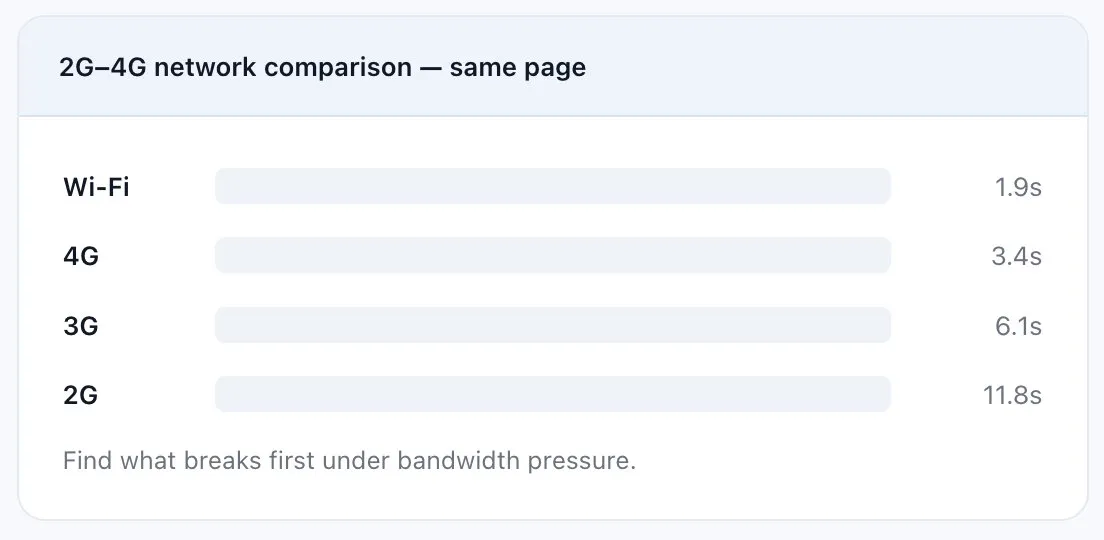
Adaptive Network Simulation (2G–4G)
Your users aren’t all on gigabit fiber. Throttle the monitor to 2G, 3G, or 4G and see exactly how the page behaves on a phone in transit. Compare results across network profiles to find what breaks first under bandwidth pressure.
Visual Error Tracking & Navigation Timing
When something breaks, you get a stitched view: the waterfall, the moment-of-failure screenshot, the JS console output, and a video replay. Per-resource timing — DNS, TCP, SSL, TTFB, content download, DOM events — comes straight from the Navigation Timing and Resource Timing APIs in the real browser.
- Useful for proving — or disproving — that a slow page is the CDN’s fault, not the application’s.
Features
The Features That Make All Four Platforms Usable on a Real On-Call Rotation
Global Monitoring Network
Tier-3 data-center checkpoints across six continents. Schedule monitors from specific regions to verify geo-routing, CDN performance, and regional outages independently — see slow São Paulo users in the data, not in a support ticket two days later.
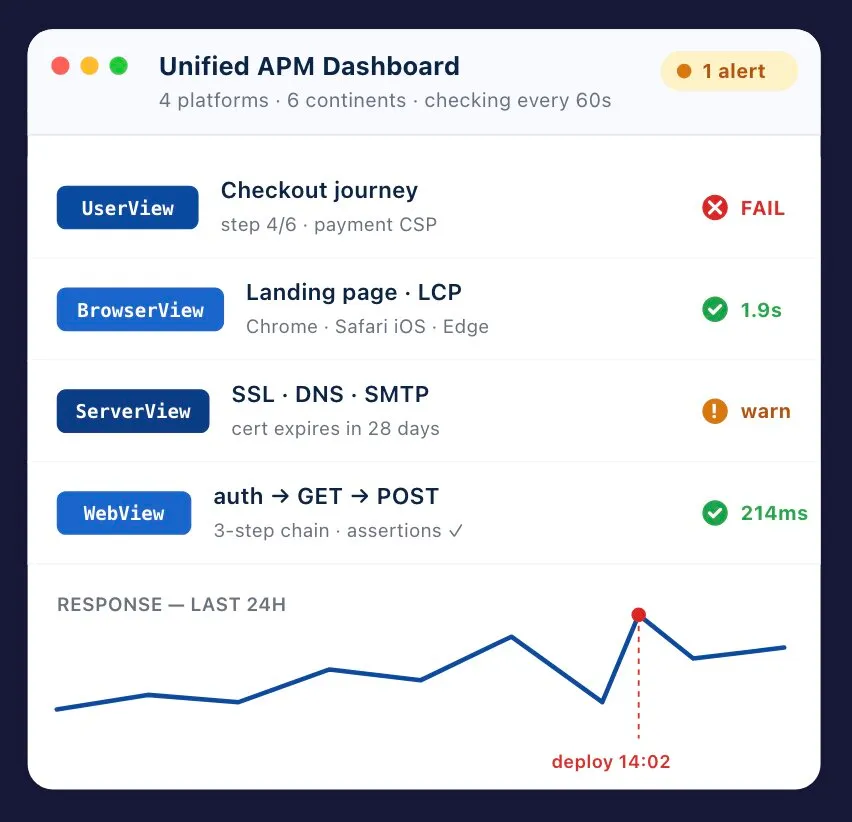
Unified Dashboard
One dashboard for UserView transactions, BrowserView page loads, ServerView protocol checks, and WebView API monitors. Drill down from a high-level health view into a specific failed step in seconds.
Configurable Reporting & SLA Tracking
Real-time dashboards, on-demand waterfall reports, scheduled PDF/CSV exports, and SLA reports for uptime, response time, and error rate against your thresholds. White-label reports for MSPs and agencies.
Custom Alerts & Notifications
Define thresholds per monitor, step, or metric. Route to PagerDuty, Slack, Teams, email, SMS, voice, or webhook. Suppress noise by requiring N consecutive failures or failures from M of N locations.
PagerDuty
Slack
Teams
SMS
Webhook
EveryStep Recorder & Scripting
Capture multi-step transactions with the EveryStep web recorder — point, click, fill in fields, submit. The recorder produces a portable script you can edit, parameterize, and reuse across monitors.
Holistic Application Insights
Aggregate health across all four platforms at the top; per-platform status in the middle; a single failed check with its waterfall and screenshot at the bottom. One drill-down path from green to root cause.
In the Real World
APM Across Industries That Depend on Uptime
How engineering teams in regulated, transaction-heavy industries actually use synthetic APM.
Insurance & Financial Services
Quote engines, broker portals, and claims-submission workflows that must work end-to-end on every check. Carriers run UserView scripts against the full quote-to-bind flow every 5 minutes from multiple geographies, with SLA reports that satisfy compliance audits.
Customer: Aflac.
Telecommunications & Media
Account portals, billing pages, and streaming endpoints at carrier scale. Streaming providers use WebView and ServerView together to confirm video manifests load and segment delivery stays under SLA, even when CDN behavior shifts.
Customers: Comcast, Dish.
Retail & E-Commerce
Storefronts where seconds of latency cost real revenue. UserView monitors the full search-to-checkout flow across 40+ browsers; BrowserView tracks Core Web Vitals on product pages; WebView watches inventory and pricing APIs. Teams alert on step-level regressions before they reach the conversion report.
SaaS, Technology & Enterprise IT
Login, SSO, dashboard, and API flows for SaaS products and internal tools. Teams run Private Agents inside their corporate network to monitor pre-production environments behind VPN — and use WebView Postman imports to monitor every documented endpoint continuously.
Customers: Dell, Citrix, Xerox.
How It Compares
Dotcom-Monitor vs. Traditional APM Tools
Most APM platforms are built agent-first — you instrument code to see inside it. Dotcom-Monitor is built outside-in. Here’s where that difference shows up against the platforms teams evaluate alongside it.
Capability | Dotcom-Monitor | New Relic | Datadog | Dynatrace | Site24x7 |
|---|---|---|---|---|---|
Agentless monitoring is the core product | Add-on | Add-on | Add-on | ||
Full value with no code instrumentation | Partial | Partial | Partial | ||
Monitors 3rd-party SaaS & partner APIs you don’t control | Partial | Partial | Partial | ||
Native Postman / Insomnia collection import as a monitor | Integration | Limited | |||
Error-triggered full session video replay | Partial | Partial | Partial | ||
2G / 3G / 4G network-condition simulation | Partial | Partial | |||
Flat per-monitor pricing — no per-host or data-ingest fees | Per-GB ingest | Per-host | Consumption | Plan-based | |
White-label / MSP reseller reporting | |||||
Multi-step transaction recorder | |||||
Private agent for internal apps | |||||
Free trial, no credit card to start | 30 days | Free tier | 14 days | 15 days | 30 days |
Dedicated monitoring vendor since the 1990s | 1998 | 2008 | 2010 | 2005 | 2006 |
Built for the People Who Get Paged
How Each Role Uses Dotcom-Monitor in Practice
DevOps & SRE
Gate Every Deploy on a Synthetic Check
Wire UserView monitors into your deploy pipeline. After every production release, run a full-funnel synthetic check before promoting traffic. Route failures to PagerDuty with severity tied to which step broke. Track error budgets with SLA reports instead of spreadsheets.
QA Engineers
Reuse the Tests You Already Wrote
Import Postman or Insomnia collections directly into WebView. Record UI flows once with EveryStep and reuse them across staging, UAT, and production. Compare baselines across releases to catch regressions before manual QA does.
Network Administrators
Catch the Protocols That Quietly Break Apps
ServerView covers DNS, SSL/TLS certs, BGP routing changes (via traceroute), SMTP, FTP, VoIP/SIP, and WebSocket. Alert on certificate expiry far enough ahead to actually rotate. Run traceroute monitors from multiple regions to spot ISP-level routing changes.
Software Developers
Catch the Bug Before the Ticket
BrowserView’s element-level waterfalls show which resource — yours or a third party’s — slowed the page. Error videos and console logs from real browsers let you reproduce client-side bugs without asking a customer for steps.
Integrations
Fits the Stack Your Team Already Runs
Alerts, dashboards, and data flow into the tools your team already uses.
Incident Response & On-Call
Route different monitors to different escalation chains, suppress alerts during maintenance windows, and acknowledge from the chat client.
- PagerDuty
- Slack
- Microsoft Teams
- Opsgenie
- Email / SMS / Voice
Ticketing, Dev Tools & CI/CD
Tie performance regressions to commits and turn failures into tickets automatically. Trigger post-deploy checks from your pipeline.
- JIRA
- ServiceNow
- GitHub
- GitLab
- Jenkins
- CircleCI
Custom API & Webhooks
The Dotcom-Monitor REST API provisions monitors, pulls historical data, manages configs, and triggers on-demand checks — for status pages, exec dashboards, or chatbots.
- REST API
- Webhooks
FAQ
Frequently Asked Questions
If your question isn’t here, contact us — a real engineer will answer.
How is synthetic APM different from real user monitoring (RUM)?
Synthetic APM runs scripted transactions on a schedule from controlled monitoring locations — proactive, deterministic, and useful for catching regressions before users do. RUM captures real production sessions — reactive, useful for understanding actual user behavior. Most teams use both; Dotcom-Monitor specializes in synthetic and integrates with RUM tools.
Does Dotcom-Monitor require an agent or code instrumentation?
No. Dotcom-Monitor runs from outside your application. There’s nothing to install in your code, no SDK to maintain, and no agent to deploy on your servers. For monitoring internal apps behind a firewall, you can optionally deploy a Private Agent inside your network — it’s a single binary, not application instrumentation.
How fast is the setup process?
Most monitors are running within minutes. Record a UserView script with EveryStep, import a Postman collection into WebView, or paste a URL into BrowserView. No agent rollout, no config-file editing, no waiting on platform-team approval.
Can Dotcom-Monitor monitor third-party SaaS apps?
Yes — that’s one of the strongest use cases. Because monitoring runs from outside, anything reachable by URL can be monitored: third-party CRMs, billing systems, identity providers, partner APIs, and vendor dashboards. You don’t need vendor cooperation.
What types of alerts and integrations does Dotcom-Monitor support?
Email, SMS, voice call, PagerDuty, Slack, Microsoft Teams, Opsgenie, JIRA, ServiceNow, GitHub, Jenkins, and webhook destinations. Alert conditions can require N consecutive failures, M-of-N location failures, or specific error types. Escalation chains and quiet hours are configurable per monitor or per team.
How does APM help reduce MTTR?
By telling you exactly where the failure happened. A failed UserView run gives you the broken step, the screenshot, the video, the console log, and the waterfall — evidence captured at the moment of failure instead of reconstructed later. That’s what lets teams resolve customer-facing issues faster than reconstructing an incident after the fact.
Can Dotcom-Monitor monitor containerized or Kubernetes-based apps?
Yes. Because monitoring is outside-in, the runtime of your app doesn’t matter. Whether the workload runs on bare metal, VMs, Docker, Kubernetes, ECS, Cloud Run, or serverless, Dotcom-Monitor checks the public (or Private-Agent-reachable) endpoints exactly the same way.
Is there a free trial? Do I need a credit card?
A 30-day free trial with full feature access. No credit card required to start.
How does pricing work?
Pricing is based on monitor count, check frequency, and platform mix — not per-host or per-seat, and with no surprise charges for ingest volume. See the pricing page for current plans or contact sales for a custom quote.
Can MSPs and agencies use Dotcom-Monitor under their own brand?
Yes. White-label reports, custom branding, multi-tenant account management, and reseller programs are available for MSPs, VARs, and agencies managing monitoring for end customers.
Start Monitoring What Your Users Actually See
Set up your first monitor in under five minutes. No credit card. No sales call required to start.
- All four platforms included
- Cancel anytime
- No auto-charge after trial