- API Monitoring
- REST · SOAP · GraphQL · Postman
API Monitoring Software That Catches Failing APIs Before They Break Your Product
Dotcom-Monitor is API monitoring software that runs synthetic checks against every API your team depends on — REST, SOAP, GraphQL, Postman, and Insomnia collections — from 30+ global locations. Chains multi-step workflows, validates every payload, and pages the right people the moment something breaks.

- No credit card required
- All features included
- Live in under 5 minutes
- Cancel anytime · No auto-charge after trial
Choose your protocol or tool
Pick the API Surface You Need to Monitor
Each protocol has its own deep-dive page with setup guides, code samples, and use cases. Or just start a trial and we’ll auto-detect what you’re running.
REST
- Most common
REST API Monitoring
JSON validation, schema assertions, multi-step chaining, OAuth/JWT. The workhorse spoke for any team running HTTP REST APIs.
SOAP
- Enterprise & legacy
SOAP API Monitoring
WSDL import, XPath validation, SOAP 1.1/1.2 support, WS-Security. Built for enterprise, financial, and healthcare APIs.
GQL
- Modern
GraphQL API Monitoring
Query-aware monitoring. Inspects the errors array and response data, since GraphQL returns 200 even on failure.
POSTMAN
- Import collections
Postman Collection Monitoring
Import Postman Collection v2.0/v2.1 JSON directly. Turn the API tests your team already maintains into 24/7 production monitors.
INSOMNIA
- Import collections
Insomnia Collection Monitoring
Import Insomnia v4 exports with full request details, environment variables, and auth configs preserved.
Looking for OAuth, JWT, mTLS, or other auth schemes? Every protocol above supports them — see the full auth matrix →
External references: learn more about REST, SOAP, GraphQL, and the API pattern itself.
Why teams pick us
API Monitoring Built for Engineers Who Answer Pages
Six things teams tell us they couldn’t do as cleanly with Datadog, Pingdom, Uptrends, or Postman Monitors.
30+ Global Locations
Run distributed checks from North America, Europe, Asia-Pacific, and South America. Catch the regional CDN issue, the DNS propagation gap, the geo-routing fault.
99.99% Uptime Sla
Contractual uptime backed by 25+ years of monitoring infrastructure. Your monitoring tool itself never becomes the single point of failure.
Multi-Step Transactions
Chain login → fetch → mutate → confirm into one monitor. Pass tokens between steps, abort on first error, capture step-level logs.
Native PagerDuty, Slack, Teams
Route alerts directly into your incident tools — with diagnostic context, response payloads, and trace IDs in the first notification.
Private Agents (Behind Firewall)
Drop a lightweight agent inside your VPC to monitor internal microservices. Outbound connection only — no inbound firewall rules.
CI/CD & Monitors-As-Code
Trigger monitor runs from GitHub Actions, Jenkins, Azure DevOps. Gate releases on assertion results, latency, or availability.
Multi-step monitoring
Validate Real Workflows, Not Just Isolated Endpoints
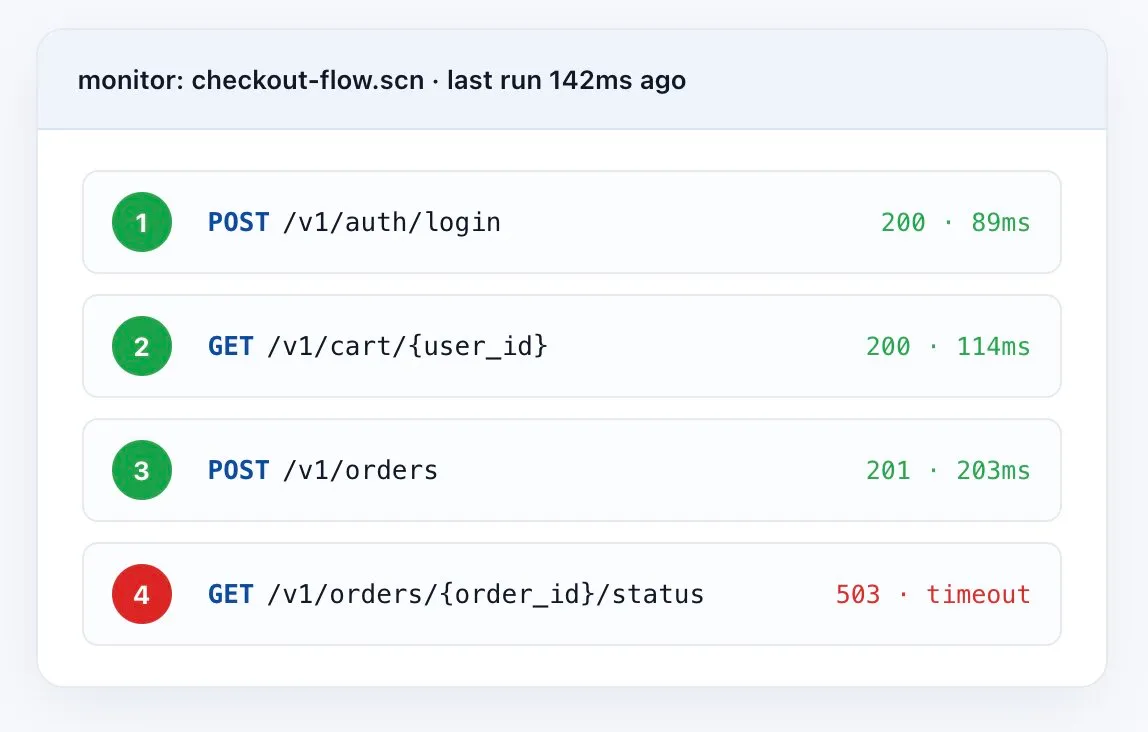
A working /health check doesn’t prove your business logic still works. Chain real sequences — auth → fetch → mutate → verify — and validate every step. The moment the chain breaks, you know exactly where, why, and what the response looked like.
- Pass variables between calls — tokens, IDs, and dynamic values flow automatically.
- Per-step assertions — status, headers, schema, payload contents on each request.
- Abort on first error — full per-step request/response logs captured.
- Works across protocols — REST, SOAP, GraphQL, mixed chains.
Authentication
Every Auth Scheme Your APIs Actually Use
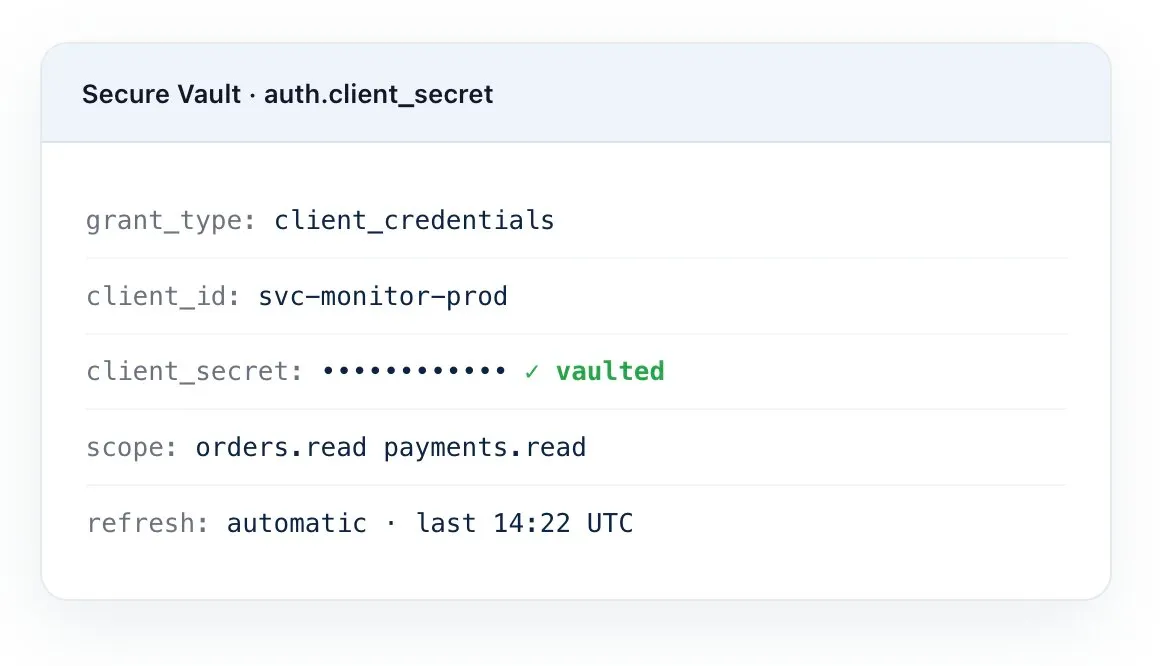
Production APIs don’t live behind one auth method. Dotcom-Monitor natively supports the full spread — and masks every secret in Secure Vault, so credentials never leak into logs or exported scripts.
- OAuth 2.0 — Client Credentials, Authorization Code, Refresh Token flows.
- JWT with automatic refresh, plus API Key, Basic, and Bearer Token.
- Enterprise: NTLM, Kerberos, mTLS (Client Certificate), AWS Signature v4.
- Custom headers for any proprietary auth scheme.
Global monitoring network
Checks That Run Where Your Users Live
Dotcom-Monitor operates its own monitoring infrastructure across 30+ locations on six continents — plus Private Agents you can deploy inside your VPC, behind firewalls, or on-prem to monitor internal microservices.
That means you catch the regional outage, the DNS propagation gap, the CDN misroute — not just the global ones.
30+
Global locations
6
Continents covered
1 min
Minimum check interval
Private Agents
For behind-firewall

Getting started
From Signup to First Alert in Under Five Minutes
1
Define Endpoints & Assertions
Configure REST, SOAP, or GraphQL endpoints, headers, JSONPath/XPath assertions, and auth. Or import a Postman or Insomnia collection directly.
2
Schedule Synthetic Checks
Run checks at 1-, 3-, 5-, or 15-minute intervals from 30+ global locations across North America, Europe, Asia-Pacific, and South America.
3
Track Uptime & Performance
Track availability %, P95/P99 response times, TTFB, DNS time, and error rates by HTTP status code across every monitored endpoint.
4
Receive Real-Time Alerts
Get alerted via email, SMS, Slack, PagerDuty, or Teams within seconds — with response time, status code, and validation failures attached.
Why it matters
The Hidden Cost of API Downtime
APIs power payments, authentication, inventory, financial transactions, and SaaS integrations. When they fail — even briefly — the impact is immediate.
Mttr Impact
Mean Time to Resolution
Without proactive monitoring, teams rely on customer reports to detect failures — adding 30–60 minutes to detection alone. Continuous synthetic monitoring shortens detection to under 60 seconds, enabling faster root-cause isolation.
Sla & Compliance Exposure
Contractual & regulatory risk
For B2B SaaS, FinTech, and healthcare, API downtime triggers SLA penalties, compliance violations, and audit findings. Documented uptime evidence is what defends SLA adherence in renewal conversations.
Revenue-Per-Minute Exposure
Direct financial impact
An e-commerce platform processing 100 orders/min at $50/order loses $25,000 per 5-minute outage. A failed checkout, payment authorization, or auth call halts conversion immediately.
Third-Party API Blind Spots
Vendor accountability
Modern apps depend on Stripe, Auth0, Okta, Twilio. Even when your infrastructure is healthy, a degraded upstream can break checkout, login, and data sync. Monitor third-party endpoints to isolate fault origins.
Not ready for a trial?
Want a 15-Minute Walkthrough First?
A performance engineer will show you how to set up your first monitor in your environment — no sales pitch, just a working monitor by the end of the call. Direct calendar booking, no gatekeeping.
Compared to alternatives
Where API Monitoring Tools Win and Lose
A reference for buyers weighing options. We try to be fair — every tool has a job; this is where we fit.
Capability | Dotcom-Monitor | Postman Monitors | Pingdom / Uptime-only | Datadog Synthetics |
|---|---|---|---|---|
Multi-step API chains with variable passing | Full | Partial | ||
JSON / XML / XPath payload assertions | Limited | |||
OAuth 2.0 + JWT auto-refresh | Manual | Limited | ||
SOAP / WSDL / WS-Security | Partial | |||
Private Agents (behind firewall) | ||||
30+ global monitoring locations | Limited | |||
Import Postman / Insomnia collections | (Postman) | |||
CI/CD gate-blocking via API | Partial | |||
Free trial | 30 days, full features | Paid plans | 14 days | 14 days |
- Multi-step depth Postman Monitors can’t match
- Payload validation Pingdom can’t match
- Datadog-tier capability at a fraction of the cost
In production
What Teams Catch With Us They Couldn’t Catch Before
- E-commerce
Malcolm Group
Built a full checkout-flow monitor with EveryStep Recorder that runs every 15 minutes — adds items, applies coupons, validates pricing, submits with a declined card to test payment logic end-to-end.
- Alerts now point at the broken component (cart, coupon, payment, batch) — not just "site down"
- Catches issues that uptime checks miss because the site appears up
- Nightly batch-submission monitor runs every 3 hours, catching backend regressions
- Global retail
LuckyVitamin
Millions of monthly visitors across 50+ countries. Implemented Dotcom-Monitor synthetic + performance testing to safeguard checkout under peak load.
- Real-time alerts and trend analytics uncovered hidden bottlenecks
- Saved hundreds of engineering hours, protected revenue during 3–4× peak demand
- Scaled monitoring confidence as international footprint grew
What customers say
The Teams Running Production APIs Say It Best
"I absolutely love the comprehensive monitoring services Dotcom-Monitor provides. The real-time alerts and detailed performance analytics have been a game-changer for our website's uptime and speed. The global monitoring feature ensures that our site is optimized everywhere, and the intuitive dashboard makes it easy to track performance. Their customer support is exceptional — always responsive and efficient."
Tomer C.
Managing Director · Facilities Services
Verified Capterra review · March 2025
"One of Dotcom's best features is the push/pull API capabilities that provide us with network performance data. We use this to monitor for performance issues as well as page loading stats. Dotcom-Monitor allows us to monitor multiple services within one interface and platform. It's allowed us to operate more efficiently."
Gregory S.
Manager · Broadcast Media
Verified Capterra review · May 2020
"I have been thoroughly impressed with the level of detail and comprehensiveness of the reports generated by the software. Moreover, the support team at Dotcom-Monitor has exceeded my expectations. On almost a daily basis, I reach out with various questions and they have consistently demonstrated unwavering patience, providing detailed and insightful answers."
Shirin R.
Software Test Engineer · Computer Software
Verified Capterra review · February 2023
"I'm a network analyst and use Dotcom tools inside the ISP I work, it's a really good and reliable tool for monitoring things along the network, and testing network components, I usually use it to make diagnostics of servers latency, and dns resolve time."
Leonardo J.
IT & Network Infrastructure Analyst Internet
Verified Capterra review · October 2022
4.5
Capterra
80 reviews
4.6
Ease of Use
Capterra Score reviews
4.6
Customer Service
Capterra Score reviews
All reviews sourced from Capterra verified reviews. Ratings as of January 2026.
Pricing
Start Free. Scale as Your APIs Grow.
Every plan includes REST API monitoring, synthetic checks, multi-step transactions, and uptime reporting. No hidden fees.
Free
Free Forever
$0
- Up to 25 Targets
- Up to 5 min Monitoring Frequency
- 2 Global Locations
- 7 Days Data Retention
- Email Alerts
- Public Dashboards
Most popular
Subscriptions
Starting at
$19
.99 /mo
- Up to 100 Targets
- Up to 1 min Monitoring Frequency
- 25 Global Locations
- 1 Year Data Retention
- 20+ Alert Integrations
- Private Agents & API Config
Enterprise
Custom Pricing
Let’s talk
- Unlimited Targets
- Up to 1 min Monitoring Frequency
- 30+ Global Locations
- 3 Years Data Retention
- 24/7 Priority Support
- SSO, MFA & PO Billing
By industry
API Monitoring Across Every Industry That Depends on Uptime
Monitor internal and third-party API dependencies to keep integrations returning correct data on time. Detect partner-API degradation before it cascades.
Track payment gateways (Stripe, PayPal), inventory systems, and shipping endpoints. A 5-min outage at checkout can cost tens of thousands during peak.
FinTech
Ensure financial APIs meet regulatory security and sub-second latency. Monitor transaction processing, KYC, and banking integrations to avoid failed transactions.
Healthcare
Monitor EHR APIs, insurance portals, and telemedicine platforms. Keep HIPAA-compliant data exchange endpoints available and responsive.
Enterprise IT
Validate cross-department API integrations — CRM, ERP, HR, communications. Detect cross-system failures before they disrupt internal workflows.
Media & Broadcast
Monitor content delivery APIs, streaming endpoints, and rights-management services. Validate that downstream consumers see correct data globally.
API Monitoring Features
Seven things every team running production APIs should do — independent of which tool they pick.
01
Monitor From Multiple Geographic Locations
A single location can’t detect regional DNS failures, CDN misconfigurations, or geo-routing issues. Use at least 5 distributed locations.
02
Validate Payloads — Not Just Status Codes
An HTTP 200 doesn’t guarantee correctness. Use JSONPath or XPath assertions to verify response bodies have the expected structure and content.
03
Set Baseline-Derived Alert Thresholds
Static thresholds trigger false positives. Establish per-endpoint baselines, then alert at 2× the P95 response time.
04
Monitor Authentication Flows End-To-End
Token expiration, OAuth refresh failures, and cert rotation are common causes of outages. Include auth steps so credential issues get caught early.
05
Test Multi-Step Transactions
A single endpoint may pass while the full transaction fails. Multi-step monitors catch session, sequencing, and data-dependency failures.
06
Monitor Third-Party Dependencies Separately
Payment gateways, identity providers, and shipping APIs degrade independently. Dedicated monitors isolate whether failures are internal or external.
07
Include API Monitoring in CI/CD
Run post-deploy synthetic checks. Automated smoke tests catch schema changes, missing fields, and regressions before they reach users.
Frequently asked questions
Answers DevOps Teams Want Before They Sign Up
What is API monitoring?
API monitoring is the continuous, automated practice of validating API endpoints for availability, response time, and data correctness from outside your infrastructure. Unlike one-off tests, monitoring runs 24/7 from multiple global locations on a fixed cadence — and alerts you the second any of those break.
What authentication methods are supported?
API Key, Basic Auth, OAuth 2.0 (Client Credentials, Authorization Code, Refresh Token), JWT with automatic refresh, Bearer Token, AWS Signature v4, NTLM, Kerberos, mTLS, and custom headers. Secrets are masked through the Secure Vault.
Can I chain multiple API calls into a single monitor?
Yes. Multi-step monitors pass tokens, IDs, and dynamic values between steps, validate each step independently, and abort the chain at the first failure with full per-step request/response logs.
Can I monitor APIs behind a firewall?
Yes. Deploy lightweight Private Agents inside your network — they initiate outbound connections, so no inbound firewall rules are required.
How is this different from uptime-only monitoring?
Uptime tools mark you green when a 200 comes back. We validate the actual response — JSON schema, headers, payload contents, latency percentiles, downstream chain success — so partial failures (the 200-but-broken kind) get caught.
How does API monitoring differ from APM?
API monitoring tests from outside (the user’s perspective). APM tracks internal behavior — code, database, server. Mature teams run both: synthetic for customer-facing checks, APM for root-cause debugging.
Can I integrate API monitoring into a CI/CD pipeline?
Yes. Trigger monitor runs via API from GitHub Actions, Jenkins, Azure DevOps. Gate the deploy on availability, latency, or assertion results to stop bad builds from reaching production.
How often can checks run?
As often as every minute per endpoint. We recommend 1-minute intervals for critical paths (login, checkout, payment) and 5- or 15-minute intervals for lower-priority endpoints.
What metrics matter most?
Availability % (target 99.9%+), response time (P95/P99), error rate (4xx + 5xx), TTFB, DNS resolution time, SSL handshake time, and throughput. Plus payload validation — the metric uptime tools miss entirely.
How often should I monitor a production API?
For revenue-impacting APIs (login, payment, checkout), every minute. For less critical endpoints, every 5 or 15 minutes is fine. The right cadence balances detection time against check-volume cost.
What is the difference between API monitoring and API testing?
Testing happens in development and CI to verify endpoints behave correctly before release. Monitoring runs continuously in production, tracking real-world availability, latency, and response accuracy over time. Testing catches bugs before deploy; monitoring catches failures, regressions, and degradation after deploy.
Does API monitoring replace APM?
No. API monitoring tests from outside (the user perspective). APM tracks internal behavior — code execution, database queries, server resources. Mature teams run both: synthetic for customer-facing checks, APM for root-cause debugging.
What is TTFB and why does it matter for APIs?
Time to First Byte measures the elapsed time from sending a request to receiving the first byte of response. From a synthetic client this includes DNS, TCP, TLS, and server processing — but not the time to transfer the body. High response time with low TTFB points to a large payload; high TTFB points to slow server processing.
How many monitoring locations do I need?
For global apps, at least 5 distributed locations covering your primary user regions. Typical baseline: North America East, North America West, Western Europe, Asia-Pacific, South America. This catches regional CDN issues, DNS propagation gaps, and geo-routing anomalies that single-location monitoring misses entirely.
Catch the Next API Outage Before Your Users Do
30-day free trial. No credit card. Full platform access. Live in under five minutes.
- 10,000+ organizations
- Monitoring leader since 1998
- 99.99% Uptime SLA