Organizations Worldwide
Platform Uptime SLA
Global Monitoring Locations
Website Monitoring Leader
White-Label Monitoring at a Glance
What it does
Replace Dotcom-Monitor branding with your own across every customer-facing surface.
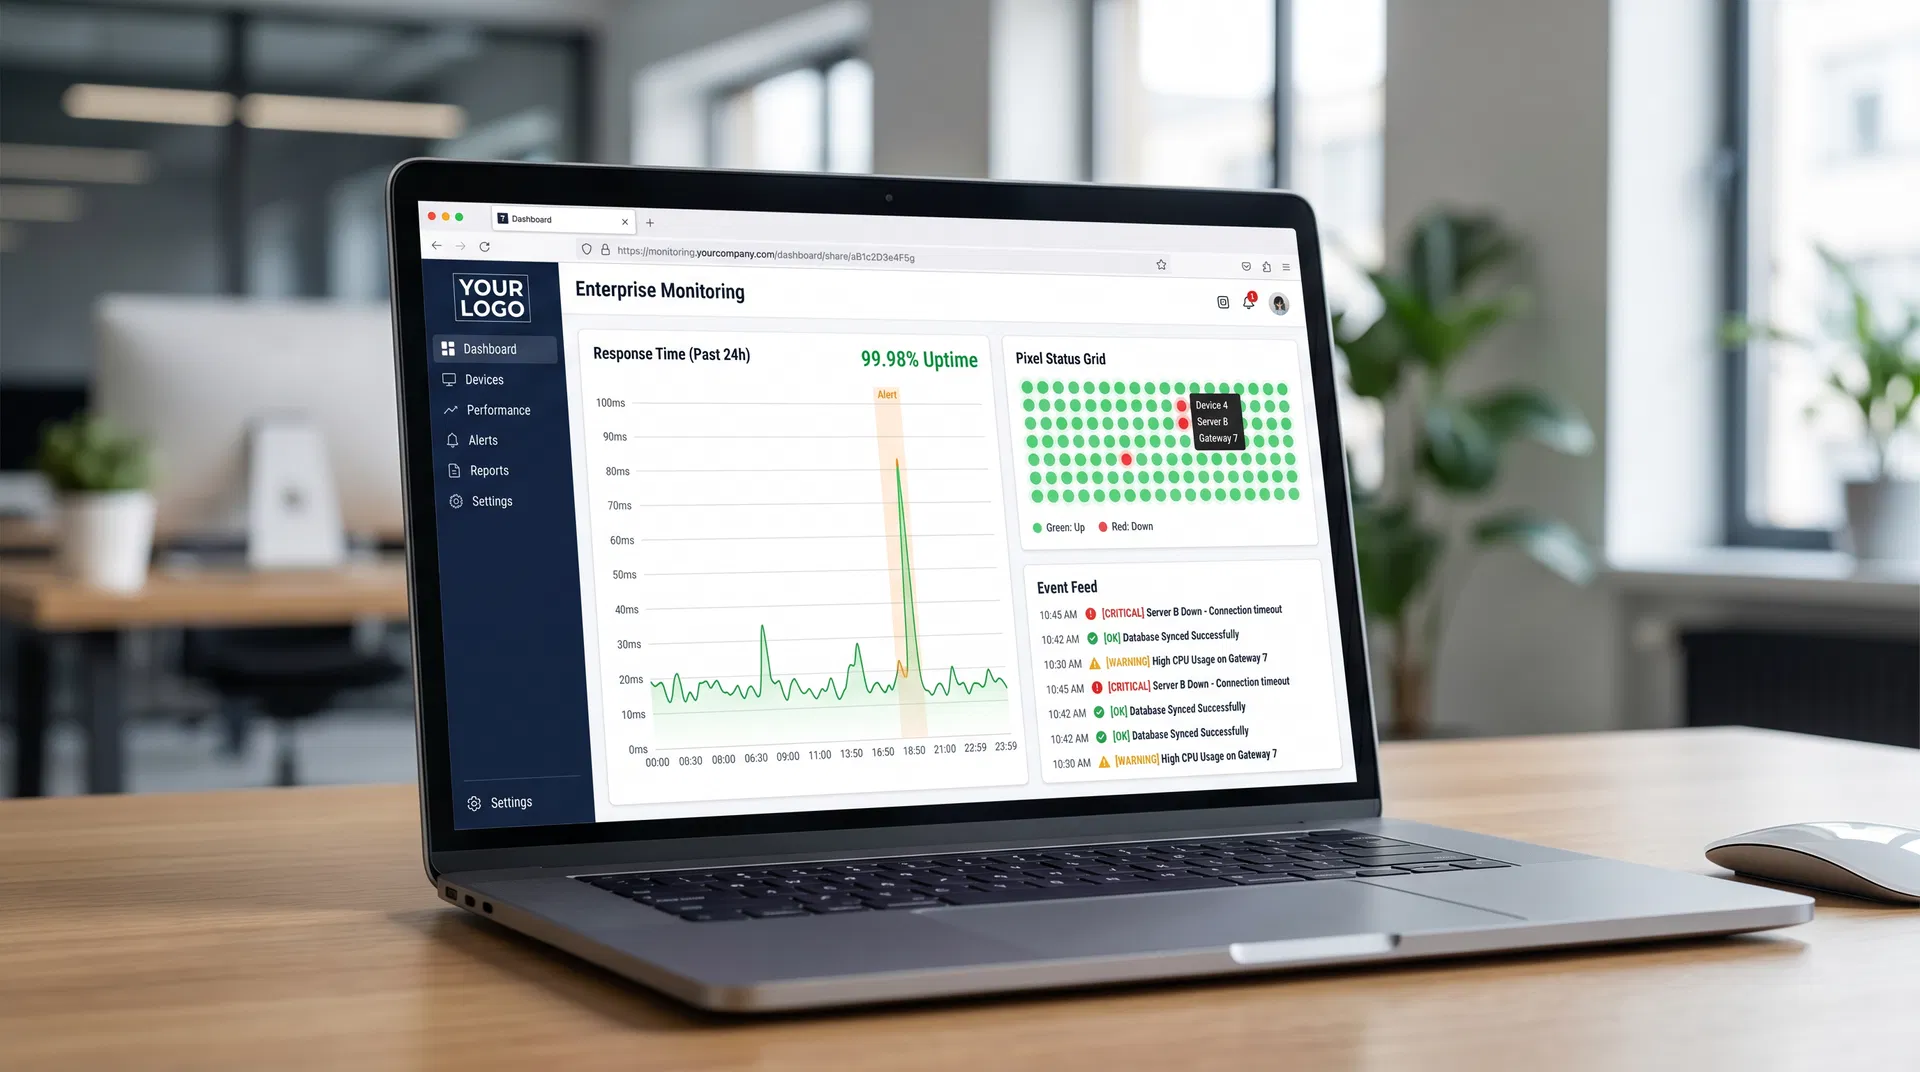
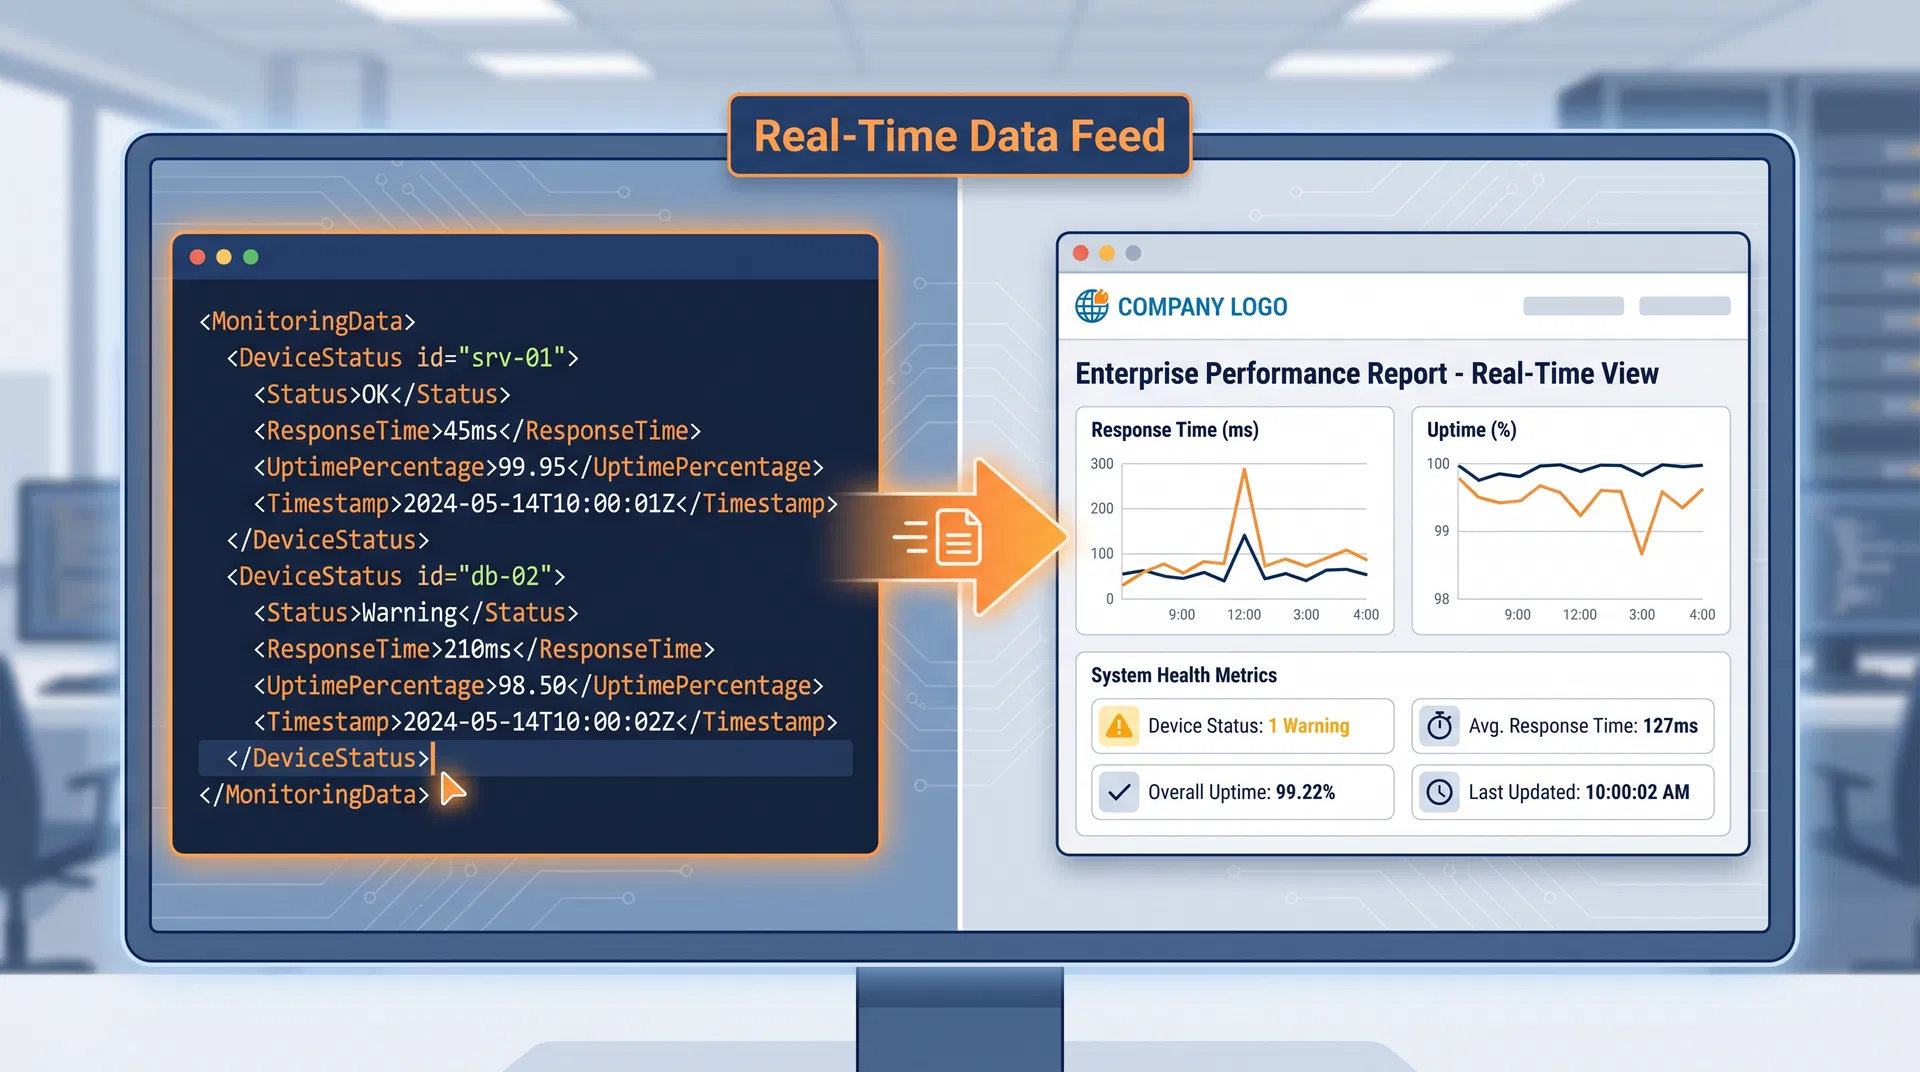
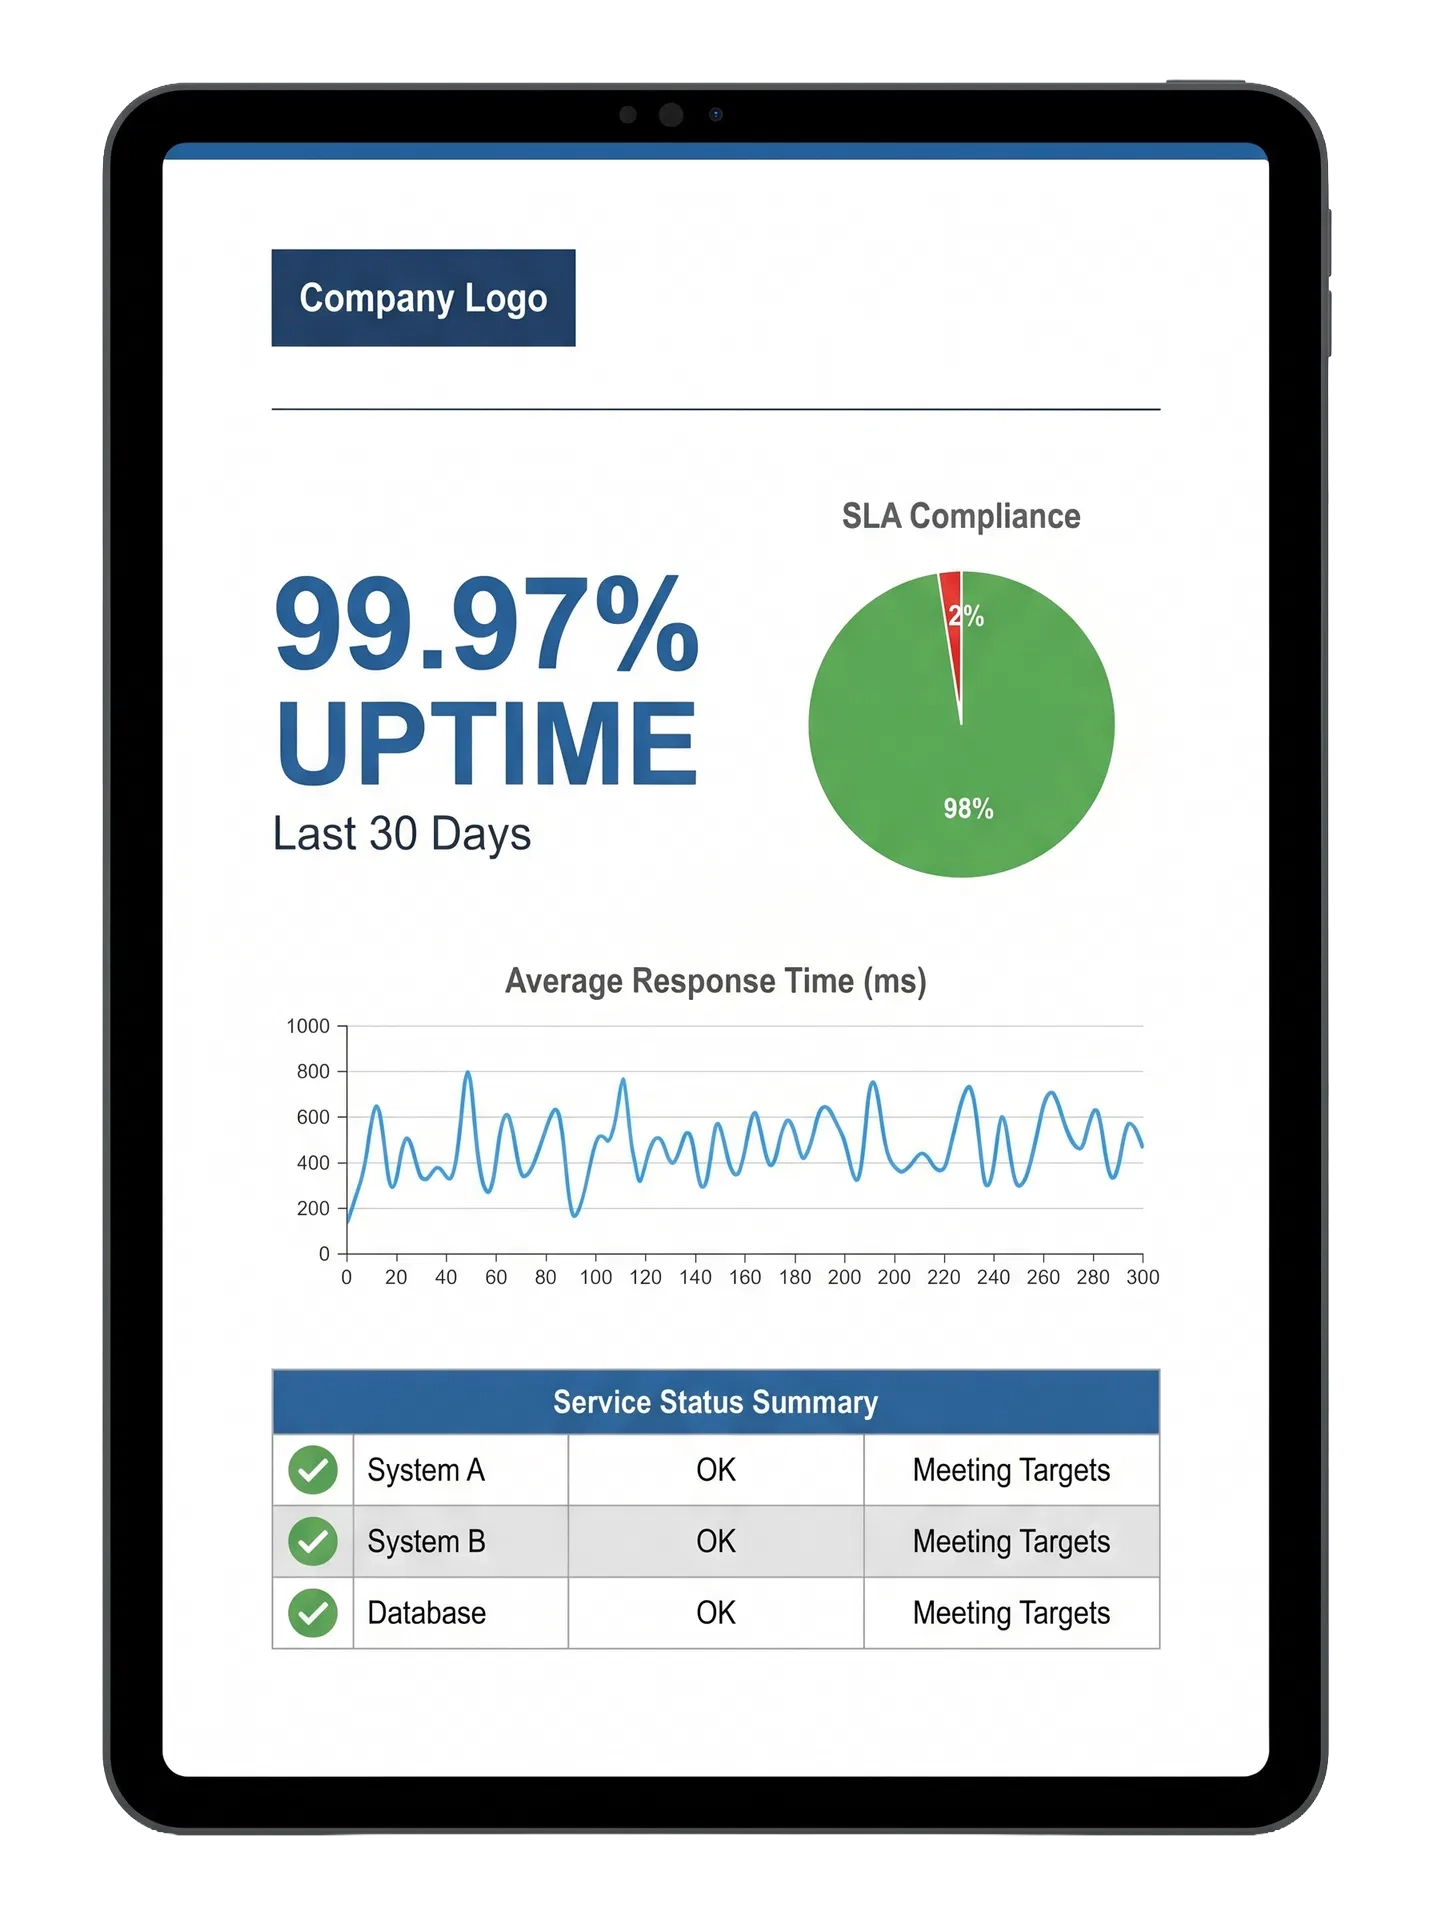
Three surfaces
PDF reports, real-time Shareable Pane dashboards, and the XML data feed for custom-built tools.
Who it's for
MSPs, digital agencies, resellers, and internal IT teams reporting to executives or clients.
How to enable
Upload your logo once in account settings — applied to all future reports automatically.
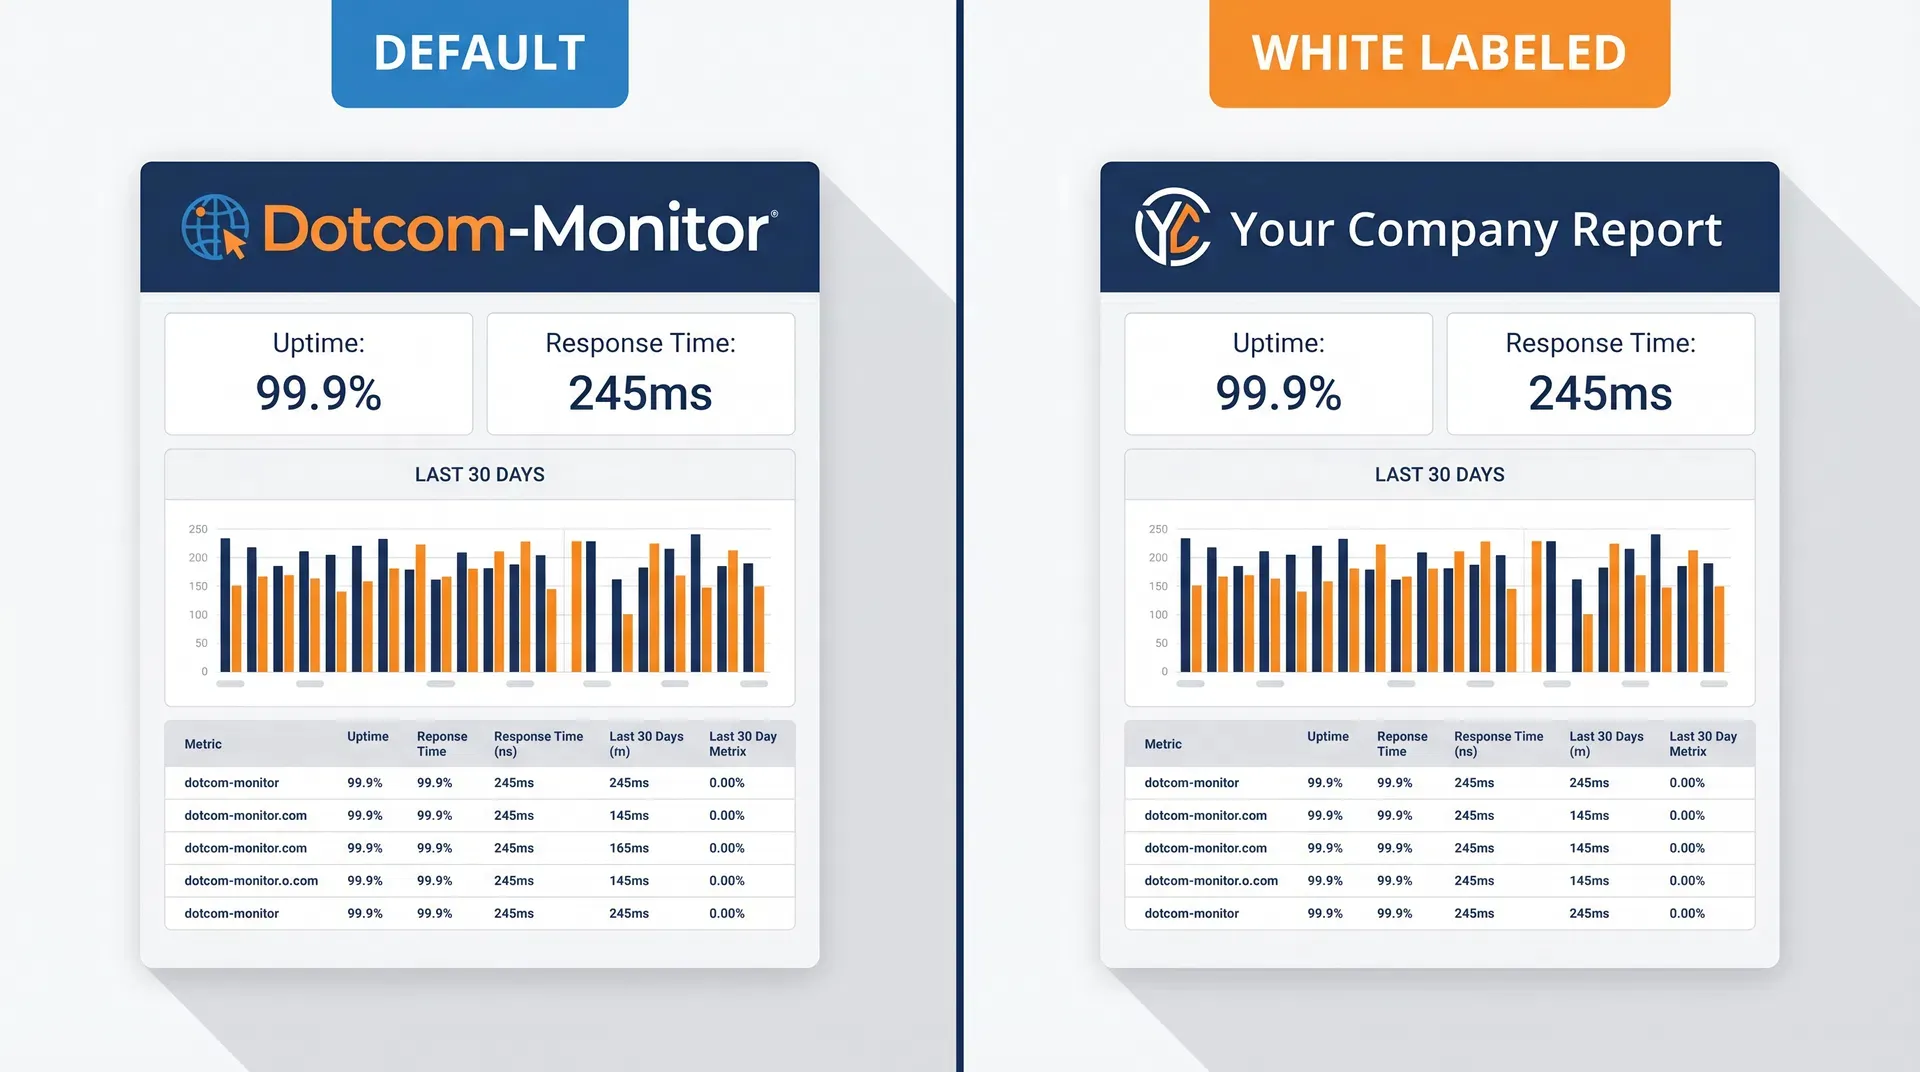
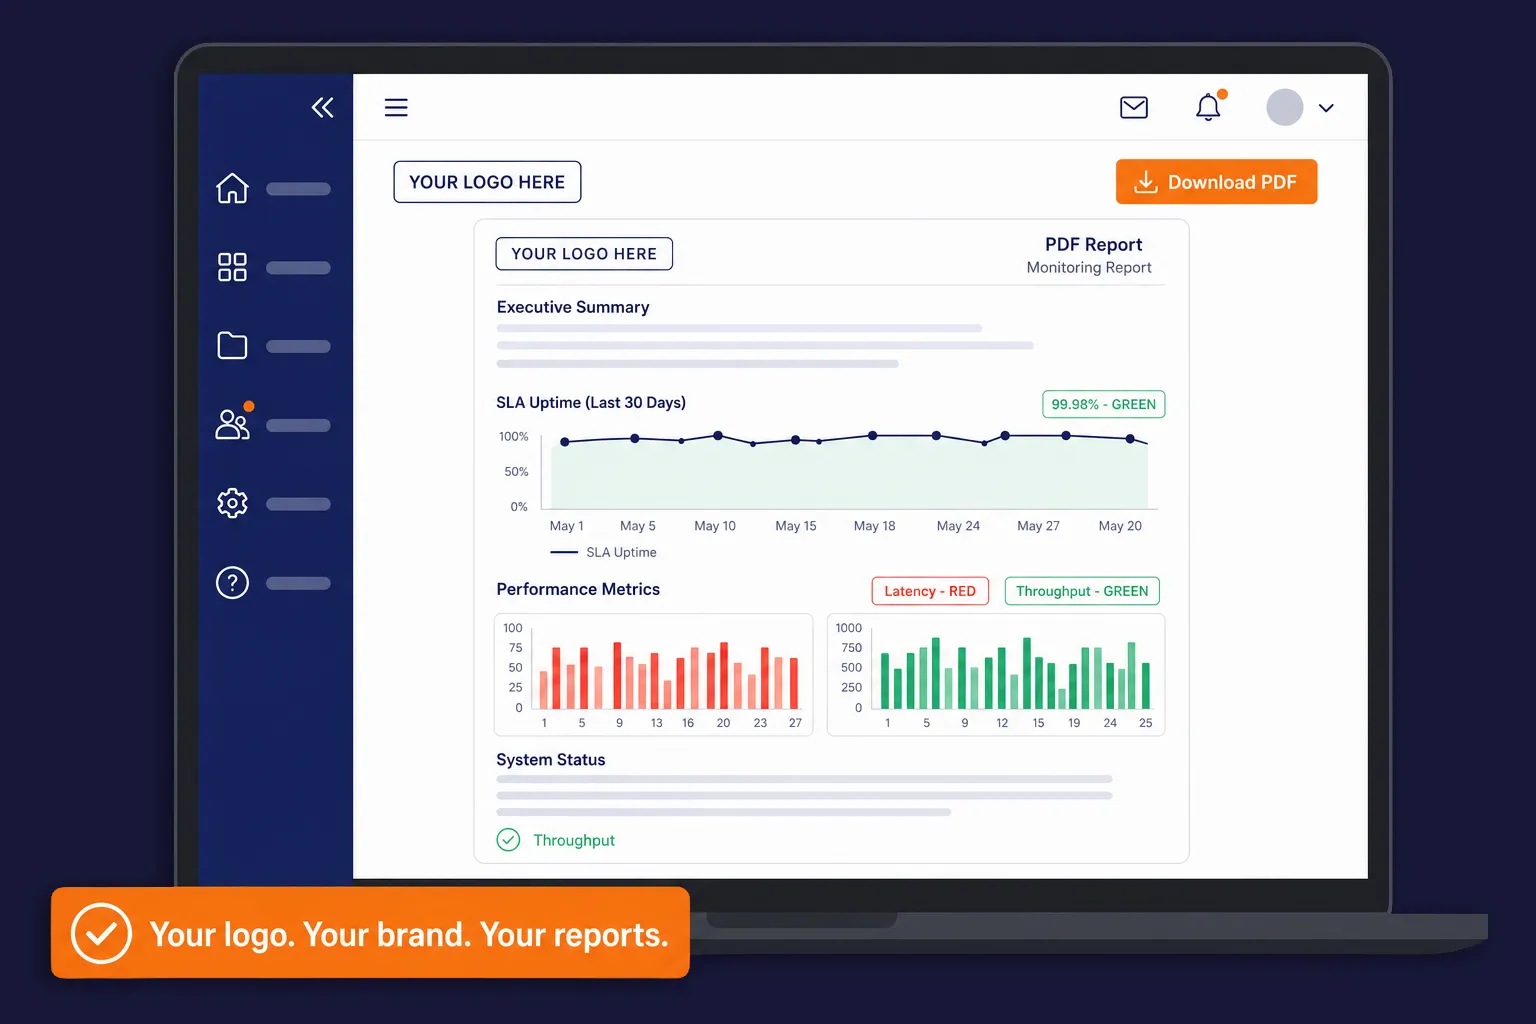
Your Brand on Every Report — Not Ours
White-labeling allows you to brand selected Dotcom-Monitor reports with your own company identity, making them suitable for client-facing, executive, or compliance reporting. When white-labeling is configured, your company logo is displayed in the report instead of Dotcom-Monitor branding — giving your clients a seamless, professional experience that reinforces your own brand authority.