





Organizations Worldwide
Platform Uptime SLA
Global Monitoring Locations
Website Monitoring Leader
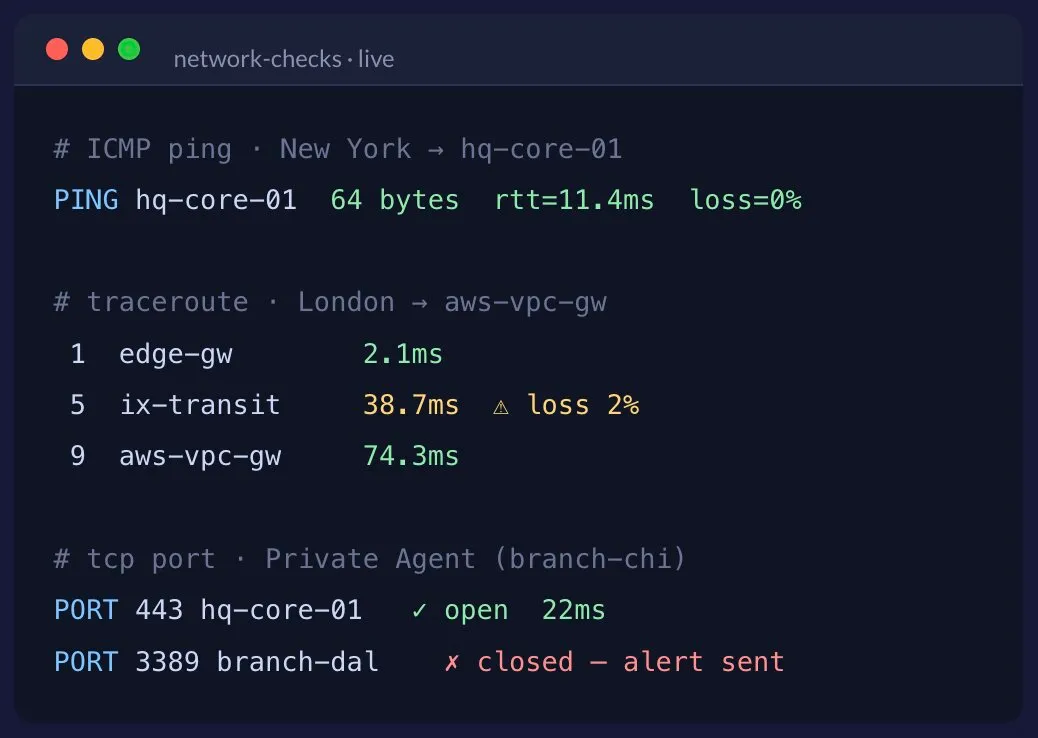
Network monitoring is the continuous, automated testing of hosts, servers, devices and the paths between them to confirm they are reachable, fast and routing correctly. It combines Ping (ICMP) for reachability and latency, Traceroute for hop-by-hop path analysis, and TCP Port checks for service availability — run from global locations and from inside the network — so outages, packet loss and latency drift are caught before users report them.
In practice, network monitoring answers three questions on a schedule: Is the host up? Is the path healthy? And is the service actually listening? Modern network performance monitoring goes beyond a simple up/down ping to track latency, jitter, packet loss and connectivity trends over time, alerting on brownouts as well as hard outages.
Dotcom-Monitor is a cloud-based network monitoring software and service that answers all three questions with three complementary checks — ICMP Ping for reachability and latency, Traceroute for path analysis, and TCP Port/Telnet checks for service availability. Every check runs from 30+ global locations to see the world’s view of your network, and from Private Agents inside your own environment to see the internal view — including inside-to-outside connectivity and links between branch offices.
Networks are on the critical path for everything — websites, applications, APIs, remote work and branch connectivity — and they fail silently. A link can stay “up” in the dashboard while dropping packets, a route can shift to a slower path, or a service port can close while the host still answers a ping. Without continuous network monitoring, these problems are only discovered when users complain. Synthetic checks surface tunnel drops, latency regressions, packet loss and unreachable services in seconds, so teams cut mean time to detection and protect SLAs.
ICMP Ping monitoring and TCP port checks confirm hosts and services are up and answering across every location.
Track round-trip latency, jitter and packet loss over time and alert on statistical drift — network performance monitoring, not just up/down.
Visual Traceroute exposes every hop so you see exactly where congestion, loss or a route change enters the path.
Private Agents monitor internal-only hosts and validate connectivity between branch offices and different networks.
Distributed, agentless checks from 30+ locations show what real users and upstream providers experience — a modern alternative to appliance-only NPM.
Extend the same platform to DNS, VPN tunnels, SIP monitoring and uptime for full-stack coverage.
Each check answers a different question about your network. Run them side by side and you get a complete picture: reachability, routing, and service availability, from wherever you need to test.
Confirm a host is alive and measure round-trip latency and packet loss on every check. The fastest way to know a server, router or gateway has dropped.
Map every hop between the test point and the target with a Visual Traceroute — 30-hop, color-coded, map-based — to pinpoint exactly where latency or loss enters the path.
Verify a specific service is accepting connections — port 443, 25, 3389, a database port, or any TCP service. Reachable isn’t enough; the port has to answer.
Check | Answers | Key signals | Great for |
|---|---|---|---|
Ping (ICMP) | Is the host reachable? | Up/down, round-trip time, packet loss % | Servers, routers, gateways, firewalls, edge devices |
Traceroute | Where is the path breaking? | Hop-by-hop latency, failing node, route changes | ISP & peering issues, multi-cloud paths, VPN routes |
TCP Port / Telnet | Is the service listening? | Port open/closed, connect time, banner response | Web, mail, RDP, SSH, SQL, custom application ports |
Most tools can only see your network from the public internet. Dotcom-Monitor sees it from both sides, so nothing hides between the perimeter and the endpoint.
Run the same Ping, Traceroute or Port check from 30+ locations across six continents. See how reachability, latency and routing to your public-facing infrastructure differ by region — and detect location-specific outages the moment they appear.
Install a lightweight Windows or Linux agent inside a data center, office or branch. It runs the same network checks from behind your firewall and reports back over a single outbound HTTPS connection — no inbound ports opened, no VPN back into your network.
Need to watch VPN tunnels and the internal apps behind them too? See VPN Monitoring — the same Private Agent architecture, focused on site-to-site tunnels and client-VPN applications.
Deploy an agent at each branch and continuously Ping and Port-check the link to HQ or other sites. Flag the branch that silently drops connectivity at 3 AM before the store manager calls in.
Measure connectivity from inside your perimeter out to SaaS, cloud and upstream providers — surfacing ISP degradation and egress firewall issues an external-only check never sees.
Watch internal-only hosts, hypervisors, storage arrays, printers and IoT/edge devices that have no public address — Ping and Port checks from an agent on the same network.
Traceroute between on-prem, AWS, Azure and GCP to detect misconfigured routes, asymmetric paths and latency regressions across every leg of a hybrid network.
Confirm traffic actually traverses the intended firewall rule or VPN route with traceroute, and catch re-key drops or failovers that silently blackhole a path.
Track that RDP (3389), SSH (22), SMTP (25), SQL and custom application ports stay open across every location — with connect-time trends, not just up/down.
Point a check at any public host for global monitoring, or drop a Private Agent inside your network for the internal view. Either way, you’re minutes from continuous coverage — with no infrastructure to maintain.
Select one or more of the 30+ global locations for a public target, install a Private Agent for an internal one — or use both to compare inside and outside.
Add Ping, Traceroute and TCP Port tasks against each host. Set the frequency — as tight as one minute — and define latency and packet-loss thresholds.
Route failures to Slack, Teams, PagerDuty, email or SMS with escalation. Build NOC dashboards and schedule SLA reports for network leadership.
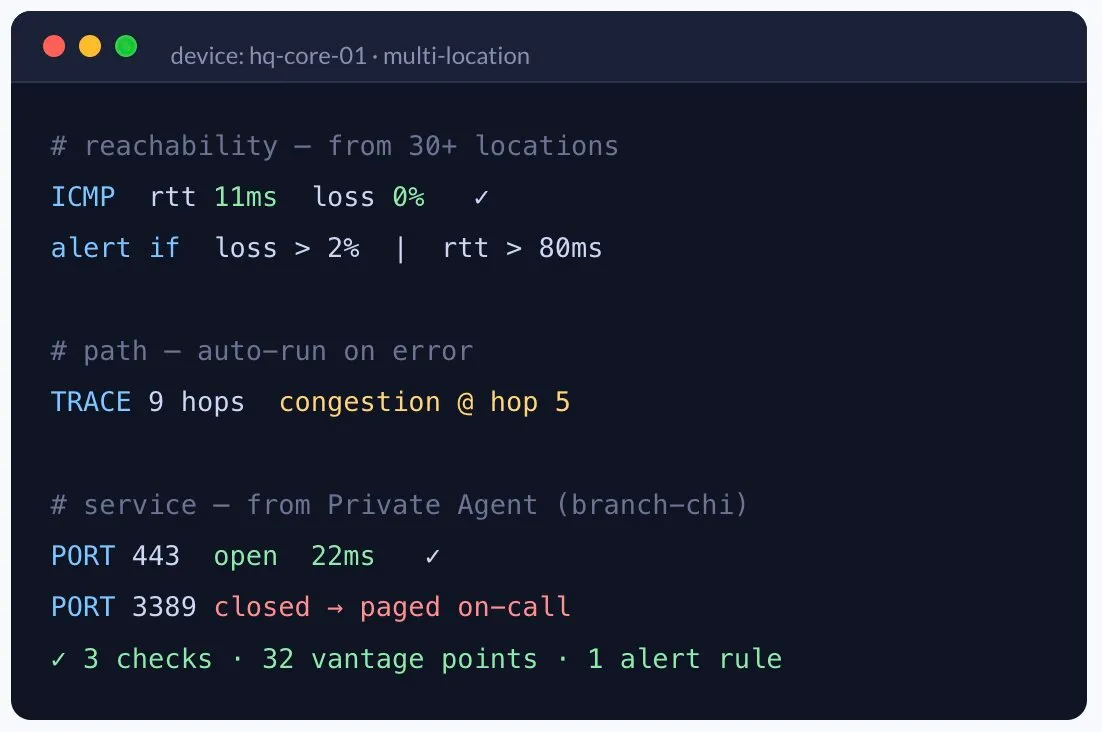
A single device gets a reachability check, a path check and a service check — and each can run from many locations at once. When something breaks, a traceroute fires automatically so you have hop-by-hop diagnostics waiting the moment you open the alert.
All three checks are part of the same ServerView infrastructure platform, so they share the same dashboards, alert groups and reports as the rest of your monitoring.
Ping, Traceroute and Port checks live in the same account as your website, API, DNS and infrastructure monitoring — one UI, one set of alerts, one reporting pipeline.
A single external ping will never tell you about these. Ping, Traceroute and Port checks — run from both the internet and inside your network — will.
Failure | What users experience | How Dotcom-Monitor detects it |
|---|---|---|
Branch link silently drops | A whole office loses access to HQ apps | Private Agent Ping/Port checks between sites fail within 60s |
Upstream ISP degradation | Everything feels slow from one region | Global-location latency spikes; traceroute shows the bad hop |
Route change / asymmetric path | Intermittent slowness, hard to reproduce | Traceroute path diff flags a new or flapping hop |
Service crashed, host still up | App down while the server still pings fine | TCP Port check reports the port closed even though ICMP is OK |
Egress firewall blocks outbound | Internal apps can’t reach a cloud dependency | Inside-to-outside agent check fails from behind the perimeter |
Packet loss without an outage | Calls drop, uploads stall — but “it’s up” | Ping loss % crosses threshold; alert fires on the brownout |
4.5
83 reviews
4.6
Capterra Score reviews
4.6
All reviews sourced from Capterra verified reviews. Ratings as of October 2026.
Network monitoring is the continuous, synthetic verification that hosts, servers, devices and network paths are reachable, responsive and routing correctly. Dotcom-Monitor does this with ICMP Ping checks for reachability and latency, Traceroute for hop-by-hop path analysis and packet loss, and TCP Port/Telnet checks for service availability. Checks run from 30+ global locations and from inside your own network using Private Agents.
Yes. Deploy a Private Agent — a lightweight Windows or Linux service — inside your network, data center or a branch office. It runs the same Ping, Traceroute and Port checks from the inside and streams results back over a single outbound HTTPS connection. No inbound firewall rules are required, so you can monitor internal-only hosts and validate inside-to-outside connectivity.
Install a Private Agent at each location and run Ping, Traceroute and TCP Port checks between them. You continuously verify the branch-to-HQ or site-to-site path is up, measure its latency and packet loss, and confirm the route actually traverses the intended link. If a branch silently loses connectivity, you’re alerted within a minute — before the site calls the help desk.
Ping (ICMP) confirms a host is reachable and measures round-trip latency and packet loss. Traceroute maps every hop between the monitoring point and the target, exposing where along the path latency or loss is introduced. TCP Port/Telnet monitoring goes a layer higher and confirms a specific service — such as port 443, 25, 3389 or a database port — is actually accepting connections. Together they answer: is the host up, is the path healthy, and is the service listening?
Yes. A Private Agent installed inside your network can Ping, Traceroute and Port-check external targets — SaaS endpoints, cloud services, upstream providers or the public internet — measuring exactly what your users and applications experience from inside the perimeter. This surfaces ISP degradation, upstream routing problems and egress firewall issues that an external-only check would miss.
Dotcom-Monitor operates 30+ monitoring locations across six continents, plus unlimited Private Agents you deploy inside your own environments. You can run the same network check from many public locations at once to see how reachability and routing differ by region, and from private locations to see the internal picture.
Ping and Port checks can run as often as every minute for critical hosts. Traceroutes run on a schedule (configurable from every 1 minute to every 3 hours) and can also be triggered automatically the moment an error is detected, so you always have fresh path diagnostics when something breaks.
Email, SMS, voice call, Slack, Microsoft Teams, PagerDuty and webhooks, with escalation policies and on-call rotation. Alerts can fire on hard failures (host unreachable, port closed) and on trend thresholds (latency above baseline, packet loss over a percentage), so you catch brownouts as well as outages.
No. Monitoring from the 30+ public locations requires no installation — you simply point a check at a public host. Private Agents are only needed when you want to monitor internal hosts, test between private networks, or measure connectivity from inside your perimeter outward.
Networks are on the critical path for websites, applications, remote work and branch connectivity — and they fail silently. A link can stay “up” while dropping packets, a route can shift to a slower path, or a service port can close while the host still pings. Continuous network monitoring surfaces outages, packet loss and latency drift in seconds, so teams reduce mean time to detection and protect SLAs instead of learning about problems from user complaints.
Run scheduled checks against your hosts and paths from the vantage points that matter: (1) pick a global location for public targets or install a Private Agent inside the network for internal ones, (2) configure ICMP Ping, Traceroute and TCP Port tasks with thresholds for latency and packet loss, and (3) route alerts to Slack, PagerDuty, email or SMS and schedule SLA reports. No appliances to rack — it’s fully SaaS.
Dotcom-Monitor uses ICMP for Ping reachability and latency, ICMP/UDP for Traceroute path analysis, and TCP for port and Telnet service checks. The wider platform also monitors HTTP/HTTPS, DNS, and SNMP-based device metrics — so one account covers reachability, routing, service availability and application-layer health.
Network monitoring software is a tool you install, host and maintain yourself; a network monitoring service is delivered as SaaS, with the vendor running the monitoring infrastructure and global locations for you. Dotcom-Monitor is a cloud service — no servers to stand up or patch — while still giving you an inside view through lightweight Private Agents you deploy in your own network.
Synthetic network monitoring proactively runs simulated checks — Ping, Traceroute, TCP port and higher-level transactions — against your network on a schedule from external locations and from inside agents, rather than only passively analyzing traffic that happens to flow. It detects problems continuously, including during low-traffic periods, and measures exactly what users and dependencies experience from each location.
Yes. Beyond simple up/down checks, Dotcom-Monitor captures round-trip latency, jitter and packet loss on every Ping, hop-by-hop timing on every Traceroute, and connect time on every port check. It baselines normal performance and alerts on statistical drift — so you catch brownouts and slow regressions, the core of network performance monitoring, not just outages.
Yes — a 30-day free trial with no credit card required. It includes every monitoring platform, all global locations, unlimited Private Agents, and 24/7 expert support.
Start monitoring Ping, Traceroute and Port checks from around the world and from inside your own network in minutes. Catch the outages, brownouts and routing failures before your users do.