Traceroute Monitoring: Pinpoint Network Issues with Advanced Traceroute Analysis

Identify and Resolve Network Latency & Routing Issues Faster
Dotcom-Monitor’s Traceroute Monitoring provides real-time network diagnostics to help you quickly identify and troubleshoot connectivity and latency issues happening on the Internet. Using our powerful Visual Traceroute, you gain a clear, graphical representation of network paths, hop-by-hop latency, and potential points of failure.
monitor status

Proactive Network Route Analysis

Traceroute Monitoring continuously tracks the routing of your data packets from multiple locations worldwide. By analyzing each hop and identifying errors, network congestion, or packet loss, you gain deep visibility into latency and performance bottlenecks from around the world.
location checks
Visualize Network Paths

See every hop and IP address along your packet’s route with an intuitive map-based interface.

alerting
Real-Time Alerts

Receive instant notifications when anomalies, packet loss, or slowdowns occur along the network path.

zero downtime
Identify Packet Loss & Latency Issues

Detect problematic network nodes causing performance degradation for your customers.

How It Works

Automatic Network Traceroute Execution

Our monitoring agents run a network traceroute at scheduled intervals to track routing performance. Additionally, when a network error is detected, a traceroute is triggered to provide real-time diagnostic data for troubleshooting. This ensures you always have relevant network path insights at your fingertips.

  • 30-hop visualization of network routes.
  • Color-coded performance indicators (green for normal, yellow for packet loss, red for failed hops).
  • Detailed node information, including hostname, IP, min/max/average response times, and errors.

Visual Traceroute: Gain Clear Network Insights

Traditional traceroutes provide raw data, but Dotcom-Monitor’s Visual Traceroute enhances troubleshooting with graphical representations of network paths.

  • Map View: Understand packet flow and pinpoint trouble spots geographically.
  • Historical Data: Compare past traceroutes to identify ongoing and historical routing issues.
  • Customizable Monitoring Locations: Test connectivity from different regions to see how users reach your network and services globally.
Visual Traceroute Map
performance engineering experts

Use Cases: Why You Need Traceroute Monitoring

Network engineers, IT administrators, and website owners rely on Traceroute Monitoring to:

  • Diagnose slow website or application performance caused by network latency.
  • Identify ISP routing issues affecting customer experience.
  • Monitor multi-cloud network performance to detect misconfigurations.
  • Troubleshoot firewall, VPN, and internal network path issues.
global monitoring

Key Features at a Glance

private location monitoring
Automated Traceroutes

Triggered when performance issues arise.

world wide web
Global Testing Locations

Monitor routing from multiple regions.

performance report
Color-Coded Visualization

Instantly recognize problem areas.

report
Network Traceroutes

Gain deep visibility into network routing paths, hop-by-hop performance, and packet loss detection.

web network
Map-Based View

Easily interpret and diagnose routing issues.

alert
Customizable Alerts

Get notified when network conditions change.

capterra
star rating
get-app
star rating

Trusted by Businesses Around the World

Our customers rely on Dotcom-Monitor to ensure an exceptional experience for their users, helping to retain a high level of trust and loyalty. That’s why we’re committed to ensuring that Dotcom-Monitor exceeds your expectations.
"I absolutely love the comprehensive monitoring services Dotcom-Monitor provides. The real-time alerts and detailed performance analytics have been a game-changer for our website's uptime and speed. The global monitoring feature ensures that our site is optimized everywhere, and the intuitive dashboard makes it easy to track performance. Their customer support is exceptional — always responsive and efficient."
Tomer C.
Managing Director · Facilities Services
Verified Capterra review · March 2025
"One of Dotcom's best features is the push/pull API capabilities that provide us with network performance data. We use this to monitor for performance issues as well as page loading stats. Dotcom-Monitor allows us to monitor multiple services within one interface and platform. It's allowed us to operate more efficiently."
Gregory S.
Manager · Broadcast Media
Verified Capterra review · May 2020
"I have been thoroughly impressed with the level of detail and comprehensiveness of the reports generated by the software. Moreover, the support team at Dotcom-Monitor has exceeded my expectations. On almost a daily basis, I reach out with various questions and they have consistently demonstrated unwavering patience, providing detailed and insightful answers."
Shirin R.
Software Test Engineer · Computer Software
Verified Capterra review · February 2023
"I'm a network analyst and use Dotcom tools inside the ISP I work, it's a really good and reliable tool for monitoring things along the network, and testing network components, I usually use it to make diagnostics of servers latency, and dns resolve time."
Leonardo J.
IT & Network Infrastructure Analyst Internet
Verified Capterra review · October 2022
Get answers

Frequently Asked Questions

Below are some of the most common questions about traceroute monitoring. If you have additional questions, feel free to contact us.

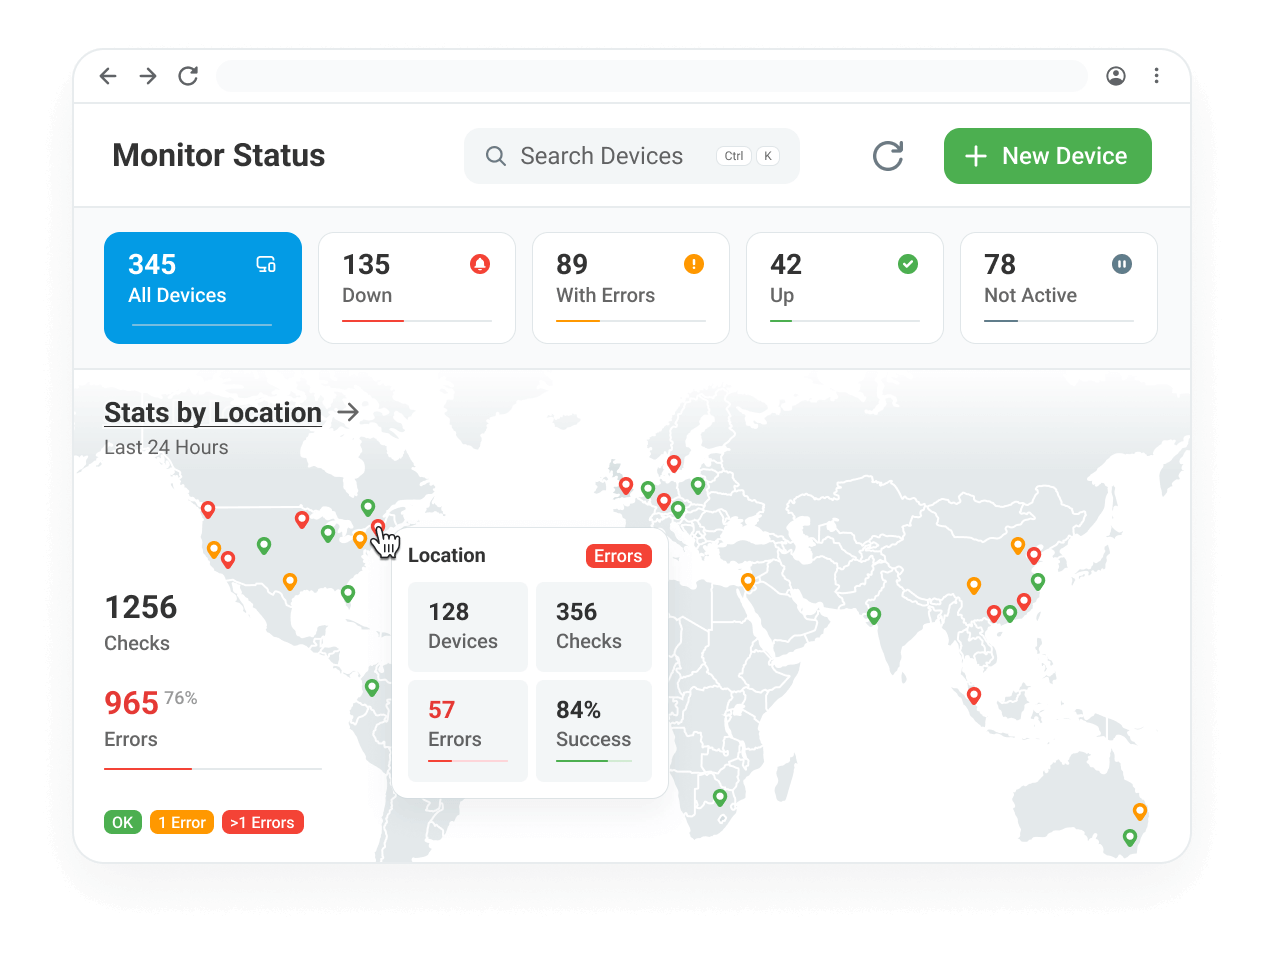
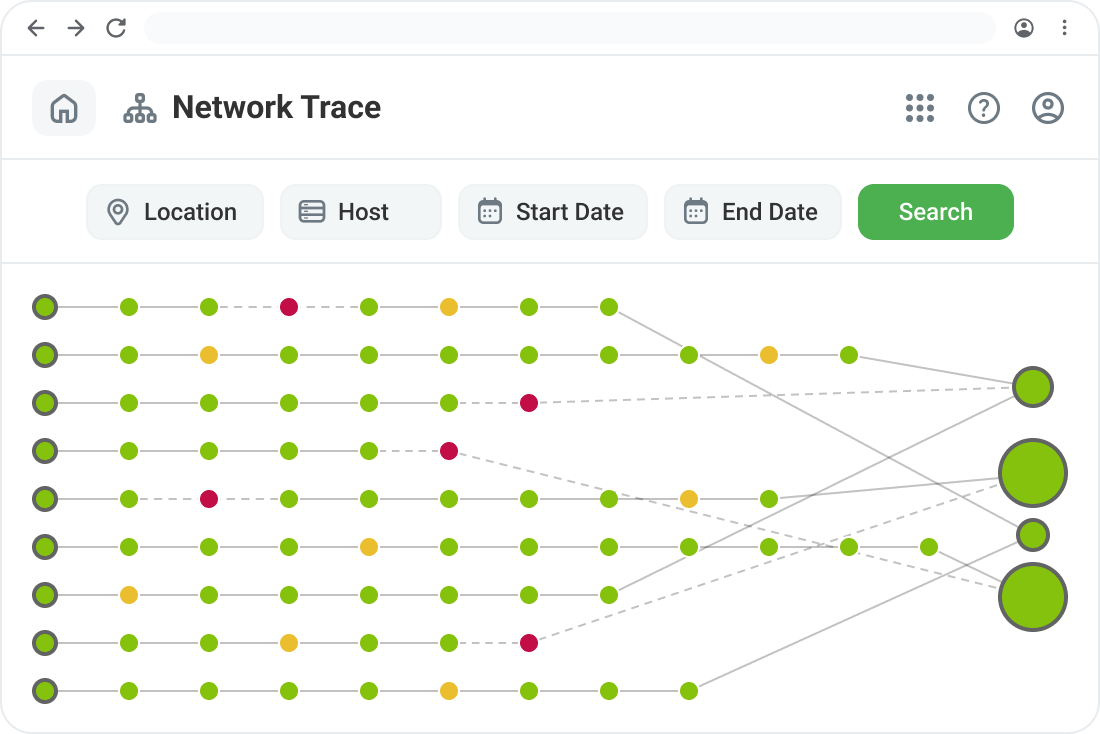
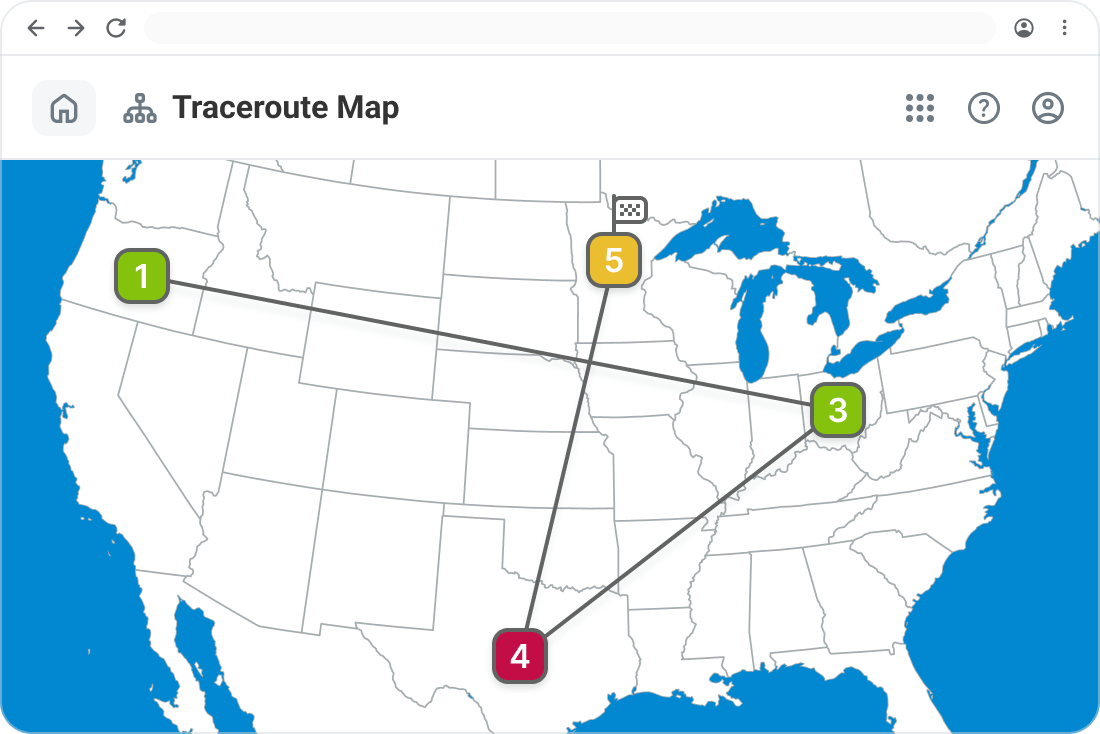
Traceroute Monitoring is a network diagnostic tool that tracks the journey of data packets across the internet, identifying where slowdowns, packet loss, or failures occur. Dotcom-Monitor’s Visual Traceroute provides a graphical representation of these paths, making troubleshooting fast and efficient.

Unlike traditional traceroute tools, Visual Traceroute presents network paths in a map-based interface with color-coded indicators. This allows IT teams to quickly pinpoint problem areas, analyze historical trends, and troubleshoot network issues effectively.

Yes! Dotcom-Monitor enables traceroute tests from multiple global locations, allowing you to see how network routes vary by region and helping you detect location-specific routing issues.

Traceroutes are run at scheduled intervals, configurable from every 1 minute to every 3 hours, allowing you to tailor monitoring to your specific needs.

Take Control of Your Network Performance
Traceroute Monitoring ensures you never have to guess where a network issue is occurring. Whether you’re managing a global infrastructure or troubleshooting local connectivity, Dotcom-Monitor provides real-time visibility into every hop, ISP, and routing detail.