- Product · Real-Time Protocol Monitoring
WebSocket Monitoring: Scheduled Tests of Your WS and WSS Endpoints From 33 Locations
Dotcom-Monitor’s WebSocket monitoring opens a real connection to your ws:// or wss:// endpoint, completes the upgrade handshake, sends the messages you define and checks that the server answers with what it should. It runs every minute if you need it, from monitoring locations around the world or from a private agent inside your network.
When the handshake is rejected, the certificate fails validation or the expected reply never arrives, the failure is confirmed from a second location and sent to your on-call channel with the event log of the session.
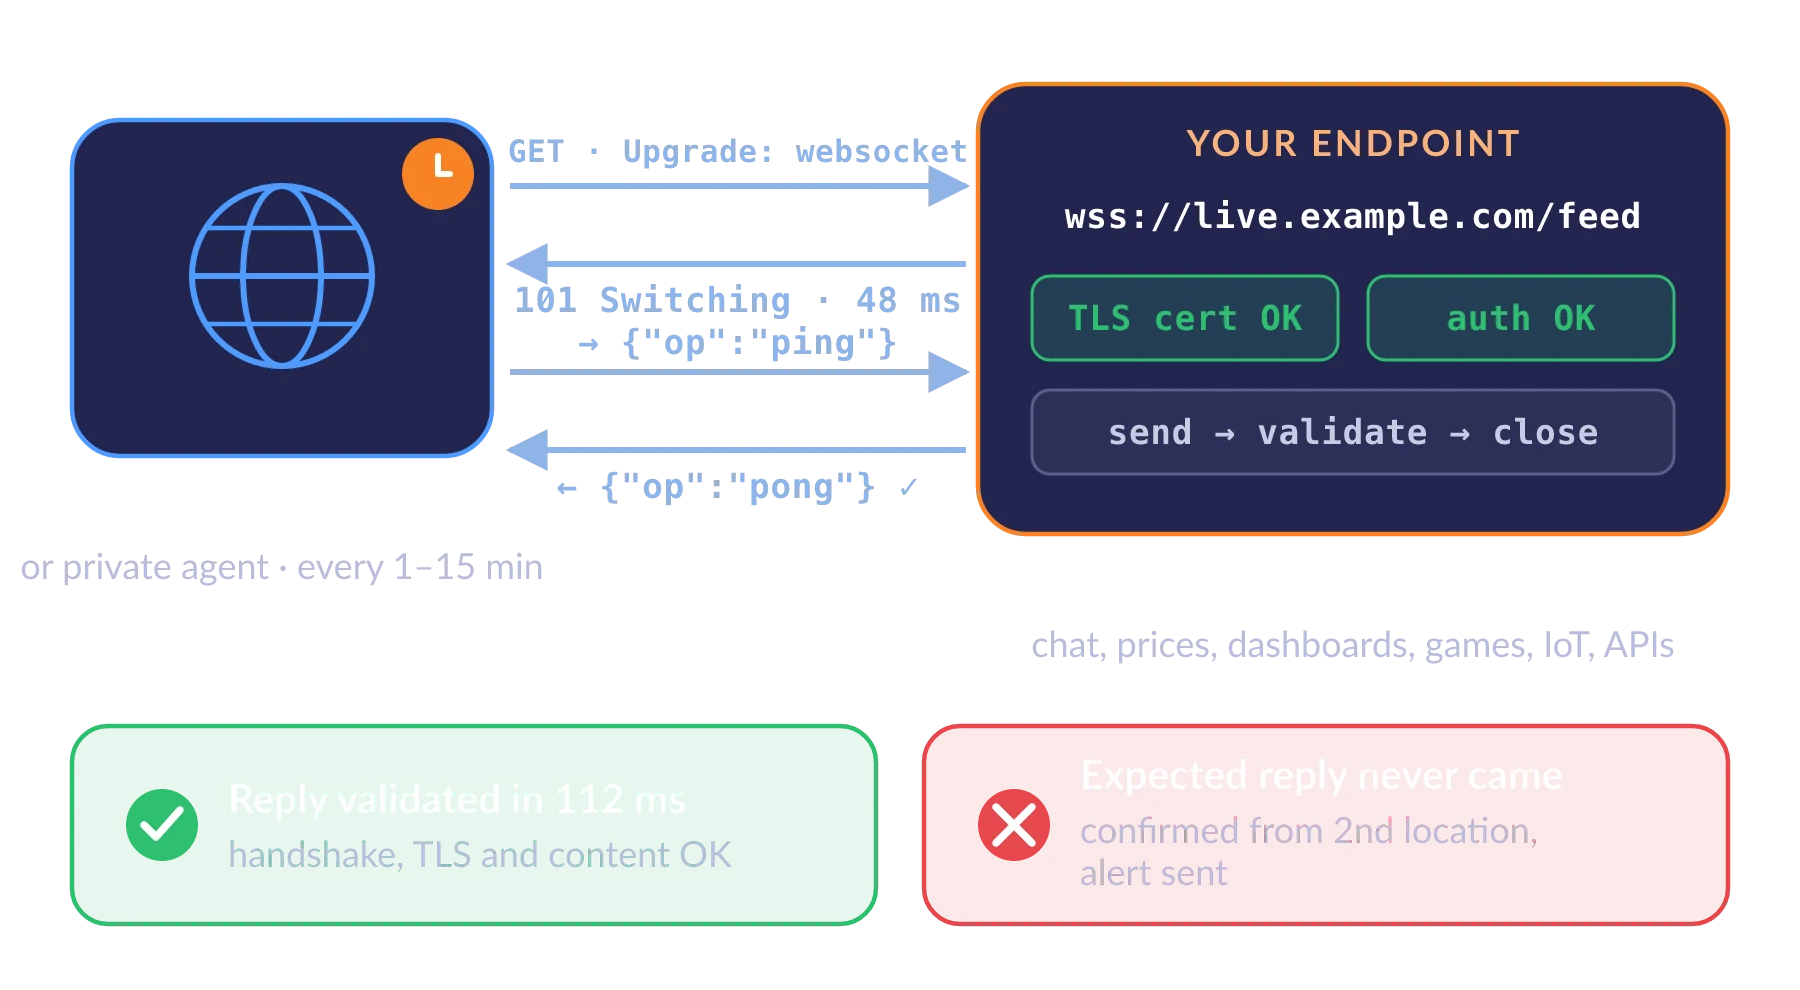
Handshake, send, validate, time it, alert when the conversation breaks.
Plain and TLS endpoints, with full certificate checks
Shortest check interval
Monitoring locations in 18 countries, or your own private agent
Locations confirm a failure before an alert is sent
What WebSocket Monitoring Is and How Dotcom-Monitor Does It
WebSocket monitoring is the scheduled, automated testing of a WebSocket endpoint to confirm that clients can connect, exchange messages and get correct, timely replies. A monitoring agent connects to the ws:// or wss:// URL, completes the HTTP Upgrade handshake (and the TLS handshake for wss://), sends one or more test messages and waits for the replies it expects. The check passes when every step succeeds inside the time limit; it fails when the connection, the certificate, the handshake or a reply does not. Dotcom-Monitor runs this check from 33 locations worldwide or from a private agent inside your network, as often as every minute, and records the timings and a step-by-step event log of every session.
WebSockets carry the parts of an application that have to feel instant: chat and support widgets, live prices and order books, collaborative editing, multiplayer state, notifications, dashboards and device telemetry. They also fail in ways an ordinary uptime check does not see. The web page still loads, the REST API still returns 200, and the socket that pushes the live data is refusing upgrades, closing after the handshake or accepting messages and never answering. A website check or an HTTP API check is not built to notice. A WebSocket monitor speaks the protocol and tests the conversation itself.
If you are new to the protocol, our article What Is a WebSocket? covers the handshake, frames and common use cases. The rest of this page is about keeping a WebSocket service working in production.
How a WebSocket Monitoring Check Runs
Each check is one complete WebSocket session from a Dotcom-Monitor agent to your endpoint: resolve, connect, upgrade, exchange messages, validate, close, report. It repeats on the interval you set, as often as every minute.
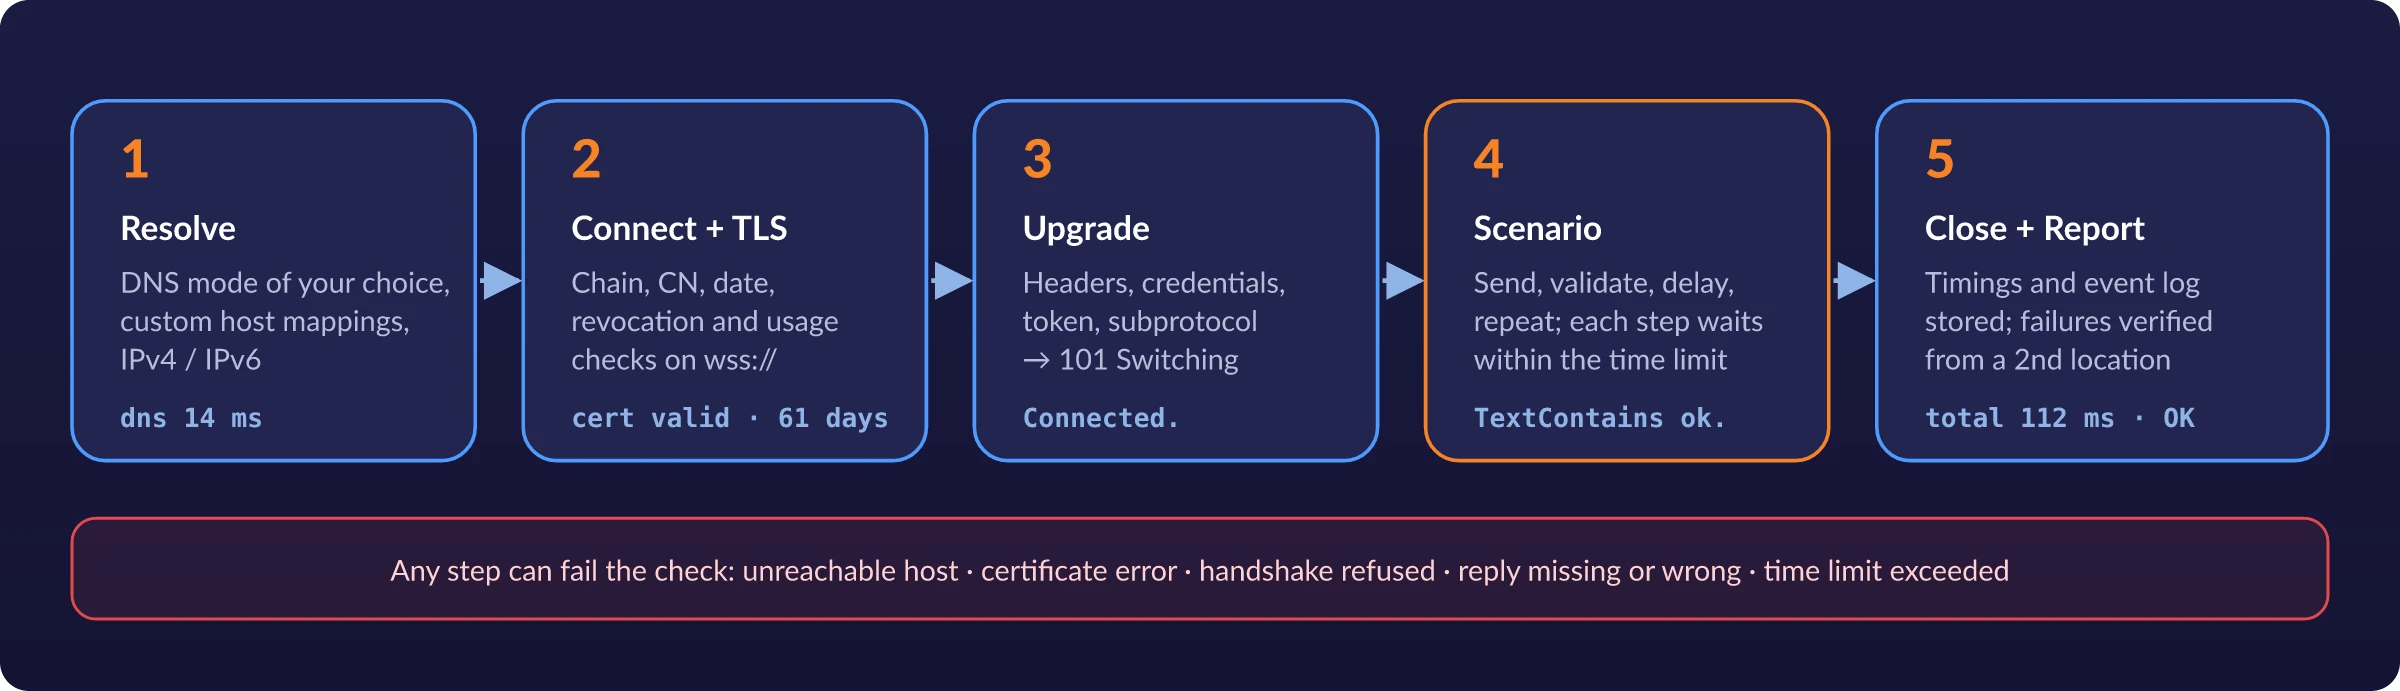
A WebSocket check is a real client session, not a port probe. The agent connects the way your users’ browsers and apps do, says what you tell it to say, and closes the connection cleanly when the scenario ends.
The Agent Resolves the Hostname
The task takes a WebSocket URL, such as wss://live.example.com/feed?channel=prices, or an IP address. The agent resolves the name with the DNS mode you choose: its cached resolver, a fresh lookup each time, caching by TTL, or an external DNS server. Custom DNS host mappings point the name at a specific IPv4 or IPv6 address, so you can test one node behind a load balancer. If you enter an http(s):// URL by mistake, the scheme is switched to ws automatically.
It Connects and Validates TLS
For wss:// the agent completes the TLS handshake and checks the server certificate the way you configure it: trusted root (authority), name match (CN), expiry date, revocation and intermediate certificate usage. An expiration reminder can raise an error a set number of days before the certificate expires, so a renewal is never a surprise.
It Performs the WebSocket Handshake
The agent sends the HTTP Upgrade request with the custom headers you set, credentials for Basic, Digest or NTLM authentication, a bearer token for OAuth 2.0-protected endpoints, and the Sec-WebSocket-Protocol subprotocol your server expects. The server must answer 101 Switching Protocols. A 401, 403, 404, 426 or a closed connection fails the check here.
It Runs Your Scenario
With the connection open, the agent sends your test message and waits for the reply to contain your keyword. Or it runs a multi-step scenario written in the Prepare Script: send text or binary, validate an exact or partial reply, pause, send again. Each validation step waits until the expected data arrives or the time limit runs out. The Time Validation Threshold covers the whole session, up to 60 seconds.
It Closes, Records and Alerts
The agent sends a normal close frame and stores the results: DNS time, time to first byte, total session duration, the resolved IP and a timestamped event log of every step (connected, sending, sent, data arrived, check ok or failed, closing). On failure the platform re-runs the check from another location. If that fails too, the alert goes out through your alert channels with the error and the log.
Scripted Send-and-Validate WebSocket Scenarios
A WebSocket that accepts connections is not necessarily working. The test that matters is whether the server answers a real message correctly. Dotcom-Monitor gives you two ways to define that conversation.
- Simple: one message and a keyword. Put the message in Send Data and the text you expect back in Content Validation. The agent sends the message after the connection opens and waits for a reply containing the keyword (case-sensitive). Razor expressions and data masks make the message dynamic, for example a fresh timestamp or ID on every run.
-
Scripted: any number of steps. In the Prepare Script, chain
SendText,SendBinary,ValidateText,ValidateTextContains,ValidateBinary,ValidateBinaryContainsandDelaycalls in the order your protocol needs. Subscribe, wait for the acknowledgement, request data, check the payload, wait ten seconds and check that an update was pushed. - Text and binary payloads. Text messages are sent as written. Binary messages and binary validations take Base64, so protobuf, MessagePack or any other binary encoding can be tested byte for byte.
- Post Script for anything else. C# in the Post Script can inspect the result, capture values and publish custom data with each check.
Full syntax and examples: WebSocket monitoring setup and Prepare Script and Post Script in the knowledge base.
// Prepare Script — subscribe, then expect a push
currentTask.SendText("{\"op\":\"subscribe\",\"ch\":\"BTC-USD\"}");
currentTask.ValidateTextContains("\"status\":\"subscribed\"");
currentTask.Delay("10s");
currentTask.ValidateTextContains("\"type\":\"ticker\"");

# event log of one run, from Frankfurt
    0ms Connected.
    2ms Sending [{"op":"subscribe","ch":"BTC-USD"}]
    3ms Sent.
   41ms Data arrived: {"status":"subscribed"}
   52ms TextContains ok.
   52ms Delay 10000 msec. start.
10052ms Delay done.
10053ms TextContains ok.
Example scenario and event log. The endpoint and messages are illustrative; the method names and log lines are the ones the product uses.
connection_init for GraphQL subscriptions, a STOMP CONNECT frame or a Socket.IO handshake packet, script those messages as SendText steps and validate the server’s acknowledgement before testing your own data. For GraphQL over HTTP see GraphQL API monitoring. WebSocket Monitoring Task Settings
A WebSocket task is one device in your Dotcom-Monitor account. You give it the endpoint, what to send and what to expect, pick locations and a frequency, and it starts on the next interval. Every field is also available through the configuration API (Task_Type_Id 74), so tasks can be created from your service inventory.
Setting | What You Enter | What It Lets the Check Verify |
|---|---|---|
URL | A ws:// or wss:// endpoint or IP address, with query parameters; can be a dynamic value set by script | The exact endpoint and channel your clients use |
Send Data | A message to send after the connection opens; plain text, Razor expression or data mask | That the server processes a real message, not just accepts a connection |
Content Validation | A keyword or phrase the reply must contain (case-sensitive) | That the reply is the right one, not an error frame or an empty push |
Prepare Script / Post Script | C#: multi-step send, validate and delay scenarios; custom result handling | Subscribe-then-push flows, protocol handshakes, binary payloads, several request/response pairs in one session |
Headers | Any request header name and value, including Origin, API keys and Sec-WebSocket-Protocol | Origin checks, subprotocol negotiation, gateway routing and key-based access |
Authentication | Username and password for Basic, Digest or NTLM ( DOMAIN\user); bearer token for OAuth 2.0 | Protected sockets behind a login, a Windows domain or an identity provider |
SSL/Certificate | Authority, Common Name, Date, Revocation and Usage checks; expiration reminder in days | That wss:// clients will trust the certificate, and that you hear about expiry in advance |
Time Validation Threshold | Maximum seconds for the whole session, up to 60 (default 60) | Slow handshakes and slow replies fail the check, not only missing ones |
DNS Options | DNS Resolve Mode (Device Cached, Non-Cached, TTL Cached, External DNS Server) and Custom DNS Hosts, IPv4 and IPv6 | Tests through the resolver your users rely on, or against one specific backend |
Locations and Frequency | Any of the 33 public locations, a private agent, or both; every 15, 10, 5, 3 or 1 minute | Whether the socket fails for everyone or one region, and how quickly you know |
WebSocket Failures an HTTP Uptime Check Misses
Most WebSocket outages happen while the website and the REST API look healthy. These are the failures WebSocket monitoring exists to catch, and the step of the check where each one shows up.
Proxy Drops the Upgrade
A new load balancer, CDN rule or reverse-proxy config stops forwarding the Upgrade and Connection headers. Pages load, the socket never opens, and the client falls back or spins.
Auth or Origin Rejected
A token change, an expired API key or a stricter Origin allow-list rejects the upgrade. The check sends the same headers and credentials as your clients, so it is rejected the same way.
WSS Certificate Problems
An expired, mismatched, revoked or incompletely chained certificate on the socket host, which is often a different host from the website. Browsers refuse it silently; the check names the reason.
Connected, but Silent
The server accepts the connection and never answers: a stuck worker, a broken message broker behind it, a subscription that registers but never pushes. Only a send-and-validate check notices.
Wrong or Error Payload
The socket answers with an error frame, an empty object or yesterday’s schema after a deploy. Content validation fails on the missing field, not on a status code.
Slow Replies
Reply latency creeps up under load until real-time stops being real time. Session duration is recorded on every run, and the threshold fails the check before users notice.
Broken on One Path Only
A regional edge, a corporate proxy or an ISP mishandles long-lived connections. Checks from several of the 33 locations show which geographies are affected.
Socket Host Unreachable
A DNS change, a security-group edit or a scaled-to-zero service makes the socket host unreachable while the main site, served elsewhere, stays up.
WebSocket Testing Tools vs Continuous WebSocket Monitoring
To test a WebSocket connection once, developers reach for wscat, websocat, Postman, Insomnia, the browser’s DevTools or an online WebSocket test client. They are the right tools while you build: connect, send a frame, read the reply, adjust. What they do not do is run again at 3 a.m., from another continent, against production, and tell someone when the answer changes.
Dotcom-Monitor turns the test you would run by hand into a WebSocket test tool that runs itself. The same connect-send-validate sequence runs on a schedule from many locations, keeps a history of every result and timing, and alerts the right person when it fails. Write the scenario once, the way you would type it into a test client, and it becomes your production check.
Use Each for What It Is Good At
- Developing or debugging a socket: a test client, interactive and immediate.
- Knowing production works right now and all night: scheduled WebSocket monitoring from several locations with alerts.
- Knowing it will hold 10,000 concurrent users: LoadView load testing; see WebSocket load testing.
- Testing the socket inside a full web app: a recorded browser journey with web application monitoring, which runs the page's own WebSocket traffic in a real browser.
Monitor Public Sockets From 33 Locations, and Internal Ones From Inside Your Network
Public Endpoints: From Where Your Users Are
Dotcom-Monitor’s monitoring network has 33 locations in 18 countries on 6 continents, with IPv4 and IPv6 nodes, and every location is available on every plan. Running one WebSocket task from several of them separates “the socket is down” from “the socket is broken on one path”. The locations have published IP addresses, so a gateway that only accepts known sources can allow the monitoring nodes.
Internal Endpoints: From a Private Agent
Trading backends, internal dashboards, IoT gateways and service-to-service sockets are not exposed to the internet. Install a private agent inside the network and the same WebSocket task runs against internal names and addresses, reports over an outbound HTTPS connection and appears in your account as one more location. WebSocket tasks run on the Protocol Edition, from $4.95 per agent per month.
- Test individual backends. Use Custom DNS Hosts to map the socket hostname to each node's IP in separate tasks, so one failing node shows up while the load balancer keeps the shared name answering.
- Keep secrets out of task settings. Tokens and passwords can be stored in Secure Vault and referenced from the task.
Verified Alerts With the Session Log, and a Timing History for Every Endpoint
Verified Alerts
A failure from one location can be one bad route. By default Dotcom-Monitor requires a second location to confirm the failure before an incident opens. Only a confirmed failure reaches your alert channels: email, SMS, phone call, Slack, Microsoft Teams, PagerDuty, ServiceNow, webhooks, SNMP traps and more, routed through escalation schedules. The alert carries the endpoint, the error (connection, certificate, timeout or failed validation), the failing locations and the timings, and the error report includes the event log, so you can see which step failed and what the server actually sent.
Reports and SLA Evidence
Every check writes its result, DNS time, time to first byte and total duration into your reports and dashboards: availability for the period, response-time trend per location, and an error log. Certificate expiration data from wss:// checks feeds the certificate report card. Scheduled summaries go out daily, weekly or monthly, and the data is available through the API.
Everything the Platform Gives Every Monitor
- Scheduling from every minute to every 15 minutes per task, with maintenance windows so a planned deploy does not page anyone.
- Filters that require a failure to repeat, to occur from N locations or to last a set time before an alert fires.
- Device grouping so the sockets, API and web front end of one service roll up into one view.
- Dashboards and reports shared with your team or white-labeled for an MSP's clients.
- Configuration API to create WebSocket tasks from your inventory and pull results into your own tooling.
- One account for WebSocket checks alongside API, SSL certificate, DNS, port and website monitoring.
WebSocket Monitoring vs Port, HTTP API and Browser Checks
Each check answers one question about a real-time service. Most teams run the WebSocket task next to at least one of the others.
WebSocket Task This Page | TCP Port Check | HTTP / REST API Check | Browser Journey (EveryStep) | |
|---|---|---|---|---|
Question | Does the socket accept clients and answer messages correctly, in time? | Is anything listening on the port? | Does the HTTP endpoint return the right response? | Does the whole page work for a user, including its live data? |
What It Does | TLS, Upgrade handshake, scripted send and validate, close | TCP handshake only | One or more HTTP requests with assertions | Recorded clicks and inputs in a real browser |
Catches | Rejected upgrades, auth and origin errors, certificate problems, silent or wrong replies, slow replies | Crashed listener, firewall change | API errors, bad JSON, slow endpoints | Front-end and end-to-end failures |
Blind Spot | Front-end rendering; connections held longer than 60 seconds | Everything after the TCP connect | Anything sent over the socket | Exact message-level assertions on the socket |
Plan | Internet Infrastructure, from $40/mo | Internet Infrastructure | Web Services | Web Applications |
Learn More |
WebSocket Monitoring Is Part of the Internet Infrastructure Plan
WebSocket tasks are billed under Internet Infrastructure (ServerView), the same plan that covers port, DNS, SSL certificate, ping, traceroute, FTP, email server and VoIP/SIP checks. One target is one WebSocket task, whatever its scenario does. Mix WebSocket targets with any of the others in the same plan. Pricing is a fixed monthly amount for the targets and frequency you choose, not per check, and every plan includes alerting, reports and the API.
- 5 to 300 targets per plan
- Check intervals from 15 minutes down to 1 minute
- All 33 public locations included; private agents from $4.95 per agent per month for internal sockets
- 30-day free trial with full platform access, no credit card
4.5Capterra overall, 83 reviews
4.6Customer service (as of October 2026)
WebSocket Monitoring Questions
What Is WebSocket Monitoring?
WebSocket monitoring is the scheduled, automated testing of a WebSocket endpoint to confirm that clients can connect, exchange messages and get correct, timely replies. A monitoring agent connects to the ws:// or wss:// URL, completes the Upgrade handshake, sends test messages and validates the replies. Dotcom-Monitor runs the check from 33 locations or a private agent, as often as every minute, records timings and an event log for every session, and alerts you when a step fails.
How Is WebSocket Monitoring Different From a WebSocket Test Tool?
A WebSocket test tool, such as wscat, Postman or an online test client, runs one session when you start it. Monitoring runs the same connect, send and validate sequence on a schedule from several locations, keeps the history of every result and timing, and alerts someone when it fails. Use a test client while you build a socket and monitoring once it is in production.
How Do I Test a WebSocket Connection With Dotcom-Monitor?
Create a WebSocket task, enter the ws:// or wss:// URL, add a message in Send Data and the text you expect back in Content Validation, then choose locations and a frequency. The first results, with the event log of the session, appear within minutes. For multi-step tests, write the scenario in the Prepare Script with SendText, ValidateTextContains and Delay steps.
Does It Support wss:// and Check the Certificate?
Yes. Both ws:// and wss:// are supported. For wss:// endpoints the task can check the certificate chain’s trusted root, the name match, the expiry date, revocation and intermediate certificate usage, and raise an error a set number of days before expiry. Expiration data also appears in certificate reports.
Can It Send Messages and Check the Replies?
Yes. The simple setup sends one message and waits for a reply containing your keyword (case-sensitive). The Prepare Script supports scenarios of any length: send text or binary messages, validate an exact or partial reply, and pause between steps. Each validation waits for the expected data until the time limit runs out, and a reply that never arrives fails the check.
Does WebSocket Monitoring Support Binary Messages?
Yes. In the Prepare Script, SendBinary sends a message given as Base64, and ValidateBinary and ValidateBinaryContains check a reply against Base64-encoded bytes, exactly or partially. That covers protobuf, MessagePack and other binary encodings.
How Do I Monitor a WebSocket That Requires Authentication?
Enter a username and password for Basic, Digest or NTLM authentication, supply a bearer token for OAuth 2.0-protected endpoints, or send the API key, cookie or Origin header your gateway expects as a custom header. The subprotocol goes in a Sec-WebSocket-Protocol header. Secrets can be kept in Secure Vault rather than in the task.
What Does a WebSocket Monitoring Check Measure?
Each check records DNS time, time to first byte, total session duration and the IP address it connected to, along with the pass or fail result. It also stores a timestamped event log of the session (connected, sending, sent, data arrived, each validation step and its outcome, closing), so a failure shows which step broke and what the server sent before it did.
Can I Monitor Socket.IO, STOMP or GraphQL Subscriptions?
Where the protocol runs over a standard WebSocket and opens the session with text messages, yes: script those opening messages, such as a GraphQL connection_init or a STOMP CONNECT frame, as SendText steps, validate the server’s acknowledgement, then test your own data. Socket.IO endpoints take their transport parameters in the URL query string, which the task supports.
How Long Does a Check Keep the Connection Open?
Up to the Time Validation Threshold, which is at most 60 seconds per session. Each check opens a fresh connection, runs the scenario and closes the connection with a normal close frame. The task tests whether clients can connect and converse; it is not a permanent listener that holds one connection open between checks.
Can I Monitor WebSocket Endpoints That Are Not on the Internet?
Yes, with a private agent installed inside your network. It runs the same WebSocket task against internal hostnames and addresses, reports over an outbound HTTPS connection and appears in your account as another location with the same alerts and reports. WebSocket tasks run on the Protocol Edition, from $4.95 per agent per month.
How Often Does It Check, and From Where?
Every 15, 10, 5, 3 or 1 minute, per task. Each task runs from the public monitoring locations you select (33 locations in 18 countries), from a private agent, or both, and each location reports its own result and timings. Failures are confirmed from a second location before an alert is sent.
Can I Load Test a WebSocket Server?
Monitoring checks that the socket works; load testing checks how many concurrent clients it can take. For load tests, use LoadView, Dotcom-Monitor’s load testing platform. The knowledge base article on WebSocket load testing covers the setup.
How Much Does WebSocket Monitoring Cost?
WebSocket tasks are part of the Internet Infrastructure plan, which starts at $40 per month for 5 targets checked every 15 minutes and scales to 300 targets with intervals down to 1 minute. One target is one WebSocket task, and the same plan covers port, DNS, SSL, ping, traceroute, FTP, email and VoIP checks. Current tiers are on the pricing page, and the 30-day free trial includes WebSocket monitoring.
Start Monitoring Your WebSocket Endpoints
Start a 30-day free trial, add a WebSocket task with your endpoint, a test message and the reply you expect, and see the first results and session logs from around the world within minutes. No credit card required.