Home » Products » API Monitoring » Insomnia API Monitoring
- Insomnia Collections
- v4 export · JSON / YAML
Insomnia for Building APIs. Dotcom-Monitor for Watching Them.
Insomnia is a great API client, but it doesn’t monitor production. Export your Insomnia v4 collection, import it into Dotcom-Monitor, and the same requests you built for development now run as 24/7 production monitors from 30+ global locations.
- v4 export native
- Environments preserved
- 1-min monitoring frequency
- Cancel anytime · No auto-charge after trial
Direct import
Your Insomnia Collection. As Production Monitors.
Export from Insomnia (Application → Preferences → Data → Export Data), drop the v4 JSON or YAML into Dotcom-Monitor, and the same requests you built for development now run on a 1-minute cadence from 30+ global locations.
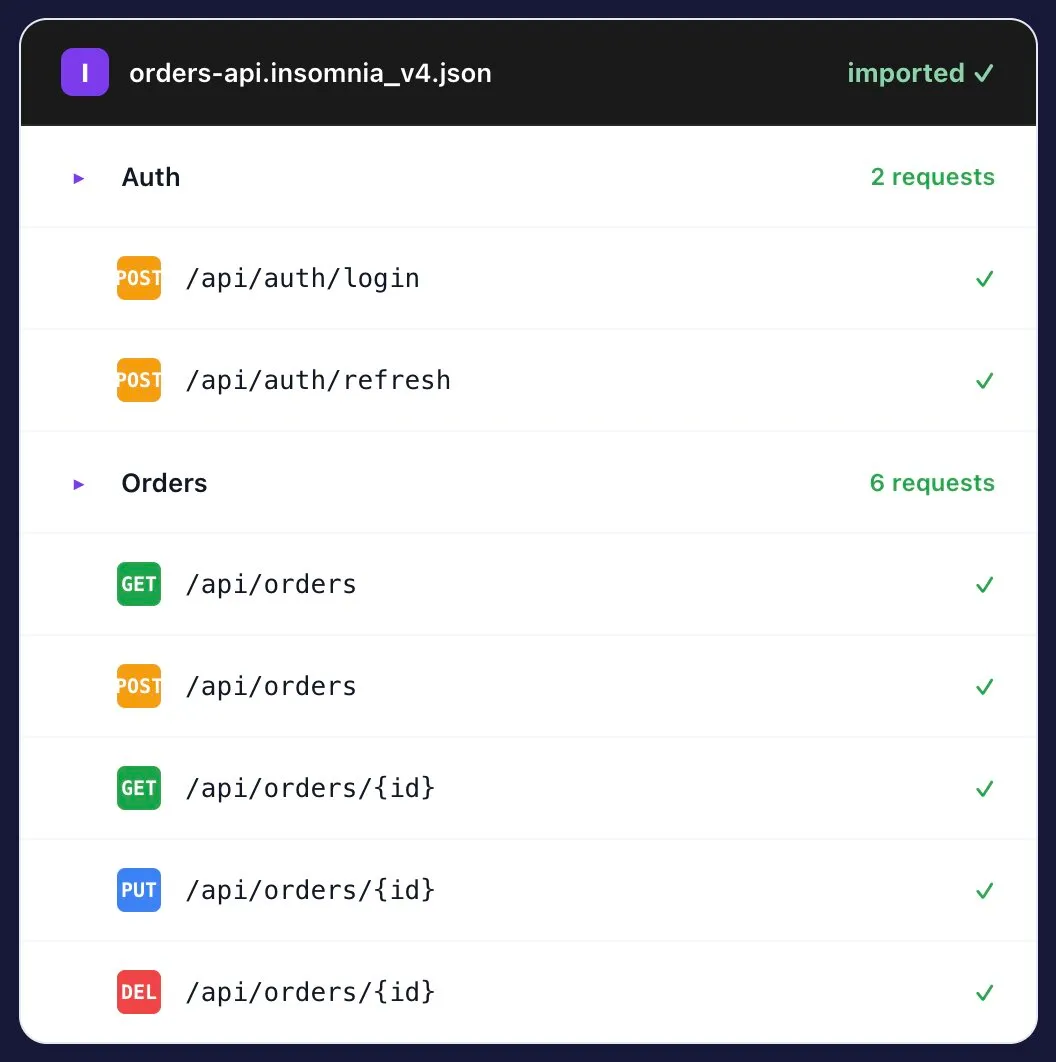
- Insomnia v4 exports (JSON or YAML) imported natively.
- Request groups preserved — your folder structure maps to monitor groups.
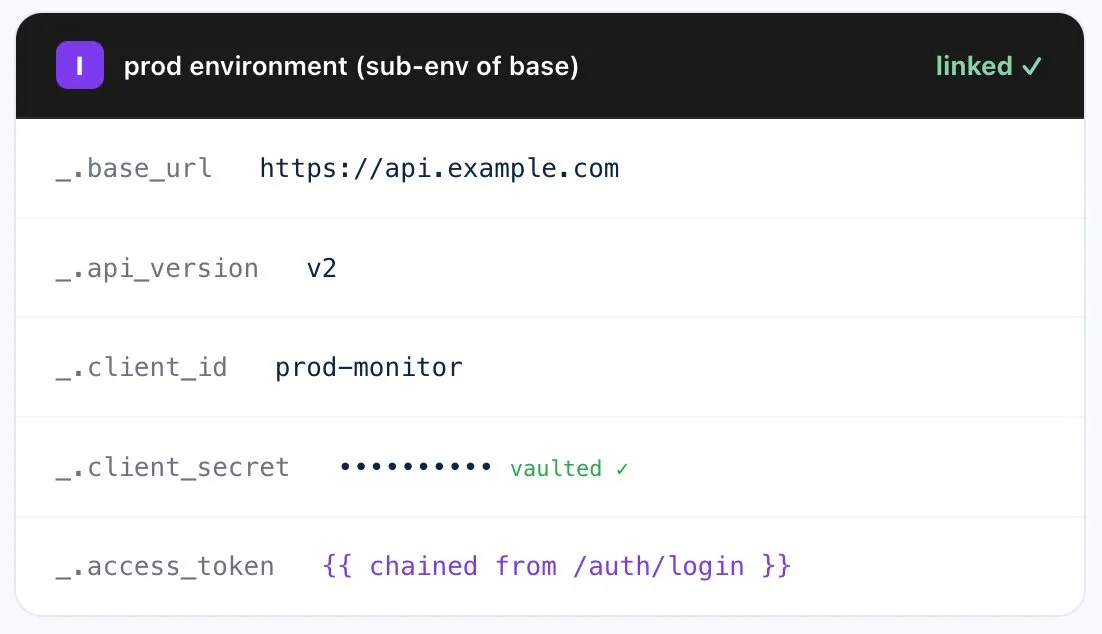
- Environments & sub-environments — base + sub-env hierarchy intact.
- Auth configs — Basic, Bearer, OAuth 2.0, API Key, AWS, NTLM all preserved.
Capability | Insomnia | + Dotcom-Monitor |
|---|---|---|
Build & debug requests | (imported) | |
Run on-demand from your machine | ||
Continuous 24/7 synthetic checks | ||
Run from 30+ global locations | ||
Private Agents (behind firewall) | ||
PagerDuty / Slack / Teams alerts | ||
SLA on the platform | N/A | 99.99% |
Why pair them
Insomnia Is the API Client. We’re the Monitoring Layer.
Insomnia is a great place to design, test, and debug requests during development. It’s not a monitoring platform — no continuous synthetic checks, no global locations, no PagerDuty routing, no behind-firewall coverage. Dotcom-Monitor adds the production-monitoring layer that Insomnia doesn’t include.
- 24/7 synthetic checks from 30+ global locations vs. on-demand runs from one machine.
- Private Agents for monitoring internal APIs behind the firewall.
- Native PagerDuty / Slack / Teams alert routing with diagnostic context.
- 99.99% Uptime SLA on the monitoring platform itself.
Use cases
What Teams Do Once Their Insomnia Collections Are Running 24/7
Dev Tests → Production Monitors
The requests your team built for development become 24/7 production monitors. Same fidelity, no rebuild.
Post-Deploy Validation
Trigger the imported collection from CI after each deploy. Block bad releases on contract changes, broken endpoints, or assertion failures.
Regional Failure Detection
Run the same Insomnia collection from 30+ locations in parallel. Surface geo-specific issues that local testing never catches.
Vendor Sla Tracking
Use the collection you built to test Stripe, Twilio, Okta, or any vendor as the source for continuous SLA monitoring.
Internal Microservices
Drop a Private Agent inside your VPC. Same Insomnia-exported collection, now monitoring internal endpoints behind the firewall.
Re-Import as Collections Evolve
Export from Insomnia again as your collection grows. Re-import keeps your monitors aligned with the latest request structure.
Not ready for a trial?
Want a 15-Minute Walkthrough First?
A performance engineer will walk you through your existing Insomnia v4 collection running as a 24/7 production monitor — no sales pitch, just a working monitor by the end of the call.
Fits your stack
Routes Alerts Into the Tools Your Team Runs
Slack
PagerDuty
Microsoft Teams
Opsgenie
Webhook
Email / SMS
Grafana
Prometheus
GitHub Actions
Jenkins
Azure DevOps
Power BI
Global monitoring network
Your Insomnia Collection. 30+ Locations. In Parallel.
The collection your team uses locally now runs continuously from 30+ owned monitoring locations across six continents — plus inside your network if you deploy a Private Agent.
30+
Global monitoring locations
6
Continents covered
1 min
Minimum check interval
Private Agents
For behind-firewall

What teams say
Engineers Don’t Recommend Monitoring Lightly
"I absolutely love the comprehensive monitoring services Dotcom-Monitor provides. The real-time alerts and detailed performance analytics have been a game-changer for our website's uptime and speed. The global monitoring feature ensures that our site is optimized everywhere, and the intuitive dashboard makes it easy to track performance. Their customer support is exceptional — always responsive and efficient."
Tomer C.
Managing Director · Facilities Services
Verified Capterra review · March 2025
"One of Dotcom's best features is the push/pull API capabilities that provide us with network performance data. We use this to monitor for performance issues as well as page loading stats. Dotcom-Monitor allows us to monitor multiple services within one interface and platform. It's allowed us to operate more efficiently."
Gregory S.
Manager · Broadcast Media
Verified Capterra review · May 2020
"I have been thoroughly impressed with the level of detail and comprehensiveness of the reports generated by the software. Moreover, the support team at Dotcom-Monitor has exceeded my expectations. On almost a daily basis, I reach out with various questions and they have consistently demonstrated unwavering patience, providing detailed and insightful answers."
Shirin R.
Software Test Engineer · Computer Software
Verified Capterra review · February 2023
"I'm a network analyst and use Dotcom tools inside the ISP I work, it's a really good and reliable tool for monitoring things along the network, and testing network components, I usually use it to make diagnostics of servers latency, and dns resolve time."
Leonardo J.
IT & Network Infrastructure Analyst Internet
Verified Capterra review · October 2022
4.5
Capterra
82 reviews
4.6
Ease of Use
Capterra Score reviews
4.6
Customer Service
Capterra Score reviews
All reviews sourced from Capterra verified reviews. Ratings as of July 2026.
Want to kick the tires without committing? Free Forever plan available — up to 25 targets, 2 monitoring locations, 7 days of data retention. Get started free → or Compare plans
Frequently asked questions
Insomnia Monitoring Questions Before Signing Up
Can I import Insomnia collections directly?
Yes. Import Insomnia v4 export files (JSON or YAML) directly. Request details, environments, sub-environments, authentication configs, and request group structure are all preserved.
Why use Dotcom-Monitor instead of just Insomnia?
Insomnia is an API client for development — built for designing, testing, and debugging requests on your machine. It’s not a monitoring platform. No continuous synthetic checks, no global locations, no incident routing, no SLA. Dotcom-Monitor adds the production-monitoring layer Insomnia doesn’t include.
What gets preserved when I import?
Request method, URL, headers, body, query parameters, path parameters, environment variables (base + sub-environments), authentication configs (Basic, Bearer, OAuth 2.0, API Key, AWS, NTLM), and request group structure.
Does it support environment hierarchies?
Yes. Base environments and sub-environments import together — pick which one each monitor uses (dev/staging/prod) and re-import as your workspace evolves.
Can I monitor Insomnia collections from multiple regions?
Yes. Run the collection in parallel from 30+ owned global monitoring locations. Detect regional CDN, DNS, and routing issues local testing misses.
Can I monitor internal APIs documented in Insomnia?
Yes. Deploy Private Agents inside your VPC or datacenter. The same exported collection runs against internal endpoints — no inbound firewall rules required.
Can I integrate with CI/CD?
Yes. Trigger monitor runs via the Dotcom-Monitor REST API from GitHub Actions, Jenkins, Azure DevOps, or any CI tool. Gate the deploy on assertion results, latency, or availability.
What if I'm using Postman instead?
Same story — import Postman Collection v2.0 or v2.1 JSON directly. See Postman API monitoring →
Does Dotcom-Monitor support Insomnia's GraphQL request type?
Yes. Insomnia GraphQL requests import with their query, variables, and headers intact. The monitor sends the query as defined and validates the response per your assertions.
Can I migrate from Insomnia Cloud Sync to Dotcom-Monitor?
Yes. Export your collection from Insomnia (Cloud Sync content exports as v4 JSON or YAML), then import into Dotcom-Monitor. The same workspace structure is preserved.
Does it support Insomnia plugins?
Plugin-modified behavior (custom auth, response transforms) may not import cleanly because plugin code is Insomnia-specific. Configure equivalent behavior via Dotcom-Monitor’s native auth and assertion features instead.
What's the difference between Insomnia and Postman for monitoring?
For monitoring purposes, both Collections import similarly — request method, URL, headers, body, environments, auth. Insomnia’s sub-environment hierarchy maps to environment selection per monitor. Choose whichever tool your team already uses for development.
Monitoring more than Insomnia collections? See the full API Monitoring platform →
Insomnia Builds Them. Dotcom-Monitor Watches Them.
30-day free trial. No credit card. Import your collection in under five minutes.
- 10,000+ organizations
- Monitoring leader since 1998
- 99.99% Uptime SLA