




Organizations Worldwide
Platform Uptime SLA
Global Monitoring Locations
Website Monitoring Leader
Cron job monitoring is a way to confirm that scheduled tasks — cron jobs, crontab entries, backups, and background scripts — actually run on time and finish successfully. Each job sends a small signal called a heartbeat when it runs. If that heartbeat arrives late, never arrives, or reports a failure, the monitoring service sends an instant alert so you find out before your users do.
Because a missed cron job is invisible by default — nothing errors out, the job simply doesn’t happen — dedicated crontab monitoring and reliable cron monitoring are the only way to catch silent failures in backups, data pipelines, and scheduled reports.
If it runs on a schedule and can reach the internet, we can watch it. Turn every cron job into a datapoint you can trend, alert on, and prove — all in the same platform you already use for website and API monitoring.
Get alerted when a cron job doesn’t report within its expected window — or when it runs but takes far longer than it should.
Chart execution time over days and weeks to catch slow regressions and capacity problems long before they cause an outage.
Cron expressions, fixed intervals (every 24h), or specific times of day. Match the exact cadence your jobs actually run on.
Email, SMS, voice, Slack, Microsoft Teams, PagerDuty and webhooks — with escalation so the right person always gets it.
Send status, duration, rows processed, output size or any KPI in a simple JSON POST. Every value is stored and charted.
Reuse the same dashboards, teams and alert rules you already have for website, API and infrastructure monitoring.
No agents to install and nothing to open on your firewall. If your cron job, crontab entry, or scheduled task can make an HTTP request, you’re one line away from full monitoring on Linux, Windows, or any platform.
Add a Custom Collector in your dashboard and tell us the schedule you expect — a cron expression, an interval, or a time of day.
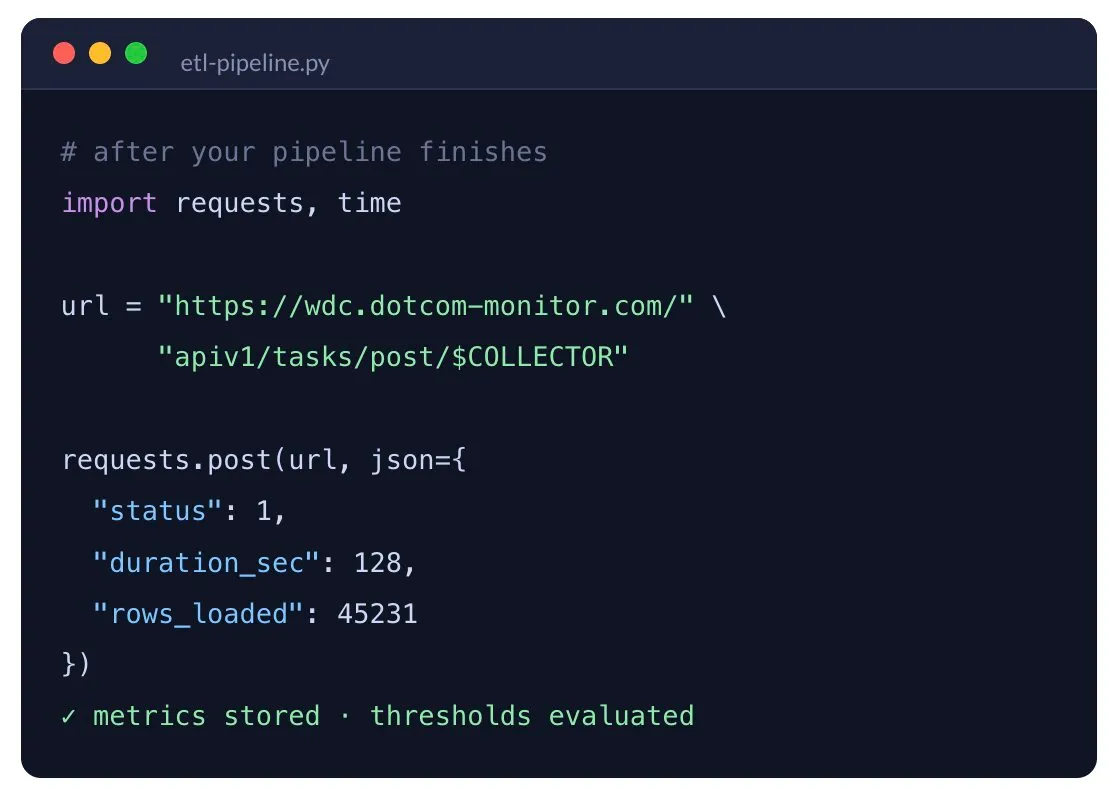
Add a single HTTP POST to the end of your script or task. Include any metrics you care about as name/value pairs.
We track every run. If a heartbeat is late, missing, too slow, or reports a failure, you get an instant alert.
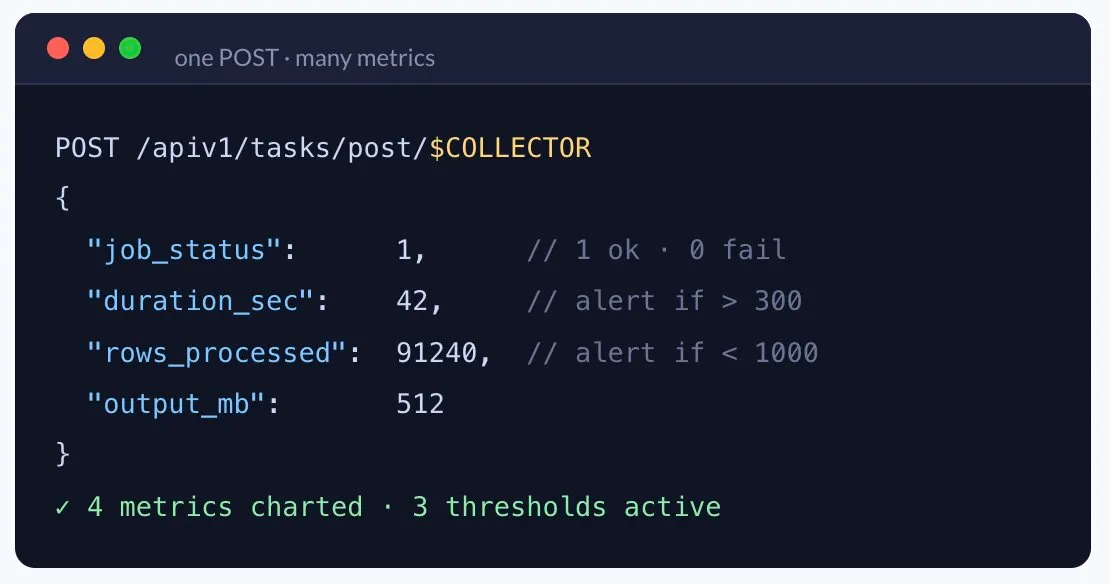
The same heartbeat carries as many metrics as you want. Set a threshold on any of them — alert when status reports failure, when duration_sec exceeds a limit, or when rows falls below what you’d expect from a healthy run.
Works from a Bash script, a Python job, a Windows Task, a Docker container, a Kubernetes CronJob, or a serverless function — anything that can call a URL.
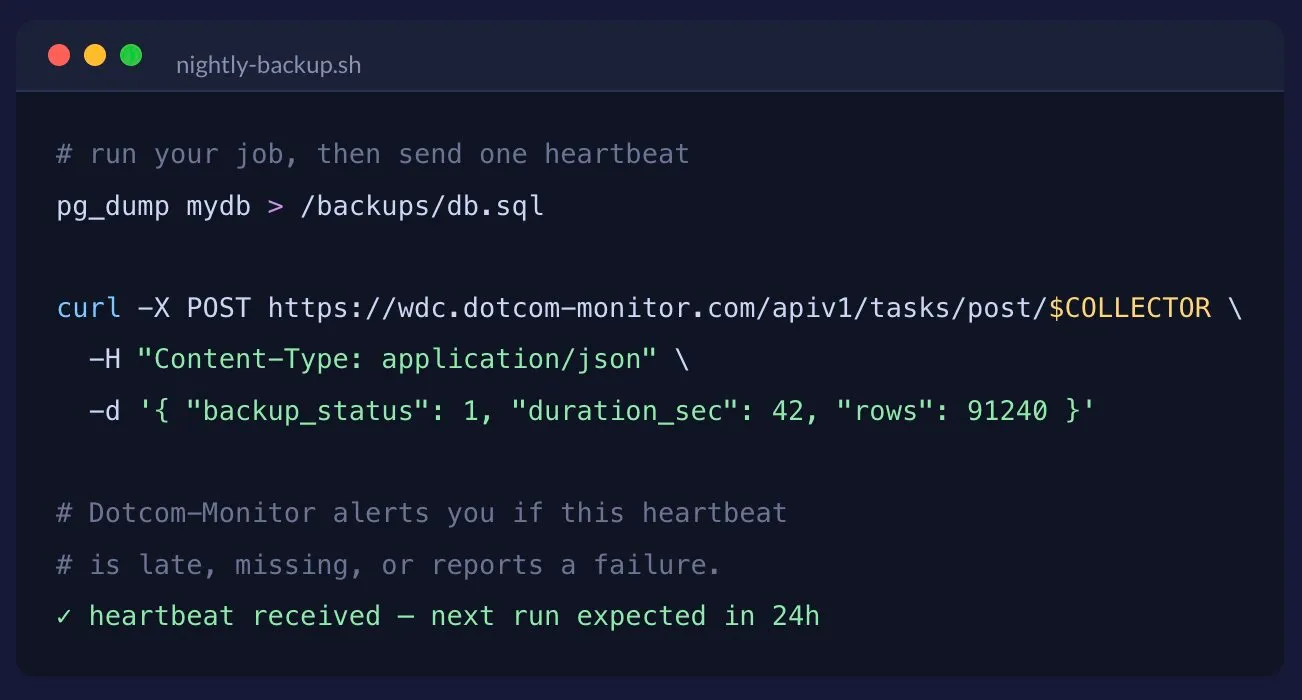
To monitor cron jobs on Linux, chain a single curl heartbeat onto the end of your existing crontab entry. It fires only when the job actually runs — so if the run is skipped, the machine is down, or the command fails, no heartbeat arrives and you get alerted. Open your crontab with crontab -e and add:
					# run the backup at 2:00 AM, then send a heartbeat
0 2 * * * /opt/scripts/backup.sh && \
  curl -fsS -m 10 "https://wdc.dotcom-monitor.com/apiv1/tasks/post/$COLLECTOR" \
  -d '{ "backup_status": 1 }'
That’s it — Dotcom-Monitor now expects a heartbeat from this crontab entry on its schedule and alerts you the moment one is late or missing. The same approach works for Windows Task Scheduler (call the URL with PowerShell) and macOS launchd.
Verify nightly backups actually complete — and that the output isn’t suspiciously small. Alert on any missed or oversized run.
Track imports, exports and transforms. Watch duration and records processed, and catch slowdowns or silent failures early.
Make sure scheduled reports and billing runs finish on time — and alert if a run is skipped or produces an empty file.
Confirm scans run on cadence and return expected results. Alert on failures or unusual spikes in scan duration.
Have IoT and edge devices ping in when healthy. A missing heartbeat instantly flags a device or connection that’s dropped.
Watch background workers and long-running services. Send a status of 0 the moment a process stops and get paged right away.
Windows, Linux, macOS, Docker, Kubernetes, serverless, IoT — if it can send an HTTP POST, it can be monitored. No agents, no extra infrastructure.
Each heartbeat can carry multiple name/value pairs — duration, output size, records processed, or any measurement your job produces. Every value is stored and charted over time.
Set a per-metric threshold and let each one trigger its own alert. If your script detects a problem, send 0 for a status metric to fire an immediate notification — no matter what the schedule says.
All reviews sourced from Capterra verified reviews. Ratings as of October 2026.
Cron job monitoring tracks your scheduled tasks by receiving heartbeats — simple HTTP requests your job sends when it runs. You define the schedule you expect using cron expressions, intervals, or specific times. If a heartbeat arrives late or never arrives, Dotcom-Monitor alerts you immediately. It works with anything that can send an HTTP POST, from database backups to ETL pipelines.
About three minutes. Create a monitor in your dashboard, define the expected schedule, and add a single HTTP POST to the end of your script or task. Once configured, you start receiving heartbeat data and alerts right away — no agents to install.
It’s completely platform-agnostic. Windows, Linux, macOS, Docker containers, Kubernetes, serverless functions, and IoT devices — any system that can reach the internet and make an HTTP request can integrate with the platform.
Yes. Send multiple name/value pairs with each heartbeat — execution duration, records processed, output size, or any custom KPI. Each metric is stored, charted, and can have its own threshold-based alerts, so you can alert when duration exceeds a limit or record counts fall below expectations.
Email, SMS, voice calls, Slack, Microsoft Teams, PagerDuty, and webhooks. Alerts support escalation policies, so if an issue isn’t acknowledged, notifications automatically escalate to the next person or channel.
Dotcom-Monitor sends an immediate alert based on your rules. You can alert on late or missing runs when a job doesn’t report within its window, and on jobs that exceed a maximum duration — helping you catch performance regressions and capacity issues early.
Add a single curl request to the end of your crontab entry so it sends a heartbeat when the job runs — for example 0 2 * * * /path/backup.sh && curl -fsS https://wdc.dotcom-monitor.com/apiv1/tasks/post/$COLLECTOR. Dotcom-Monitor expects that heartbeat on schedule and alerts you if it’s late or missing. No agent is installed on the server, and the same method works for Windows Task Scheduler and macOS launchd.
A failed or skipped cron job is silent — nothing errors out, so you can’t tell from the server alone. With heartbeat monitoring, the heartbeat only fires on a successful run. If the job fails, the machine is down, or cron never triggers it, no heartbeat arrives within the expected window and you’re alerted automatically. You can also send a status value of 0 from your script to flag a failure explicitly.
They refer to the same thing. “Crontab monitoring” emphasizes the Linux/Unix crontab file where cron jobs are defined, while “cron job monitoring” is the general term for watching any scheduled task. Dotcom-Monitor covers both — plus Windows Task Scheduler, Kubernetes CronJobs, serverless schedules, and any other job that can send an HTTP request.
Yes — a 30-day free trial with no credit card required. All premium features are included, and you get 24/7 expert support throughout the trial.
Set up your first cron job monitor in about three minutes and never miss a critical run again.