Home » Products » API Monitoring » GraphQL API Monitoring
- GraphQL API Monitoring
- Errors array · payload-aware
GraphQL API Monitoring That Catches the Failures HTTP 200 Hides
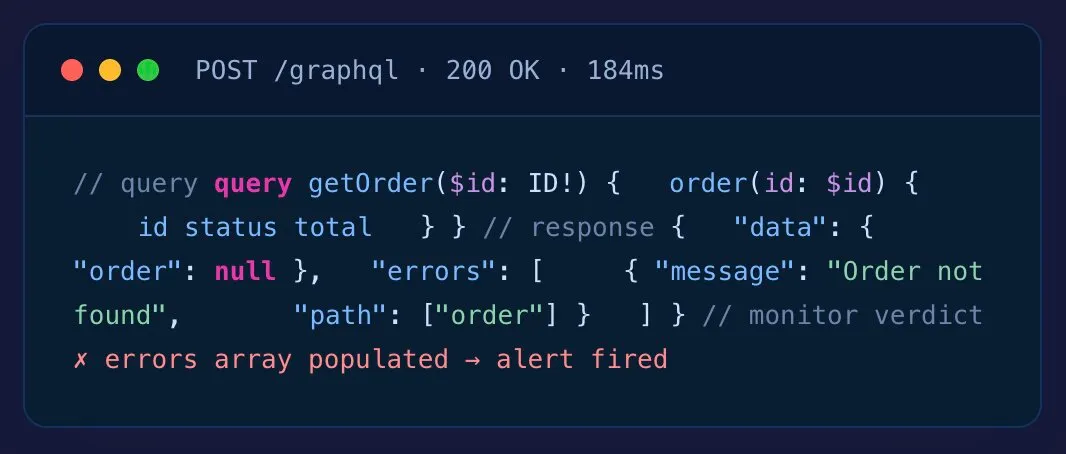
Dotcom-Monitor GraphQL API monitoring sends real queries, inspects the errors array, validates data shape, and catches the partial failures uptime monitoring misses — most GraphQL servers return 200 even when the query crashes.
- Query & mutation aware
- Federation / subgraph support
- OAuth, JWT, Bearer native
- Cancel anytime · No auto-charge after trial
Why GraphQL is different
HTTP 200 Doesn’t Mean the Query Worked
GraphQL’s big win — one endpoint, flexible queries — is also why uptime-only monitoring lies to you. The failure mode that matters lives in the response body, not the status code.
What Uptime-Only Monitors See
- HTTP 200 OK — endpoint reachable, "everything’s fine"
- One green check regardless of what came back
- No visibility into the errors array, null data fields, or partial failures
- Customer complaints still arrive before alerts do
What Dotcom-Monitor Sees
- HTTP 200 + errors[].length > 0 → failure flagged
- Null in a non-nullable field → partial failure flagged
- data.something.status != "expected" → assertion failure flagged
- Query latency P95 above baseline → performance regression flagged
Payload-aware monitoring
Inspect What Came Back. Not Just Whether It Came Back.
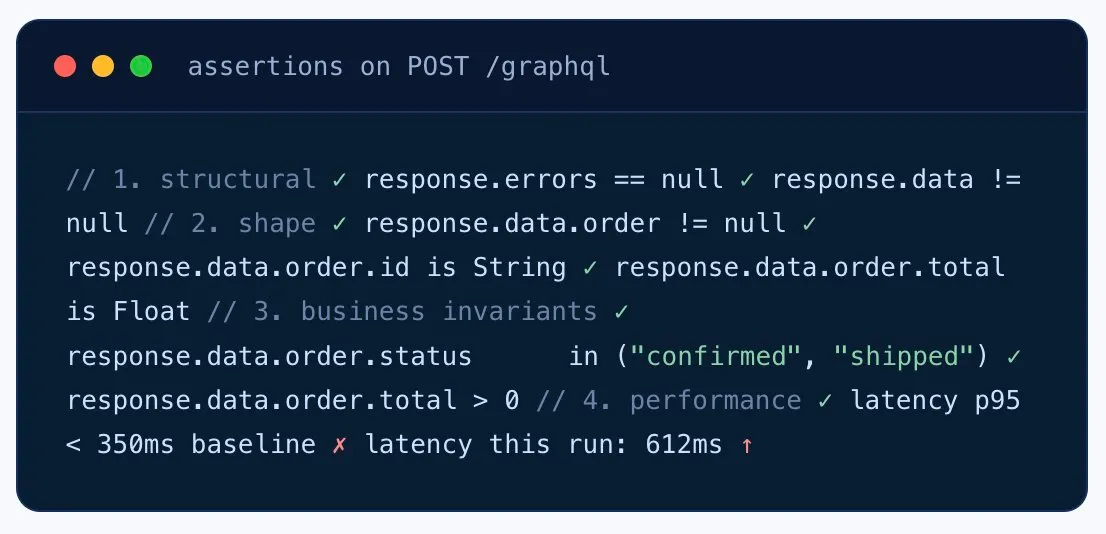
Send a defined query payload, then assert against the response body. Every monitor knows whether the errors array showed up, whether data contains the shape you expected, and whether business invariants hold.
-
Errors array detection — flag any 200 response where
errors[].length > 0. -
Data shape validation — JSONPath assertions on the
datatree to catch null fields and missing keys. -
Business invariants — assertions like
data.order.status == "confirmed". - Latency percentiles per operation — track P95/P99 per query, not just the whole endpoint.
Federation & subgraphs
Catch Which Subgraph Broke When the Federated Query Fails.
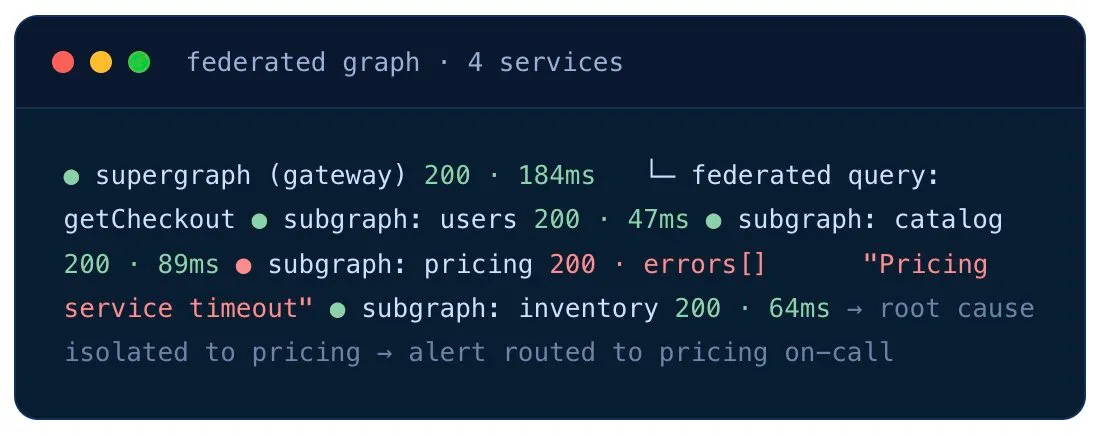
A federated GraphQL setup hides downstream service failures behind the gateway. Monitor the supergraph to detect customer-facing failure — and the individual subgraphs to pinpoint which service is the culprit.
- Supergraph endpoint monitoring — confirms the federation gateway is up and federation logic works.
- Per-subgraph monitoring — individual checks against each underlying service.
- Pinpoint failures faster — when the gateway alert fires, the subgraph monitors tell you which service broke.
- BFF pattern — monitor mobile/web BFF GraphQL services from inside the VPC with Private Agents.
Use cases
Where GraphQL Monitoring Earns Its Keep
Mobile-App BFF Endpoints
The single GraphQL endpoint your mobile app depends on. Catch the silent partial failure that returns 200-with-errors and ships a blank screen to users.
Federated Graphs (Apollo, Etc.)
Supergraph + subgraphs monitored separately. When the federated query breaks, the subgraph monitors tell you which downstream service to wake up.
Critical Mutations
placeOrder, processPayment, submitClaim — the mutations that move money or state. Monitor each one individually, asserting on the data invariants.
Post-Deploy Schema Validation
Run the monitor from CI after every deploy. Catch the schema change that silently nulls a field, or the resolver rename that breaks the mobile app.
Resolver Performance Tracking
Track latency P95/P99 per query. Spot the expensive resolver creeping above baseline before the mobile app reviews tank.
Subscription Health
For WebSocket-based GraphQL subscriptions, check that the connection establishes, receives messages, and stays alive — using our WebSocket monitoring.
Not ready for a trial?
Want a 15-Minute Walkthrough First?
A performance engineer will walk you through GraphQL monitoring with errors-array detection and federation routing — no sales pitch, just a working monitor by the end of the call.
Fits your stack
Routes Alerts Into Your Incident Tools
Slack
PagerDuty
Microsoft Teams
Opsgenie
Webhook
Email / SMS
Grafana
Prometheus
GitHub Actions
Jenkins
Azure DevOps
Power BI
Global monitoring network
Run Your Queries From Where Your Users Are
30+ owned monitoring locations across six continents. Spot the regional CDN issue or the edge gateway routing fault that local testing misses.
For internal BFF GraphQL services and backend-only graphs, deploy a Private Agent inside your VPC — same monitoring depth, no inbound firewall rules.
30+
Global monitoring locations
6
Continents covered
1 min
Minimum check interval
Private Agents
For behind-firewall

What teams say
From Engineers Who Run Production GraphQL
"I absolutely love the comprehensive monitoring services Dotcom-Monitor provides. The real-time alerts and detailed performance analytics have been a game-changer for our website's uptime and speed. The global monitoring feature ensures that our site is optimized everywhere, and the intuitive dashboard makes it easy to track performance. Their customer support is exceptional — always responsive and efficient."
Tomer C.
Managing Director · Facilities Services
Verified Capterra review · March 2025
"One of Dotcom's best features is the push/pull API capabilities that provide us with network performance data. We use this to monitor for performance issues as well as page loading stats. Dotcom-Monitor allows us to monitor multiple services within one interface and platform. It's allowed us to operate more efficiently."
Gregory S.
Manager · Broadcast Media
Verified Capterra review · May 2020
"I have been thoroughly impressed with the level of detail and comprehensiveness of the reports generated by the software. Moreover, the support team at Dotcom-Monitor has exceeded my expectations. On almost a daily basis, I reach out with various questions and they have consistently demonstrated unwavering patience, providing detailed and insightful answers."
Shirin R.
Software Test Engineer · Computer Software
Verified Capterra review · February 2023
"I'm a network analyst and use Dotcom tools inside the ISP I work, it's a really good and reliable tool for monitoring things along the network, and testing network components, I usually use it to make diagnostics of servers latency, and dns resolve time."
Leonardo J.
IT & Network Infrastructure Analyst Internet
Verified Capterra review · October 2022
4.5
Capterra
82 reviews
4.6
Ease of Use
Capterra Score reviews
4.6
Customer Service
Capterra Score reviews
All reviews sourced from Capterra verified reviews. Ratings as of July 2026.
Want to kick the tires without committing? Free Forever plan available — up to 25 targets, 2 monitoring locations, 7 days of data retention. Get started free → or Compare plans
Frequently asked questions
GraphQL Monitoring Questions Before Signing Up
Why is monitoring GraphQL different from REST?
Most GraphQL implementations return HTTP 200 even when the query fails. Failures live inside the response body — in the errors array, or as nulls inside the data object — not in the status code. Uptime-only monitoring marks failing GraphQL APIs as healthy. Real GraphQL monitoring has to inspect the response payload. See REST API monitoring →
How does Dotcom-Monitor detect GraphQL errors?
Send a specific query payload, then assert against the response body. Check whether the top-level errors array is present or populated, validate query-specific data invariants in the response, and flag nulls in non-nullable fields. Some GraphQL servers encode domain failures inside the data object rather than populating errors — both signals are checked.
Can I monitor a specific query or mutation?
Yes. Each monitor runs a defined query or mutation payload. Monitor your most critical mutations (placeOrder, processPayment) individually to track per-operation latency, error rate, and partial failure rate.
What authentication does GraphQL monitoring support?
All common auth schemes: Bearer Token (the most common for GraphQL), OAuth 2.0 with automatic refresh, JWT, API Key, Basic Auth, AWS Signature v4, mTLS, and custom headers. Secrets are masked through Secure Vault. See auth matrix →
Can I monitor a federated GraphQL schema?
Yes. Monitor the supergraph endpoint to verify the federation gateway is healthy, and monitor individual subgraph endpoints to isolate which service is failing when a federated query breaks. Works with Apollo Federation and similar architectures.
Does GraphQL monitoring catch slow resolvers?
Total query latency is tracked, with P95/P99 percentiles per query. To pinpoint individual slow resolvers, pair monitoring with your APM tracing — synthetic monitoring confirms the customer-facing slowness; APM confirms which resolver is the bottleneck.
Can I monitor private / internal GraphQL APIs?
Yes. Deploy Private Agents inside your VPC or datacenter — common for backend-for-frontend (BFF) GraphQL services that aren’t publicly exposed.
What about query complexity / depth attacks?
Monitoring can include queries at various depths and complexity levels to verify your throttling and complexity limits are enforced. Pair with your WAF or query-complexity middleware for full protection.
Can I monitor GraphQL subscriptions?
GraphQL subscriptions typically use WebSocket — see our WebSocket monitoring for connection establishment, message delivery, and keepalive checks.
How does Dotcom-Monitor handle Apollo Federation?
Monitor the supergraph endpoint to verify the federation gateway is healthy AND monitor individual subgraph endpoints separately to isolate which downstream service fails when a federated query breaks. Both monitors share alerting routes for consolidated incident response.
Can I monitor GraphQL subscriptions?
GraphQL subscriptions use WebSocket transport. Use our WebSocket monitoring product to validate that the subscription connection establishes correctly, receives expected events, and stays alive across long-running sessions.
Does it support persisted queries?
Yes. Configure persisted query identifiers (Apollo Persisted Queries or Relay-style hashes) in the request and Dotcom-Monitor will send them as the operation reference rather than the full query string.
How do I monitor query complexity limits?
Build monitors at increasing query depth and complexity to verify your complexity-limit middleware enforces the threshold correctly. Pair monitor configuration with your GraphQL server complexity rules.
Monitoring more than GraphQL? See the full API Monitoring platform →
Don't Let Your GraphQL API Return 200 OK on Failure Unnoticed
30-day free trial. No credit card. Payload-aware monitoring from 30+ global locations.
- 10,000+ organizations
- Monitoring leader since 1998
- 99.99% Uptime SLA