33
Monitoring locations
18
Countries
6
Continents
75 / 48
Nodes on IPv4 / IPv6
Monitoring locations
Countries
Continents
Nodes on IPv4 / IPv6
Our global monitoring network is the set of 33 monitoring locations Dotcom-Monitor runs checks from — 18 countries, 6 continents, each one a monitoring node in a commercial data center with its own published IP addresses. When you configure a monitor, you choose which of these locations run it. Each selected location executes the full check independently and reports its own timings, status codes and errors, so a problem that only exists in one part of the world shows up as a problem in one part of the world.
Locations run every check type the platform supports: real-browser page loads and multi-step EveryStep transactions, REST, SOAP and GraphQL API calls, and protocol-level checks such as DNS, SSL, SMTP, FTP, TCP port, ping and traceroute. There is no reduced feature set at the edge — a check in Sydney is the same check as a check in Chicago.
One clarification, because the names look alike. This page is about where we monitor from: our own infrastructure and its geographic coverage. It is not about monitoring the network you own. If what you need is reachability, latency, routing and packet-loss checks against your own hosts, routers and circuits — ping, traceroute and TCP port monitoring pointed at your infrastructure — that is network monitoring, and it has its own page. The two work together: network monitoring is what you check, the global monitoring network is where you check it from.
All 33 locations, grouped by region. Every one of them is available to every monitoring device in your account — there is no premium tier of “global” locations held back from lower plans.
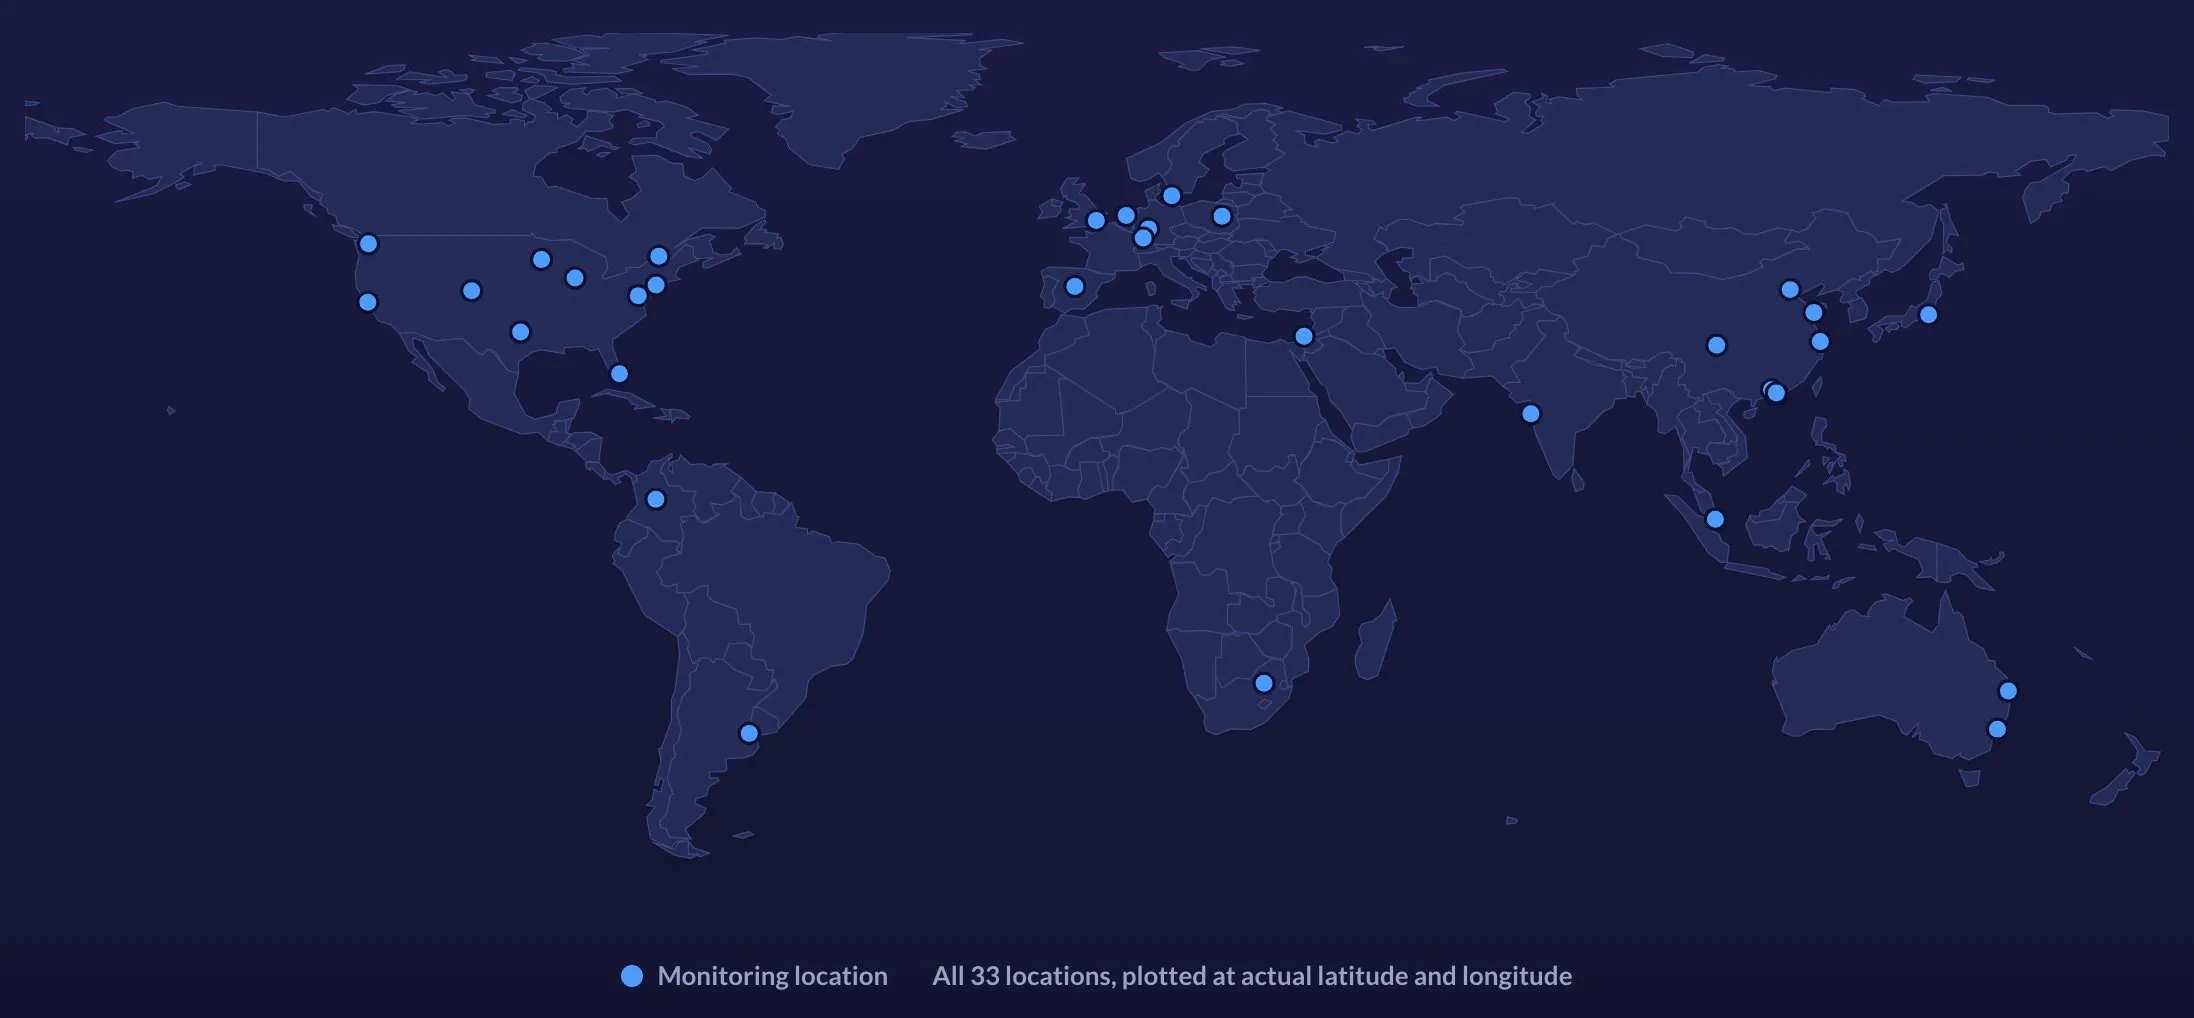
The map is a visual index. The authoritative list is the text below it — and in your account, where each location appears by name in the device configuration screen.
Need our IPs? Most teams want them for two reasons: to filter synthetic traffic out of their analytics, and to allow our agents through a WAF or firewall. The current IPv4 and IPv6 ranges for every location are published and maintained in the knowledge base — see the monitoring location IP addresses article. We deliberately keep them there rather than on this page, because addresses change and that article is the maintained source of truth. Those addresses also let you check our hosting for yourself: look any of them up in whois or RDAP and you will see the network and provider that location sits on.
Across the 33 locations we run 75 monitoring nodes on IPv4 and 48 on IPv6. Twenty-six of the 33 locations answer on both protocols, so most of the network is genuinely dual-stack rather than IPv4-with-a-tunnel. Seven locations are IPv4-only — Buenos Aires, Warsaw, Tel Aviv, Hong Kong, Qingdao, Tokyo and Singapore — and one node, in San Francisco, is IPv6-only with no IPv4 address at all.
The IPv6-only node is the one that matters. On a dual-stack host, a client that fails over IPv6 usually falls back to IPv4 fast enough that nothing looks broken — Happy Eyeballs hides the failure by design. So a dual-stack probe can report a healthy site while your IPv6-only users cannot reach it. An IPv6-only probe has nowhere to fall back to: if the AAAA record is missing, the record points at the wrong address, the firewall rule was written for v4 only, or the load balancer never got a v6 listener, the check fails and you find out.
This is not a theoretical audience. Large mobile carriers run IPv6-only access networks with NAT64 at the edge, and enterprise and government procurement in several countries mandates IPv6 reachability. Single-stack monitoring never sees any of it.
What you can test | Where it runs | What it catches |
|---|---|---|
IPv4 checks | 75 nodes across all 33 locations | The baseline every vendor covers — reachability, latency and routing over IPv4 from six continents. |
Dual-stack checks | 48 IPv6 nodes across 26 locations | Differences in latency, routing and TLS behaviour between the two protocols from the same city. |
IPv6-only checks | One node in San Francisco, no IPv4 address | Missing or wrong AAAA records, v4-only firewall and WAF rules, load balancers with no v6 listener — failures that IPv4 fallback hides everywhere else. |
Every node’s address is published: the IPv6 addresses for each location sit alongside its IPv4 addresses in the monitoring location IP addresses article, which is where the node counts above come from. You can count them yourself.
Single-location monitoring answers one question: is the site up for that one machine? Everything below is invisible to it.
Cloud regions, transit providers and IX peering fail regionally, not globally. An outage in eu-central affects your European customers while every US check stays green. Without European probes, your first signal is a support ticket.
Both are geographic systems by design. A stale edge cache, a misrouted PoP or a bad GeoDNS answer affects one region at a time. You detect it by comparing the same check across continents.
A page that renders in 1.2s from Chicago can take 5s from Sydney or Johannesburg — TLS round trips, distance and uncached assets compound. Per-location baselines tell you which markets need an edge presence.
Some obligations are geographic: proving availability to customers in a specific country, verifying that geo-restricted content behaves correctly, or evidencing SLA compliance from where the customer actually is.
The fastest way to make an on-call team ignore your monitoring is to page them for a blip on one probe. A single failed check is not evidence that a site is down — it is evidence that one path between one machine and your site failed once. Those are different claims, and the network gives you the second one constantly: a transient route flap, a momentary packet loss event, a rate-limited edge node, a resolver hiccup.
Multi-location verification resolves the ambiguity before an alert leaves the platform:
The check is recorded as an error at that location, with the full response, headers and timing captured for the postmortem. Nothing is sent yet.
The same device, same script, same thresholds — executed from independent monitoring locations on different networks, in different countries.
If the other locations succeed, the failure was local to one path and the incident is not opened. If they fail too, the outage is real and confirmed from multiple continents.
The notification carries the evidence with it — which locations failed, which succeeded, and what each one saw — routed through your alerting rules and escalation schedule.
The result is an alert your team can act on without checking it by hand first. It also makes the opposite case: when several locations fail and a couple succeed, you are not looking at a total outage — you are looking at a regional one, and the list of which locations failed is already the first clue about where.
Our 33 public locations reach anything the public internet can reach. Intranet applications, internal APIs, staging environments and infrastructure behind a firewall are, by design, not on that list.
For those, install a private agent — the same monitoring node software, running on your own hardware inside your own network. It appears in your account as another monitoring location, feeds the same dashboards, reports and alerts, and communicates outbound only, so no inbound firewall rules are needed. Teams commonly run the same check from a public location and a private agent at once: when the public check fails and the internal one passes, the fault is between your perimeter and the internet, not in the application.
Run monitoring from inside your firewall against internal apps, APIs and infrastructure the public internet cannot reach.
Ping, traceroute and TCP port checks pointed at your own hosts and routes — outside-in and inside-out.
Route confirmed incidents to the right on-call person through email, SMS, phone, Slack, PagerDuty and webhooks.
From 33 monitoring locations in 18 countries across 6 continents: 10 in North America, 7 in Europe, 12 across Asia and the Pacific, and 4 across South America, the Middle East and Africa. Every location is named on this page, and the current IP addresses for each are published in the monitoring location IP addresses knowledge base article.
Yes, per monitoring device. You select the locations when you create or edit a device, and you can change the selection at any time. Most teams pick a handful that mirror where their users actually are, then add locations to investigate a specific market. Each selected location runs the check on your chosen interval and reports its own results, so you can compare them side by side.
Yes. We run 75 monitoring nodes on IPv4 and 48 on IPv6. Twenty-six of the 33 locations are dual-stack and answer on both protocols; the seven that are IPv4-only are Buenos Aires, Warsaw, Tel Aviv, Hong Kong, Qingdao, Tokyo and Singapore. One node, in San Francisco, is IPv6-only with no IPv4 address at all. That IPv6-only node is the one that catches missing AAAA records, IPv4-only firewall rules and load balancers without a v6 listener — failures that IPv4 fallback masks on every dual-stack probe.
All of them. Every monitoring location is available on every plan; there is no geographic tier that holds back “global” locations. What differs between plans is the number of monitoring devices and how frequently they run — see pricing for the current limits, or start a free trial and configure the locations you need.
Yes, using private agents. A private agent is the same monitoring node software installed on your own hardware inside your network, so it can reach intranet applications, internal APIs and firewalled infrastructure. It shows up in your account as an additional monitoring location and feeds the same reports and alerts as our public locations, communicating outbound only.
When one location reports a failure, the platform re-runs the same check from other locations before opening an incident. If the others succeed, the failure was local to one network path and no alert is sent. If they fail as well, the outage is confirmed from independent networks on different continents and the alert fires with the per-location evidence attached. That is the difference between a page you can act on and a page you learn to ignore.
Start a 30-day free trial, point a monitor at your site and select every location you care about. No credit card required.
Full platform access during the trial — all monitoring locations, all check types, no credit card required.