- Product · Lighthouse Score Monitoring
Lighthouse Monitoring: Google Lighthouse Scores Tracked on a Schedule, With Alerts When They Drop
A Lighthouse run in Chrome DevTools or PageSpeed Insights tells you the score right now. Dotcom-Monitor runs Google Lighthouse against your page on a schedule, as often as every minute, from your choice of 33 locations, and keeps every report. Pick the score or metric to track, set a minimum or maximum, and get an alert when a run crosses it.
Performance, SEO, Accessibility and Best Practices scores, plus Largest Contentful Paint, Cumulative Layout Shift, Total Blocking Time and the other lab metrics are charted over time, so a drop after a release is visible the day it happens.
- No credit card
- Every feature, every location and every monitoring type is included in the trial
- Trusted by 10,000+ organizations
- 99.99% uptime SLA
- G2 Top Performer
- Website monitoring leader since 1998
Shortest audit interval
Lighthouse scores and metrics you can alert on
Monitoring locations, 6 continents
Of the Lighthouse report kept per run
What Lighthouse Monitoring Is
Lighthouse monitoring is the automated running of Google Lighthouse against a web page on a fixed schedule, with every report kept and an alert sent when a chosen score or metric crosses a threshold. Dotcom-Monitor’s Lighthouse monitoring tool does this from 33 locations, as often as every minute, for the Performance, SEO, Accessibility and Best Practices scores and the lab metrics behind them. Every run uses the same audit settings and locations, so a drop shows as a change against the page’s normal score, with that run’s report attached.
Dotcom-Monitor Lighthouse Monitoring at a Glance
Lighthouse Report, on the BrowserView platform, one URL per device
Every 1 minute to every 3 hours, per device
33 monitoring locations on 6 continents
Google Lighthouse in Chrome, desktop audit profile
One of 12 scores or metrics per device, chosen from the four category scores and eight performance metrics
Minimum and/or maximum for the chosen metric; a run outside the range is an error
The complete Lighthouse report, every category and audit, plus the network waterfall of the audit
Email, SMS, phone, Slack, Teams, PagerDuty, ServiceNow, webhooks, mobile app
To monitor Lighthouse scores for a page, you create a Lighthouse Report device, enter the URL, pick the score or metric to report on, and set the range you consider acceptable. From then on Dotcom-Monitor runs Lighthouse against that page on your schedule and from the locations you selected. Each run stores the full Lighthouse report, the one you would see in Chrome DevTools, with all four categories and every audit inside them. The selected metric is charted over time, feeds scheduled daily, weekly or monthly reports, and triggers an alert when it leaves the range.
What it is not. It does not crawl your site. It audits the specific URLs you configure: home page, key landing pages, the pages your SEO reports are built on. It measures lab data, not the field data from Chrome users that Google’s page-experience signal uses; the lab vs. field section explains why you want both. If you need page load time in 40+ desktop and mobile browsers with a waterfall synced to video, that is website performance monitoring. The product fit section has the full comparison.
One-Off Lighthouse Audit vs. Lighthouse Monitoring
Chrome DevTools, PageSpeed Insights, the Lighthouse CLI and browser extensions all run the same audit. They report what the page scored on the run you started, from the machine and network you ran it on. They cannot tell you that the Performance score fell from 91 to 62 on Wednesday afternoon, or that SEO dropped to 75 after a template change added noindex. They also run from one place, so a page that scores 40 points lower from Sydney than from Dallas looks fine from Dallas. A monitor that keeps every run answers those questions and dates them.
Question | DevTools / PageSpeed Insights run | Dotcom-Monitor Lighthouse monitoring |
|---|---|---|
What does this page score right now? | Yes | Yes, every minute if you want |
Did the score drop after the last release? | Only if someone remembered to run it before and after | Yes, every run is kept; the trend shows the day it changed |
Will someone be told when Performance falls below 70? | No | Yes, by email, SMS, phone, Slack, Teams, PagerDuty or webhook |
Does it score differently from other regions? | One run from one place | Yes, 33 locations you choose from |
Which audit failed, and what was the fix suggested? | In that one report | In every report, including the run that triggered the alert |
Can I show a month of LCP or CLS values on one chart? | Manual spreadsheet | Yes, trend charts, dashboards and scheduled reports |
Can I audit a staging server or a specific origin? | DevTools only, from your own machine | Yes, custom DNS host mapping per device |
Does it audit 20 pages on a schedule without anyone running it? | No | Yes, one device per page, with the same alert groups and reports |
What Lighthouse Monitoring Catches
Every run is a complete Lighthouse audit, so all four categories are recorded on every run. Customers set the threshold on one of them and use the stored reports to explain the rest.
Performance Score Drop After a Deploy
A new tag manager container, an unoptimized hero image or a render-blocking font loader can take 20 points off the Performance score. With a minimum threshold set, the first run that records the drop sends an alert with the report that names the failed audit.
LCP Regression on a Key Landing Page
Monitor Largest Contentful Paint directly, in milliseconds, with a maximum of 2,500 ms, the boundary Google calls “good”. The trend chart shows whether LCP crept up over weeks or jumped on one day, which usually points at the change that caused it.
Layout Shift Introduced by a Banner or Ad Slot
Cumulative Layout Shift is a lab metric Lighthouse computes on every run. A cookie banner that loads late or an ad slot without reserved height pushes CLS past 0.1, and the report shows which elements shifted.
SEO Score Drop From a Template Change
A noindex tag left in from staging, a missing meta description, a broken canonical, non-crawlable links or an hreflang error each fail an SEO audit. The score drops on the next run, and the report lists the failed audit and what to fix.
Accessibility Regressions
Missing alt text, insufficient color contrast, form fields without labels, and ARIA misuse are caught by the Accessibility audits. Set a minimum Accessibility score and find out when a redesign or a new component pushes it down.
Mixed Content, Console Errors, Deprecated APIs
Best Practices audits flag HTTP resources on an HTTPS page, JavaScript errors logged in the console, missing image aspect ratios, and third-party cookies or deprecated APIs. These often ship unnoticed because the page still looks fine.
Third-party script bloat. Total Blocking Time is the lab metric most sensitive to heavy JavaScript. Monitoring TBT with a maximum of 200 to 300 ms catches the tracking tag or chat widget that doubled main-thread work, before it shows up as a worse Interaction to Next Paint in your field data.
How It Works
One Lighthouse Report device monitors one URL for one metric. Setting one up takes a few minutes; add more for other pages or other metrics.
Create a Lighthouse Report Device
In your account, add a new device, choose Website, then Lighthouse Report. Single Web Page is website performance monitoring, Multiple Step Journey is web application monitoring, and HTTP/S is uptime monitoring.
Enter the URL
Type it exactly as a browser would, including https:// and any query parameters. Add a description so the device is recognizable in reports. Under DNS Options you can choose how names are resolved and map a hostname to a specific IP, so the audit hits a staging server or one origin behind a load balancer.
Choose the Report Metric
Pick the score or metric this device tracks and alerts on: Performance, Accessibility, Best Practices or SEO overall score, or one of the performance metrics such as Largest Contentful Paint, Cumulative Layout Shift, Total Blocking Time, First Contentful Paint or Speed Index. Every run still stores the complete report; this choice only decides what is charted and alerted on.
Set the Error Thresholds
Enter a Min Threshold, a Max Threshold, or both. Scores run 0 to 100, so a Performance minimum of 65 flags any run scoring 64 or lower. Time metrics are in milliseconds, so an LCP maximum of 2500 flags anything slower than 2.5 seconds. Set Alert on Lighthouse Errors to Yes to also treat a run where Lighthouse could not complete the audit as an error, or No to ignore those runs.
Choose Locations and Frequency
Select any of the 33 monitoring locations and an interval from one minute to three hours. Locations rotate: a 15-minute interval across four locations gives a fresh report from a different location every 15 minutes, and each location's history is filterable on its own.
Get the Alert With the Report
When a run lands outside the threshold, the notification identifies the device, the metric value and the location, and links to the session with the full Lighthouse report. Route it through alert groups and escalation to email, SMS, phone, Slack, Microsoft Teams, PagerDuty, ServiceNow or a webhook.
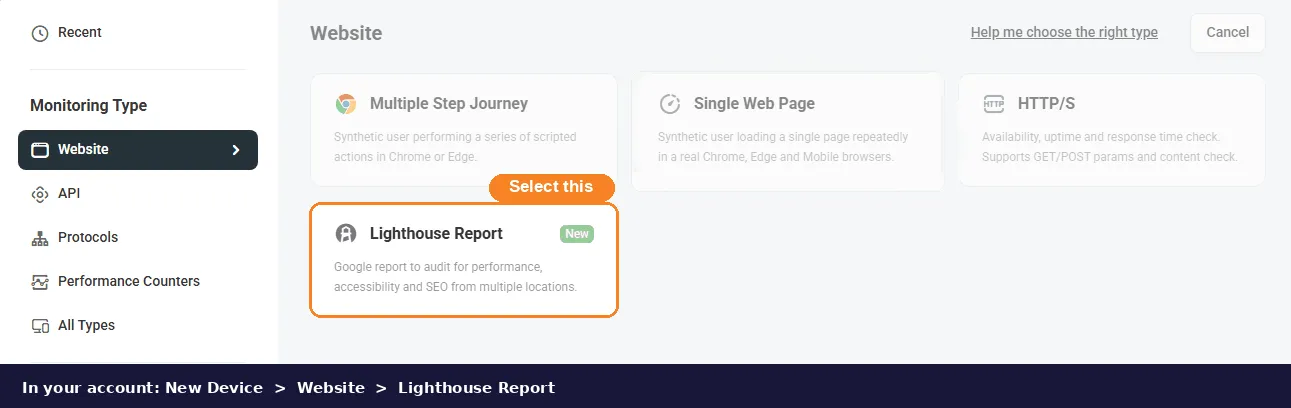
The device type to choose: Website, then Lighthouse Report.
Illustration of the device trend chart
- 90 and above
- 65 to 89
- Below threshold, alert sent
Which Lighthouse Scores and Metrics You Can Monitor
Each device charts and alerts on one Report Metric. The complete report, with every category and audit, is stored on every run regardless of which metric you pick. To alert on two metrics for the same page, for example Performance score and LCP, create two devices.
Category Scores (0 to 100)
Performance Overall Score
Lighthouse’s weighted blend of its performance metrics, per Google’s performance scoring. The number most SEO and marketing reports quote. Lighthouse colors 90 to 100 green, 50 to 89 orange, below 50 red.
SEO Overall Score
Passes and failures across the SEO audits: title and meta description, crawlability and robots.txt, canonical, hreflang, descriptive link text, crawlable anchors, viewport meta tag, valid status code.
Accessibility Overall Score
Automated accessibility checks: image alt text, color contrast, form labels, ARIA attributes, heading order, language attribute, focusable elements.
Best Practices Overall Score
HTTPS and mixed content, console errors, deprecated APIs, image aspect ratios and resolution, third-party cookies, browser errors logged to the console.
Core Web Vitals Lab Metrics
Largest Contentful Paint (LCP)
Milliseconds until the largest image or text block in the viewport is rendered. The primary loading metric in Google’s page-experience signal.
Google’s “good” boundary: 2,500 ms or less; poor above 4,000 ms (web.dev)
Cumulative Layout Shift (CLS)
How much visible content moved while the page loaded, as a unitless score. Late-loading banners, ads and fonts without size reservations are the usual causes.
Google’s “good” boundary: 0.1 or less; poor above 0.25 (web.dev)
Total Blocking Time (TBT)
Milliseconds the main thread was blocked by long tasks between First Contentful Paint and Time to Interactive. Lighthouse’s lab stand-in for responsiveness; heavy JavaScript raises it.
Lighthouse “good” boundary: 200 ms or less; poor above 600 ms (Chrome docs)
Other Performance Metrics
First Contentful Paint (FCP)
Milliseconds until the browser renders the first piece of DOM content. Good is 1,800 ms or less.
Speed Index
How quickly the visible content of the page is painted, in milliseconds, computed from frame-by-frame visual progress. Good is 3,400 ms or less.
Time to Interactive (TTI)
Milliseconds until the page has rendered and the main thread is free enough to respond to input reliably. Good is 3,800 ms or less.
First Meaningful Paint (FMP)
Milliseconds until the primary content is visible. Retained for continuity with older Lighthouse versions and for devices that already track it.
Max Potential First Input Delay
The longest task on the main thread after FCP, in milliseconds: the worst-case delay a user could experience on their first interaction.
Every Other Audit in the Report
Render-blocking resources, unused JavaScript and CSS, image formats and sizing, server response time, cache lifetimes, DOM size, and the rest of the diagnostics are in every stored report.
Audit profile. Audits run with Lighthouse’s desktop settings in Chrome at each monitoring location, with Lighthouse’s simulated throttling. Scores are comparable between runs and between locations. They will not match a PageSpeed Insights mobile score, which uses a slow-4G, throttled-CPU mobile profile; see the FAQ.
Thresholds That Match How Google Scores
The threshold is a range on the chosen metric, expressed the way Google publishes its boundaries. A minimum Performance score of 90 alerts when the page leaves the green band. A maximum LCP of 2500 alerts when it leaves “good”.
Min and max together. Both can be set. A minimum SEO score of 90 and a maximum of 100 is the usual pattern for a score; a maximum alone is the usual pattern for a time metric. Leave a field empty to disable that side of the range.
Alert on Lighthouse Errors. Occasionally Lighthouse cannot finish an audit: the page never reaches First Contentful Paint within the wait window, or the run times out. A failed run is retried automatically. If it fails again, this setting decides whether that counts as a device error and alerts you, or is recorded and ignored so only score changes trigger alerts.
Throttling and escalation. Alert throttling stops repeat notifications while the score stays out of range. Escalation sends the first alert to the SEO team and, if nobody resolves it, the next to engineering, with templates that include the metric value and the location as variables.
Delivery Channels
- Email and SMS to individuals or groups, with per-schedule quiet hours.
- Phone call with a spoken alert for severity-one pages.
- Slack and Microsoft Teams channels.
- PagerDuty and ServiceNow incident management.
- Webhooks and the API for anything else, including your own dashboards.
- Mobile app push notifications for iOS and Android.
Every Run Keeps the Whole Lighthouse Report
The alert says Performance fell to 58. The stored report shows which audits changed.
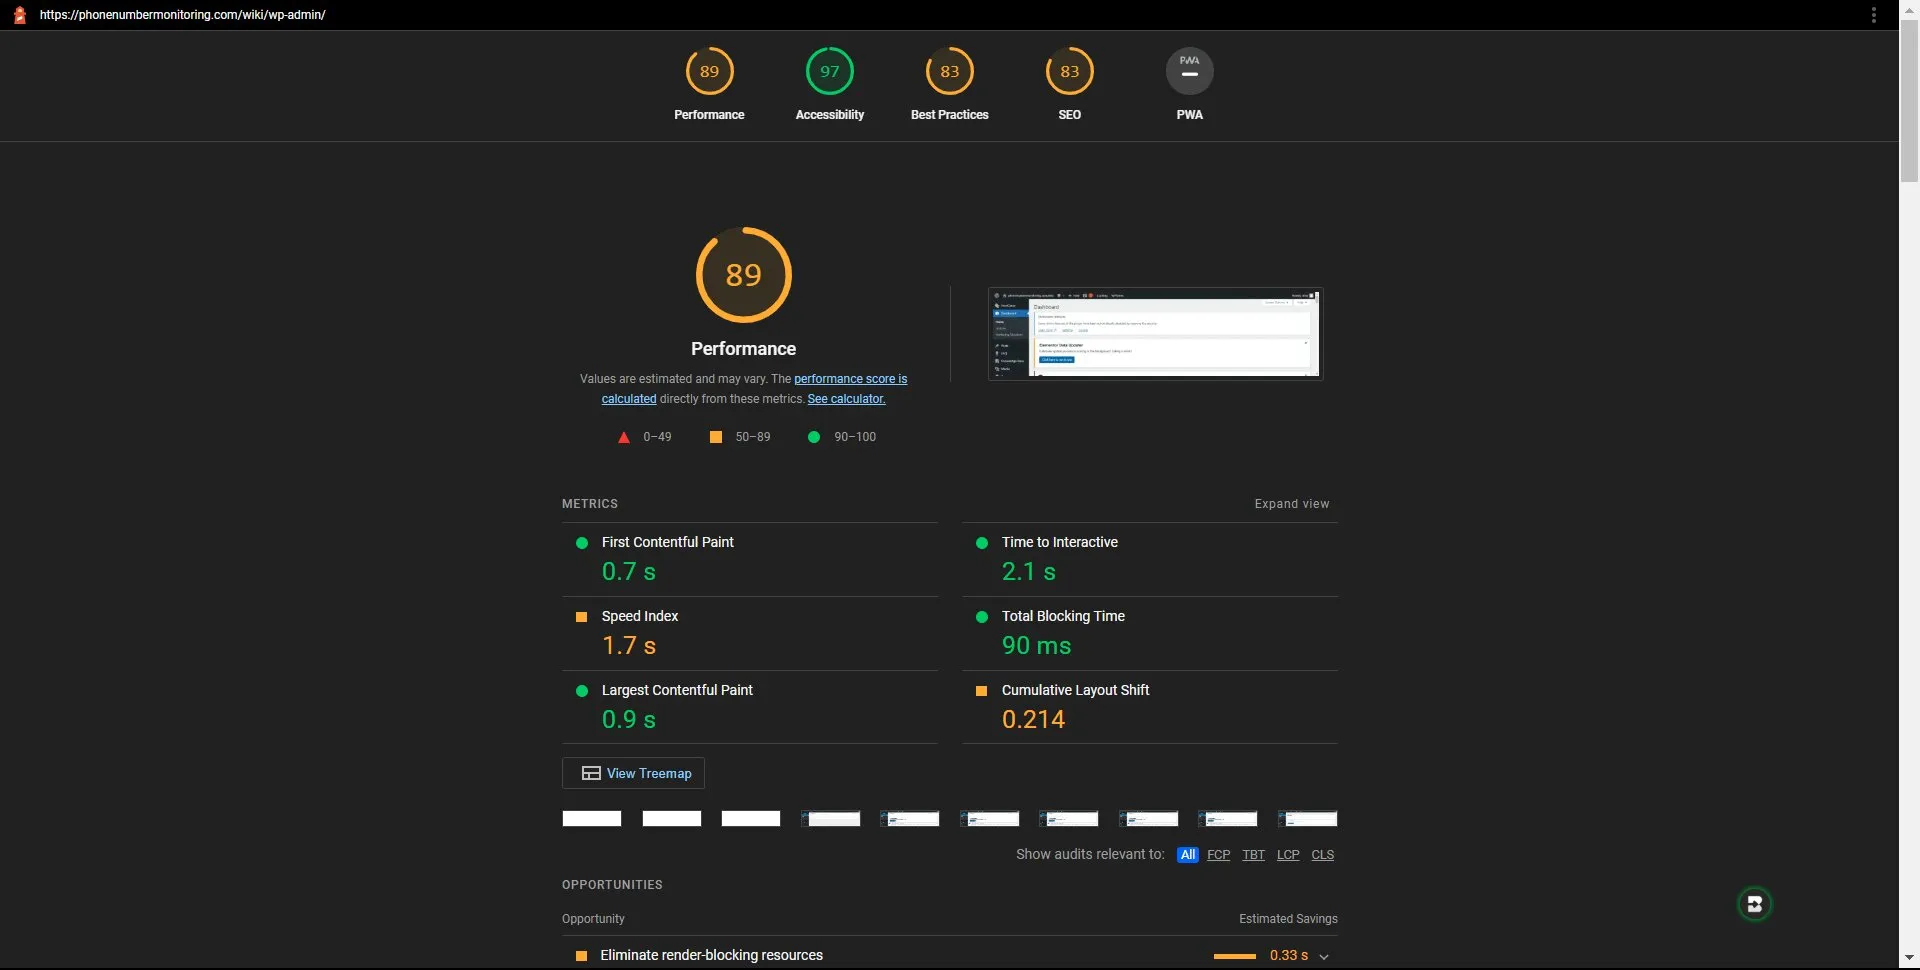
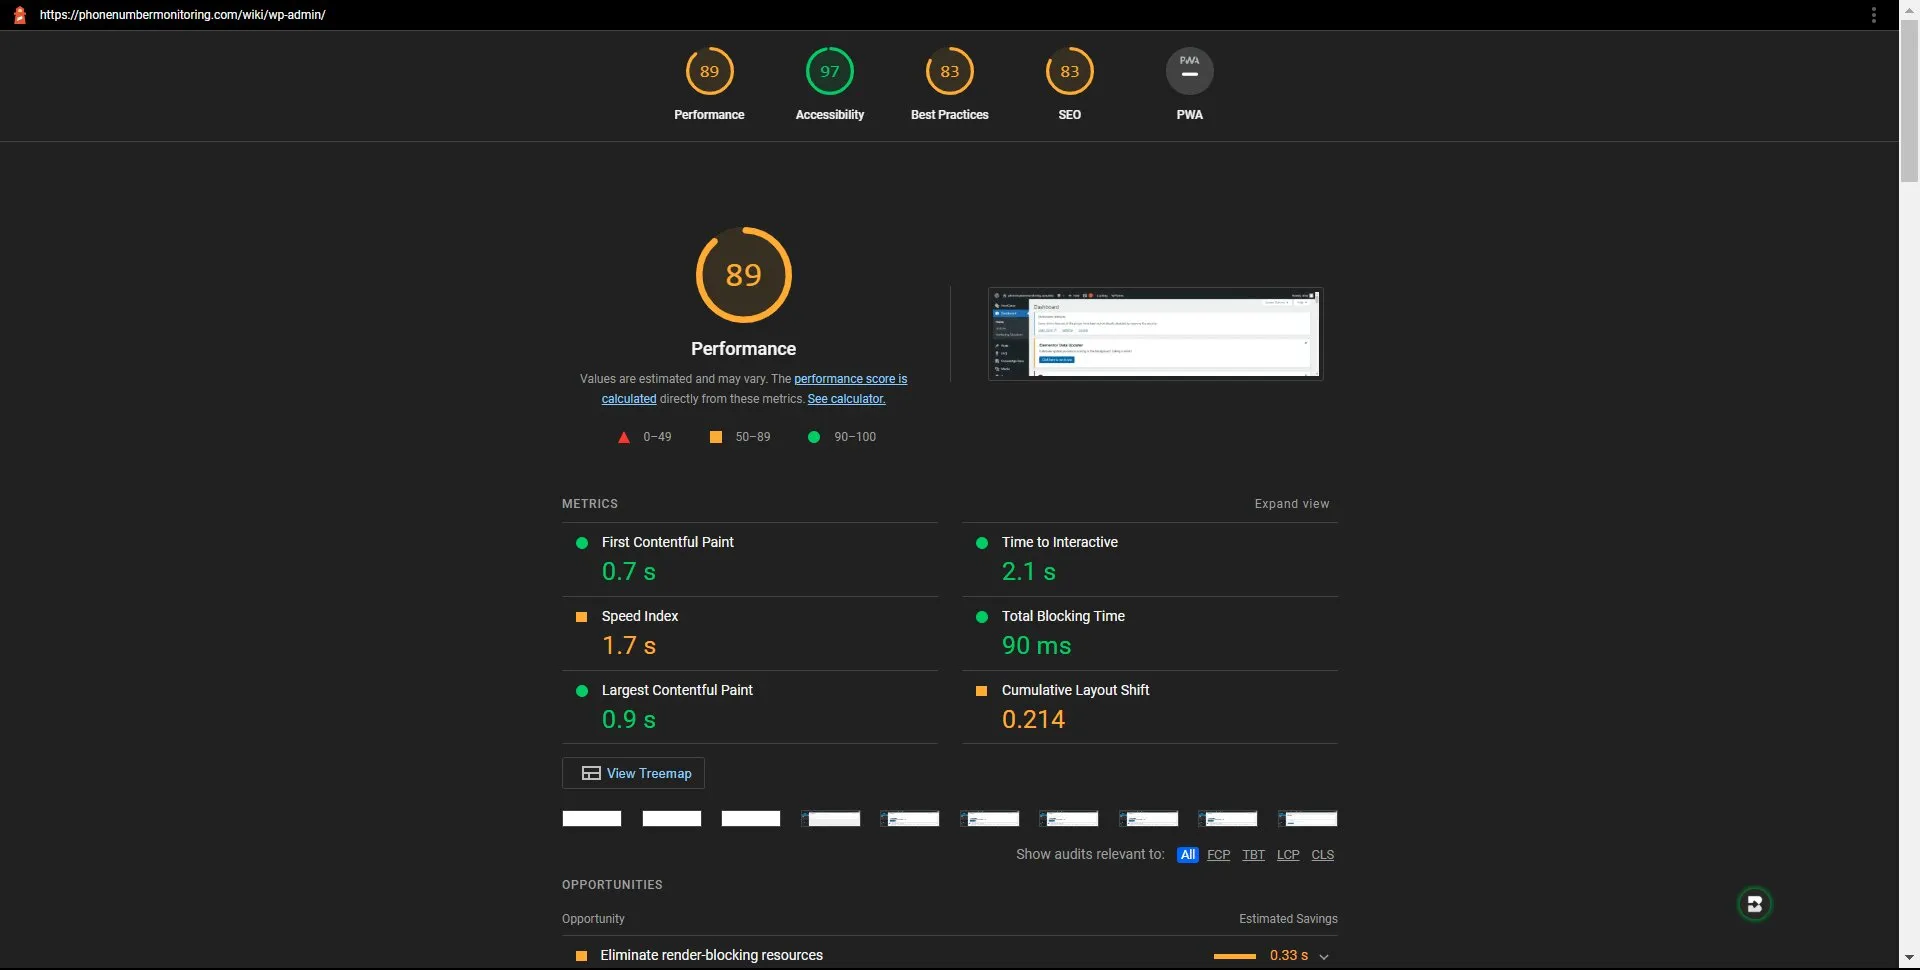
The report is the standard Lighthouse report: scores, metrics, opportunities, diagnostics and passed audits.
The Full Report, per Run, per Location
Open any session in the online report and the complete Lighthouse report for that run is there: the four category gauges, the metric values, the opportunities with estimated savings, the diagnostics, and the list of passed audits. It is the same report format Chrome DevTools produces.
Because each run also records the audit’s network waterfall, you can see the requests that were in flight when a score dropped, such as a new third-party script or an image that grew to 3 MB.
Trends, Dashboards and Scheduled Reports
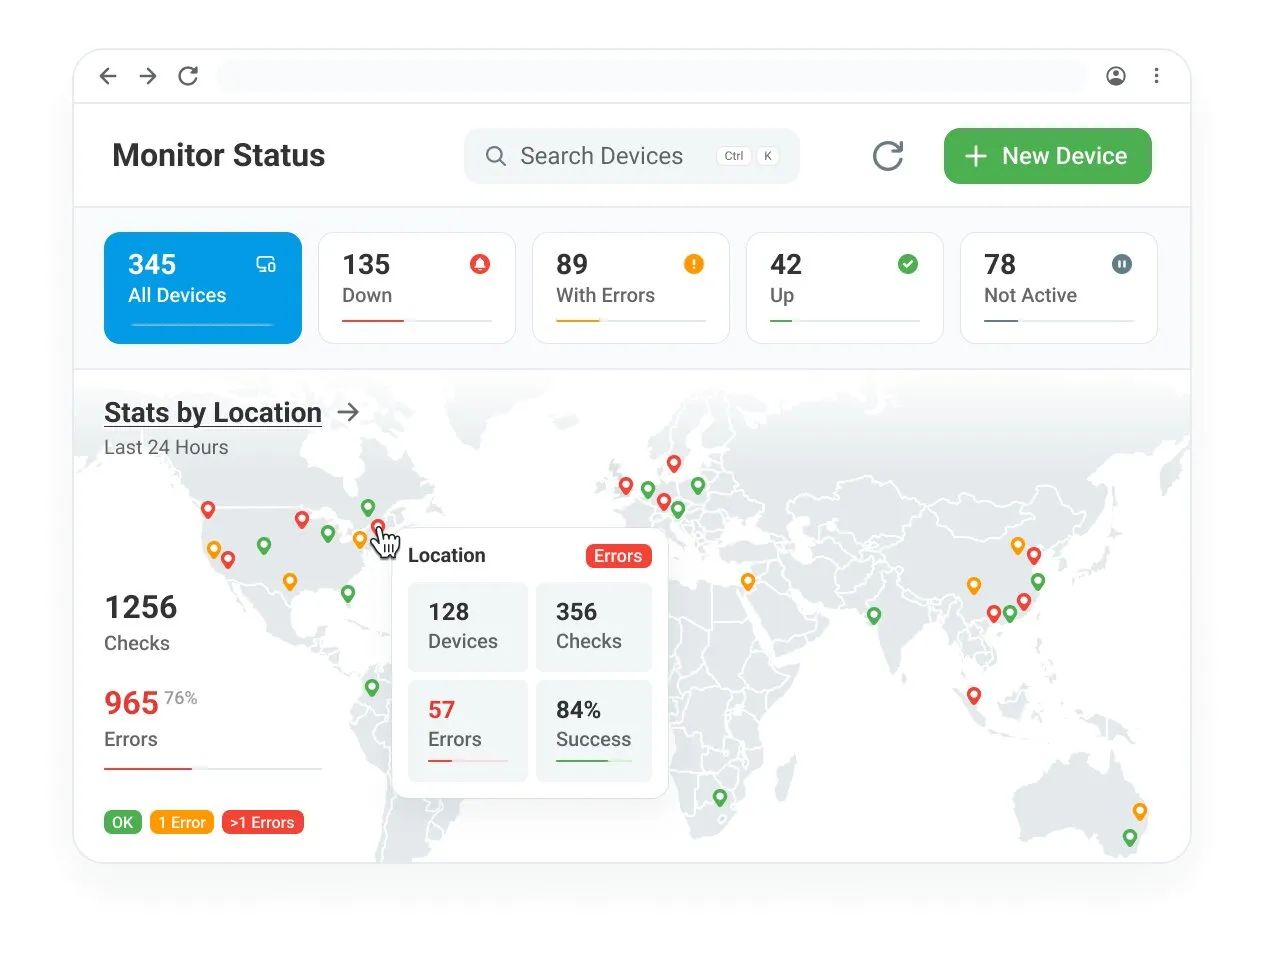
The chosen metric is charted per device and per location over any date range: a Performance score chart for the last quarter, or an LCP chart since the redesign. Scheduled reports aggregate the metric by day, week or month and are emailed on a schedule.
- Dashboards that put Lighthouse scores next to uptime and page load time for the same pages, shared publicly or privately.
- Per-location filtering to separate a global regression from a CDN problem in one region.
- API access to pull the metric history into your own BI tool or SEO reporting stack.
30-day free trial, no credit card, every location and monitoring type included.
Lighthouse Lab Data vs. Core Web Vitals Field Data
Google’s page-experience ranking signal uses field data: Core Web Vitals measured from Chrome users and published in the Chrome User Experience Report (CrUX) as a 28-day rolling aggregate. That is what the Core Web Vitals report in Search Console and the top half of a PageSpeed Insights result show. Lighthouse is lab data: a controlled run under fixed conditions. The two answer different questions, and an SEO program needs both.
Field data (CrUX, Search Console) | Lab data (Lighthouse monitoring) | |
|---|---|---|
What it measures | Real visitors, their devices, networks and locations | One controlled load, same settings every run |
Latency | 28-day rolling window; a regression takes weeks to show fully | Next scheduled run, as soon as one minute after a deploy |
Coverage | Only pages with enough traffic to qualify | Any URL you configure, including new and low-traffic pages, staging and pre-launch |
Metrics | LCP, INP, CLS (plus FCP and TTFB) | LCP, CLS, TBT, FCP, Speed Index, TTI, plus SEO, Accessibility and Best Practices audits |
What it tells you | Whether Google currently sees the page as passing | What changed, when, and which audit explains it |
Used for | Ranking signal; reporting to stakeholders | Catching regressions early; verifying a fix; enforcing a budget per page |
Example: a release goes out on Tuesday, the Lighthouse monitor records LCP jumping from 1.9 s to 3.4 s on the next run and alerts the team, and the fix ships Wednesday. The CrUX 28-day window barely moves. Without the monitor, the regression is discovered when the Search Console report turns yellow the following month, after it has been affecting every visitor for weeks.
Every setting on the device, metric by metric, in the knowledge base.
What Google measures, how it is weighted, and what synthetic and field data each tell you.
Page load time in 40+ desktop and mobile browsers with a waterfall synced to video; the companion to this task.
Which Dotcom-Monitor Product Do I Need?
Three monitoring types on the same platform load web pages, and they answer different questions. SEO teams usually run Lighthouse monitoring and website performance monitoring against the same key pages.
Lighthouse Monitoring (This Page)
Scheduled Google Lighthouse audits with the full report kept per run, one score or metric charted and alerted on per device. Use it for Performance, SEO, Accessibility and Best Practices scores and the Core Web Vitals lab metrics.
- Category scores over time
- LCP, CLS, TBT and other lab metrics
- The audit behind every drop
Website Performance Monitoring
Loads specific pages in 40+ desktop and mobile browsers, scored against a load time threshold, with a waterfall for each element synced to video, a breakdown by host, and detection of failed elements.
- Page load time and its breakdown
- Slow, failed and missing elements
- Browser, device and network variants
Web Application Monitoring
Scripted multi-step user journeys recorded with EveryStep: log in, search, add to cart, check out, submit a form. Verifies each step succeeds and times it, with video and waterfalls per step.
- Logins, carts, checkouts, forms
- Timing and failures per step
- SPAs, AJAX, WebSockets, SSO
A common setup for a marketing site: Lighthouse monitoring on the home page and the top ten organic landing pages for SEO and Performance scores, website performance monitoring on the same pages for load time, and uptime checks on every URL. All share the same locations, alert groups and dashboards.
Who Runs Lighthouse Monitoring
SEO Teams
Put a floor under the Performance and SEO scores of the pages that earn organic traffic, and get told the day a release breaks it instead of the month Search Console notices. The stored report names the audit to send back to the developers.
Marketing and Web Teams
Landing pages change constantly: new forms, new tracking tags, a heavier hero image. Monitor LCP and TBT on the pages paid campaigns send traffic to, from the regions the campaigns run in, and catch the tag that made them slow.
Agencies and Consultants
Monitor every client’s key pages under one account with separate groups and alert routing, and send each client a scheduled, white-labeled report showing Lighthouse scores over the month, with the audit evidence for the work you recommend.
Development and DevOps
Set a performance budget per page as a threshold and get paged when a deploy exceeds it. Provision devices from CI through the API and pull the metric history back into your own dashboards.
What Customers Say About Dotcom-Monitor
4.5
83 reviews
4.6
4.6
All reviews sourced from Capterra verified reviews. Ratings as of August 2026.
Lighthouse Monitoring Questions
What Is Google Lighthouse?
Lighthouse is Google’s open-source tool for auditing a web page. It loads the page in Chrome under controlled conditions and produces a report with scores from 0 to 100 in four categories, Performance, Accessibility, Best Practices and SEO, plus the lab metrics behind the Performance score, such as Largest Contentful Paint, Cumulative Layout Shift and Total Blocking Time, and a list of specific audits that passed or failed with suggested fixes. It is built into Chrome DevTools and powers the lab section of PageSpeed Insights (Google’s Lighthouse overview).
Why Does My Score Here Differ From PageSpeed Insights?
PageSpeed Insights defaults to a mobile profile with slow-4G network and CPU throttling, while Dotcom-Monitor audits with Lighthouse’s desktop profile, so PSI mobile scores are usually lower. The audit runs from a Dotcom-Monitor location rather than Google’s servers, so network paths differ. And Lighthouse scores vary a few points between runs of the same page because of normal variance in loading. Monitoring is about the trend under constant conditions: compare runs with each other, not with a single PSI result.
How Often Can Lighthouse Run Against a Page?
From once a minute to once every three hours, per device. Runs rotate through the locations you selected, one location per interval. For most SEO use cases, every 15 to 60 minutes across three or four locations gives a clear trend without generating noise; use one-minute intervals during a release window when you want to catch a regression immediately.
Can I Alert on More Than One Metric for the Same Page?
Each device charts and alerts on one Report Metric, but stores the complete Lighthouse report on every run. To alert on both the Performance score and LCP for the same URL, create two Lighthouse Report devices pointing at it, each with its own threshold. They can share the same locations, schedule and alert group.
Does It Measure Core Web Vitals?
It measures the lab versions of Largest Contentful Paint and Cumulative Layout Shift, plus Total Blocking Time, which Lighthouse uses as the lab proxy for responsiveness. Interaction to Next Paint is a field metric that requires real user interactions, so no tool built on Lighthouse reports it. Google’s ranking signal uses field data from Chrome users aggregated over 28 days; Core Web Vitals monitoring with Lighthouse lab data shows a regression weeks before that field data reflects it.
What Happens When Lighthouse Cannot Complete an Audit?
A run that fails, for example because the page never reaches First Contentful Paint within the wait window, is retried automatically. If the retry also fails, the “Alert on Lighthouse Errors” setting decides whether the failure counts as a device error and sends an alert, or is logged without affecting the device state. Threshold violations on a completed audit always count as errors.
Can I Audit a Staging Site or a Specific Server?
Yes. The DNS Options on the device let you choose how hostnames are resolved and map a hostname to a specific IP address, IPv4 or IPv6. That lets you audit a pre-launch site before DNS changes, or one origin behind a load balancer, using the production hostname so the page’s own absolute URLs still resolve.
Do I Need Website Performance Monitoring as Well?
They measure different things. Lighthouse monitoring gives you Google’s audit scores and lab Core Web Vitals under fixed conditions. Website performance monitoring loads the page in 40+ desktop and mobile browsers, measures load time, and keeps a per-element waterfall synced to video for every session, which is how you find the exact resource that slowed a page. Most SEO teams run both on their top pages; both are included in the free trial.
What Is Included in the Free Trial?
Everything: Lighthouse monitoring and every other monitoring type, all 33 locations, all alert channels and integrations, dashboards and scheduled reports, for 30 days, with no credit card required. Set up a Lighthouse Report device in the first five minutes and the score history starts accumulating immediately.
Get an Alert the Day Your Lighthouse Score Drops
Start a 30-day free trial, point a Lighthouse Report device at your most important page, and set the minimum score you want to hold. The first report is available within minutes.
- No credit card
- Every feature, every location and every monitoring type is included in the trial