Home
- Product · Page Speed Monitoring
Website Performance Monitoring: Page Load Speed, Measured in Real Browsers, Every Minute
A speed test tells you how fast a page loaded once. Dotcom-Monitor loads it on a schedule, as often as every minute, in 40+ real desktop and mobile browsers from your choice of 33 locations. It records each element that loaded slowly, failed, or went missing, and sends an alert when load time exceeds the threshold you set.
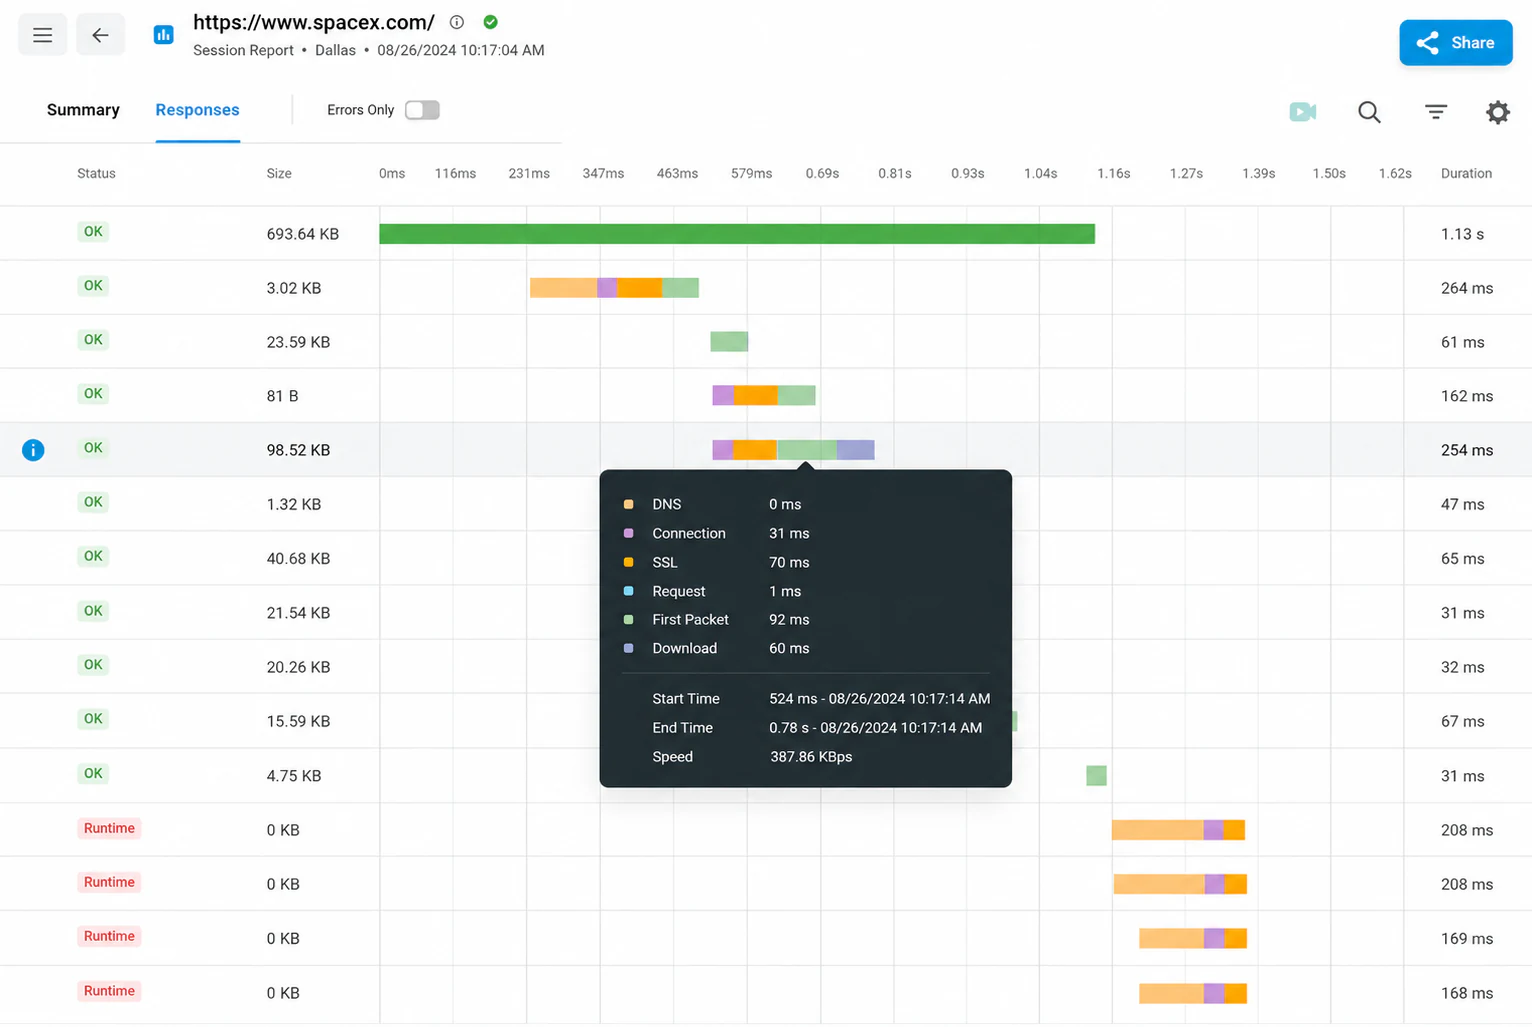
Each session keeps a waterfall chart synced to video, timings per host and per element, and 100 sessions of history per device. You can see which element slowed the page and when the slowdown started.
Start 30-Day Free Trial
See Pricing
- No credit card
- Every feature, every location and every browser is included in the trial
- Trusted by 10,000+ organizations
- 99.99% uptime SLA
- G2 Top Performer
- Website monitoring leader since 1998
1 min
Shortest check interval
40+
Real desktop & mobile browsers
33
Monitoring locations, 6 continents
100
Waterfall sessions kept per device
What it is
Monitoring vs. speed test
What it catches
How it works
Metrics
Diagnostics
Real-world conditions
Alerts
Core Web Vitals and Lighthouse
Which product do I need?
Use cases
Reviews
FAQ
The Short Version
What Website Performance Monitoring Is
Website performance monitoring is the continuous, scheduled loading of a web page in a real browser from fixed locations, recording how long the page and each element on it took to load, which elements failed, and alerting when load time or errors cross a defined threshold. Unlike a one-time speed test, it produces a time series: the same page, the same browser, the same location, measured every few minutes. A slowdown shows up as a change against a known baseline.
Dotcom-Monitor Website Performance Monitoring at a Glance
Platform
BrowserView, single-page monitoring in a real browser
Check interval
Every 1 minute to every 3 hours, per device
Browsers
40+ desktop and mobile browsers: Chrome, Edge, Firefox, iOS and Android profiles
Locations
33 monitoring locations on 6 continents, plus private agents inside your network
Per session
Waterfall chart, video, screenshot, per-host and per-element timings; last 100 sessions kept per device
Threshold metrics
Full page load, network time only, a Navigation Timing event, or First Meaningful Paint
Error checks
Failed elements (4xx/5xx, timeouts), missing keywords, certificate errors and expiry
Alerting
Multi-location verification, then email, SMS, phone, Slack, Teams, PagerDuty, ServiceNow, webhooks
Dotcom-Monitor’s website performance monitoring runs on the BrowserView platform. You give it a URL, choose browsers and locations, and set a load-time threshold. From then on it loads the page in a real browser on your schedule, from every minute up to every three hours, and keeps the full waterfall, video and timing breakdown of each session. It alerts you when the page exceeds your threshold, an element returns an error, or expected content is missing. The alert includes the session diagnostics.
What it is not. It is not a site crawler and does not follow links across your site. It monitors the specific pages you configure: home page, landing pages, product pages, pricing page. It is not a tool for auditing thousands of URLs. If you need to monitor a multi-step journey such as a login or checkout, that is web application monitoring; if you only need to confirm the site is reachable, that is uptime monitoring. The product fit section below has the full comparison.
Why Not Just Run a Speed Test?
Speed Test vs. Continuous Monitoring
Google PageSpeed Insights, GTmetrix, WebPageTest and our own free website speed test report how a page performed on the run you started, from the location you picked. They do not tell you that the page was 1.4 seconds slower at 9 a.m. on Tuesday than it was on Monday, that it is slow only from Singapore, or that the hero image started returning a 404 after Thursday’s deploy. A performance monitor answers those questions.
| Question | One-off speed test | Dotcom-Monitor website performance monitoring |
|---|---|---|
| How fast is this page right now? | Yes | Yes, every minute if you want |
| Did it get slower after the last release? | No baseline | Yes, session history and trend reports |
| Is it slow from where my customers are? | Only from the location you picked for that run | Yes, 33 locations you choose from |
| Which element slowed it down? | Waterfall for that one run | Waterfall for every run, synced to video |
| Did an image, script or font start failing? | Only if you were looking at that moment | Yes, flagged as an error and alerted |
| Will someone be told when it crosses 3 seconds? | No | Yes, by email, SMS, phone, Slack, PagerDuty, webhook |
| How does it behave on an iPhone vs. desktop Chrome? | Usually a single emulated browser | 40+ real desktop and mobile browsers |
| How does it load for a returning visitor with a warm cache? | No | Yes, return-visitor simulation |
Detection
What Website Performance Monitoring Catches
Every session is a full page load in a real browser, so the monitor records everything the browser requests and renders. Customers most often use it to find the following.
Slow
Page Load Time Over Your Threshold
Set the number of seconds you consider acceptable. Every session that exceeds it is recorded as an error and the waterfall shows which element and which phase (DNS, connect, SSL, first byte or download) took the time.
Slow
Slow Third-Party Elements
Tag managers, chat widgets, ad scripts, fonts and analytics beacons load from hosts you do not control. The speed breakdown by host shows when a third party, not your server, slowed the page.
Failed
Broken Images, Scripts and Stylesheets
A resource that returns a 4xx or 5xx, times out, or never arrives is flagged as an error on the session, named in the waterfall, and can trigger an alert. You find out the hero image returns a 404 before a customer does.
Failed
Missing Content
Keyword validation checks that expected text is present on the page, with AND / OR / NOT expressions. A page that returns 200 but renders an empty template, an error message or a competitor’s ad still fails the check.
Failed
Certificate Errors and Expiry
Invalid, mismatched or expiring SSL certificates on the page or any resource it loads are reported. You can set how many days before expiry to be warned, and filter which hosts count.
Regional
Slowness in One Region Only
Each selected location runs the check independently and reports its own timings. A CDN edge with a cold cache, a bad GeoDNS answer or a congested transit route shows as an error at one location while the others pass.
Setup
How It Works
Setting up one page takes a few minutes. Use bulk import for the rest.
Create a Single Web Page Device
In your account, add a new device, choose Website, then Single Web Page. Multiple Step Journey is web application monitoring, HTTP/S is uptime monitoring, and Lighthouse Report is the separate Lighthouse task.
1
Enter the Page URL
Pick the browser, Chrome, Edge, Firefox or a mobile device profile, and the browser version. Add HTTP basic, digest or NTLM credentials if the page requires them, and a custom DNS host if you want to monitor a staging server or a specific origin behind a load balancer.
2
Choose Locations and Frequency
Select any of the 33 monitoring locations across North America, Europe, Asia-Pacific, South America, the Middle East and Africa, and a check interval from one minute to three hours. Locations rotate round-robin: a one-minute interval across five locations gives a reading from a different location every minute.
3
Set the Thresholds
The time validation threshold is the load time, in seconds, beyond which a session counts as an error. Add keyword validation for content that must be present, a certificate-expiry warning window, and download filters to exclude elements you do not want scored, such as a known slow third-party beacon.
4
Verify Before Alerting
When a location records an error, the platform re-runs the check from other locations before opening an incident. A route flap on one path does not trigger an alert. A page that is slow from three continents does.
5
Get the Alert With the Evidence
The notification carries the diagnostics: the error, the failing element, the waterfall, a screenshot, and a link to the video of the session. Route it by severity through alert groups and escalation to email, SMS, phone call, Slack, Microsoft Teams, PagerDuty or any webhook.
6
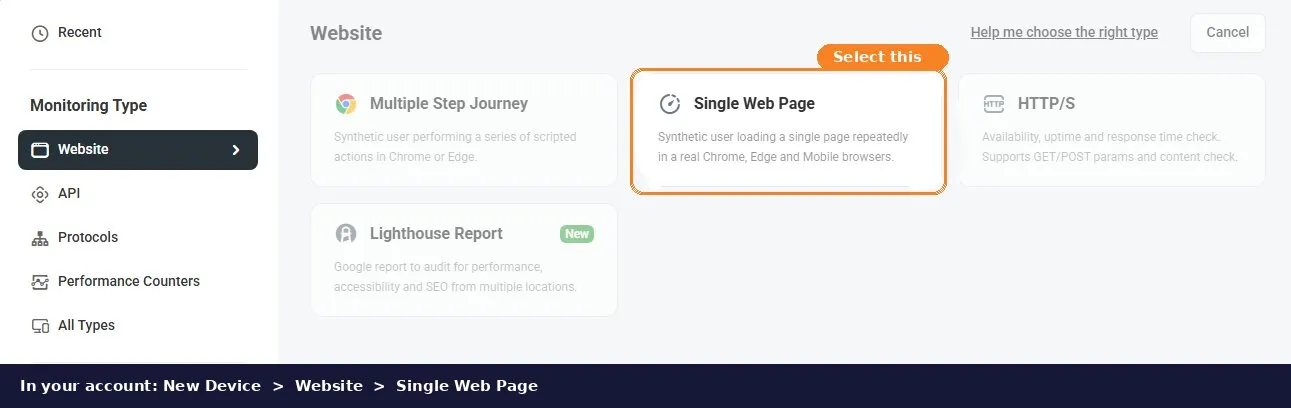
The device type to choose for website performance monitoring: Website, then Single Web Page.
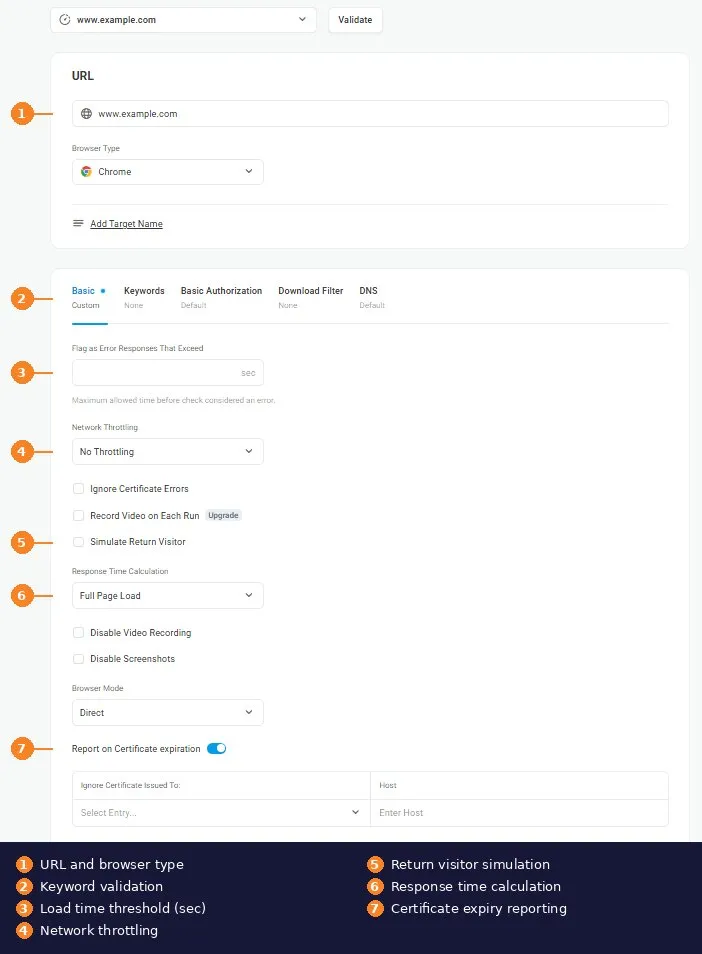
The settings behind steps 2 to 4: browser, threshold, throttling, return visitor, response time calculation and certificate checks are all on one screen.
Measurement
Which Page Load Metrics BrowserView Captures
BrowserView lets you choose which browser event defines the response time scored against your threshold. The other timings are recorded for diagnosis.
Threshold option
Full Page Load
Time to the browser’s Load Complete event: HTML, CSS, scripts, images, fonts and every third-party asset finished. This is the default.
Threshold option
Network Times Only
Only the network transfer time, excluding client-side rendering and script execution. Use this to measure server and CDN performance without front-end rendering time.
Threshold option
Navigation Timing Event
Score against a specific W3C Navigation Timing milestone, such as DOM Content Loaded or DOM Interactive, when you want to measure when the page becomes usable rather than fully loaded.
Threshold option
First Meaningful Paint
The paint that follows the largest layout change, when the visitor first sees the page’s primary content. Use it when perceived load matters more than the load event.
Per element
DNS, Connect, SSL, First Byte, Download
Every element in the waterfall is broken into its timing phases, with start and end time, so a slow time to first byte on the document is distinguishable from a slow download of a 4 MB image.
Per host
Speed Breakdown by Host
Total time and element count grouped by the domain that served them. Your origin, your CDN and each third party get their own line.
History. The last 100 monitoring sessions per device are kept with full waterfalls, and summarized response times feed the trend, uptime and performance reports and dashboards, which you can share publicly or privately and export by email on a schedule.
Diagnosis
Diagnose Which Element Slowed the Page
An alert that says “page load exceeded 3 seconds” starts an investigation. These tools identify the cause.
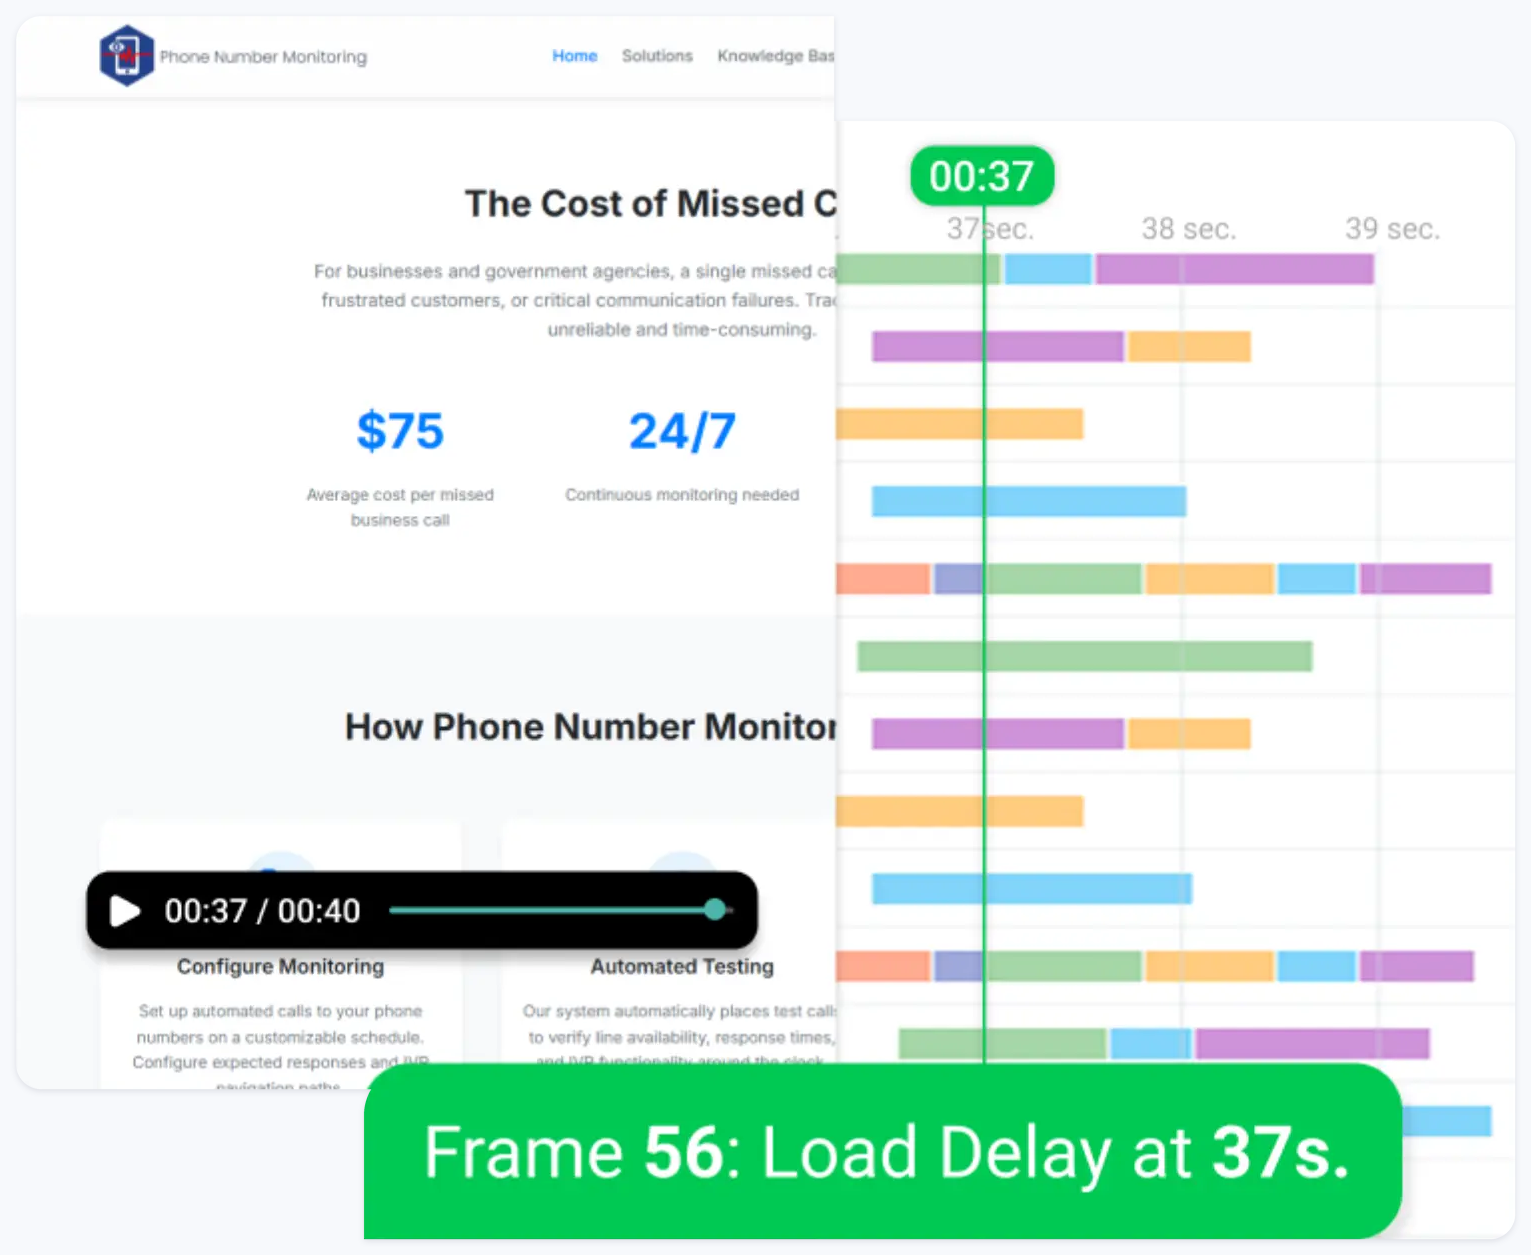
Waterfall Charts Synced to Video
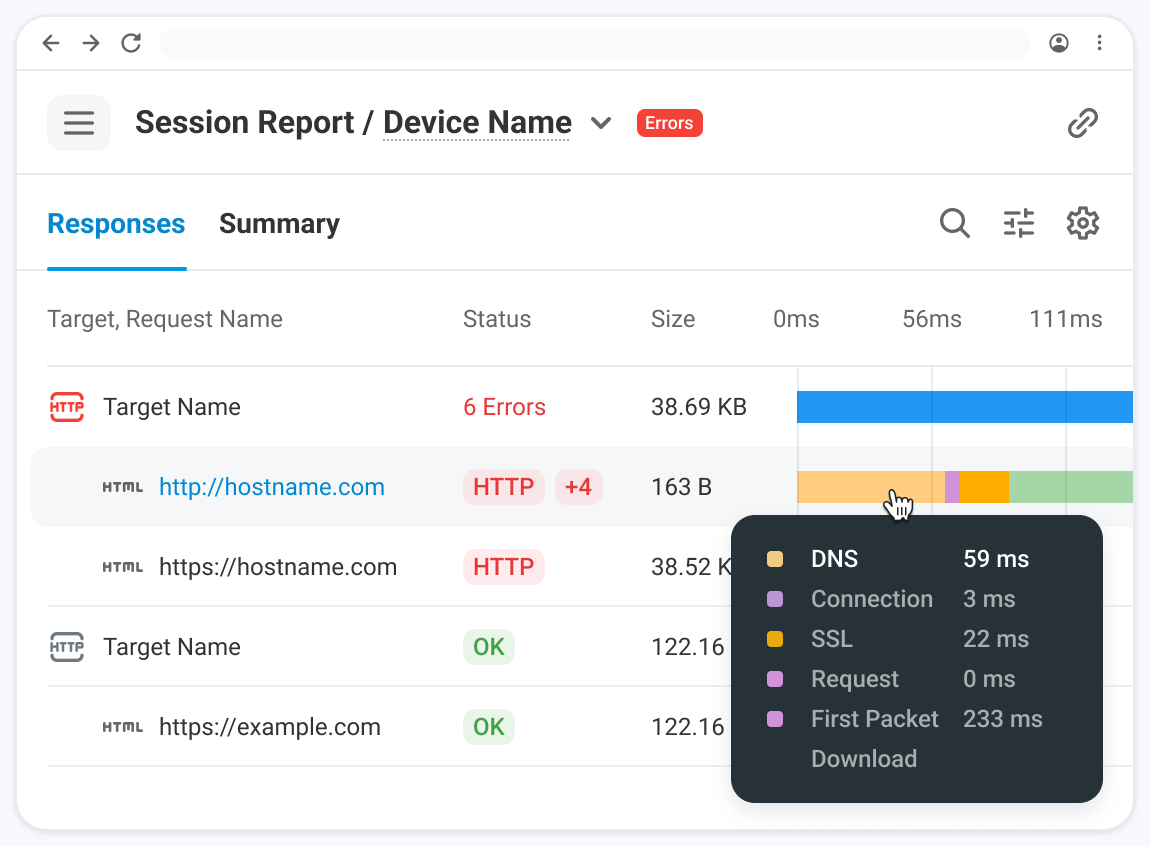
Every session produces a waterfall: each element in load order, its timing phases as colored segments, its status code, and its host. Hover a bar for the summary, open it for headers and details. The session is also recorded on video, synced to the waterfall. Scrub to the point where the page stalled and see which request was still outstanding.
Video is recorded by default on the first error of the day from each location; turn on “Record Video on Each Run” to keep it for every session, or disable video and screenshots for pages that show personal data.
AI Waterfall Analysis
For any session, the AI analysis reads the waterfall timings, status codes and error messages and returns a plain-language verdict: target down, partially degraded or normal; what the user would have experienced; the failing URL and its probable root cause with the waterfall evidence cited; and corrective actions. It also notes when your monitoring configuration is part of the problem, for example a timeout threshold set too tight for the page.
No prompts to write. An administrator enables AI Data Analysis once at the account level. Results are labeled informational.
Session Log, Screenshots and Drill-Down Reports
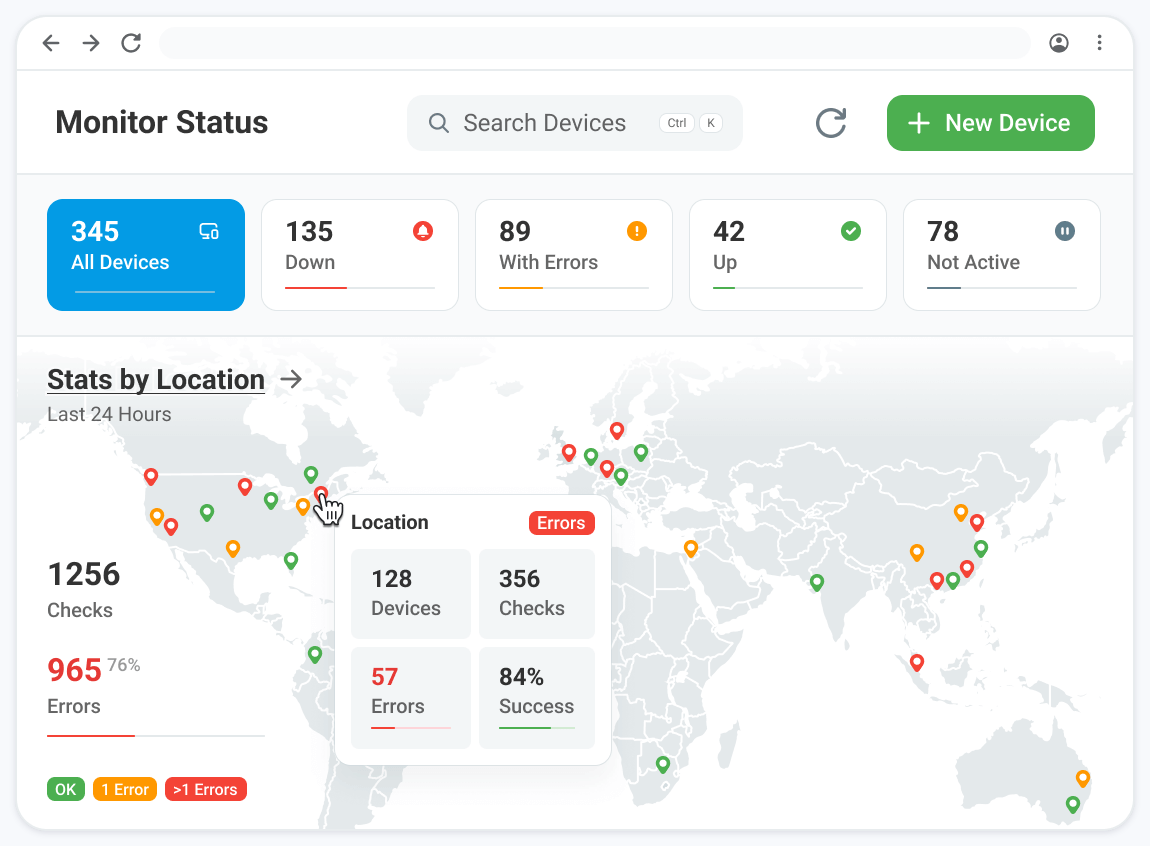
The device overview report lists every session with its location, response time and result; click through for the waterfall, the screenshot taken at completion, the video, and the alert that was sent. Filter to errors only, compare locations side by side, or export the log. When a customer reports the page was slow yesterday afternoon, you can open the sessions from yesterday afternoon.
- Screenshot at completion of every session, so rendering failures are visible.
- Traceroute captured on error, for cases where the network, not the page, is slow.
- Download filters to exclude or isolate elements by URL pattern, so a known-slow beacon does not mask a real regression.
See the first waterfall for your own page within minutes.
30-day free trial, no credit card, every browser and location included.
Start 30-Day Free Trial
Realism
Monitor Under the Conditions Visitors Use
A headless fetch from a data center on a gigabit connection does not match what a visitor on a phone with a weak signal experiences. Configure the monitor to match that visitor.
40+ Real Browsers
Chrome, Edge and Firefox on desktop, each with selectable versions, plus mobile browser profiles for iOS and Android devices. Script execution and layout time are included in the measurement, not just transfer time.
Mobile Devices
Load the page as an iPhone or Android device, with the viewport, pixel ratio and user agent that trigger your responsive layout and mobile-specific assets, and score it against a separate mobile threshold.
2G, 3G and 4G Throttling
Simulate slow, average and fast mobile networks with preset bandwidth and latency, or set custom download, upload and latency values, to measure load time on a slow connection.
Cold Cache and Return Visitor
Every session starts with an empty cache, the first-visit experience. Enable return-visitor simulation to reload immediately and record only the second visit, to verify caching headers and CDN hit rates.
Monitoring from your own network. Pages on an intranet, behind a VPN, or on a staging environment the public internet cannot reach can be monitored the same way with a private agent installed inside your network. It appears as one more location and feeds the same reports and alerts.
Alerting
Verified Alerts With Escalation
A page can be slow for one second from one location for reasons unrelated to your site. Two mechanisms keep those events from becoming alerts.
Verification before notification. An error at one location is re-checked from others before an incident opens. Only a confirmed failure sends a message, and the message says which locations failed and which passed.
Throttling and escalation. Alert throttling stops repeat notifications while the page stays in the same error state. Escalation rules route the first alert to one group and, if it is not resolved, the next one to another, with templates that pull in the response time, the failing element and the location as variables.
Delivery Channels
- Email and SMS to individuals or groups, with per-schedule quiet hours.
- Phone call with a spoken alert for severity-one pages.
- Slack and Microsoft Teams channels.
- PagerDuty and ServiceNow incident management.
- Webhooks and the API for anything else, including your own dashboards.
- Mobile app push notifications for iOS and Android.
Full list of integrations
Search Performance
Core Web Vitals and Lighthouse Scores
Core Web Vitals, Largest Contentful Paint, Interaction to Next Paint and Cumulative Layout Shift, are the page-experience metrics Google uses as a ranking signal, and Google measures them from real Chrome users through the Chrome User Experience Report. Google uses that field data for its page experience signals, and it is a 28-day rolling aggregate. By the time a regression appears in Search Console, it has been affecting the page for weeks.
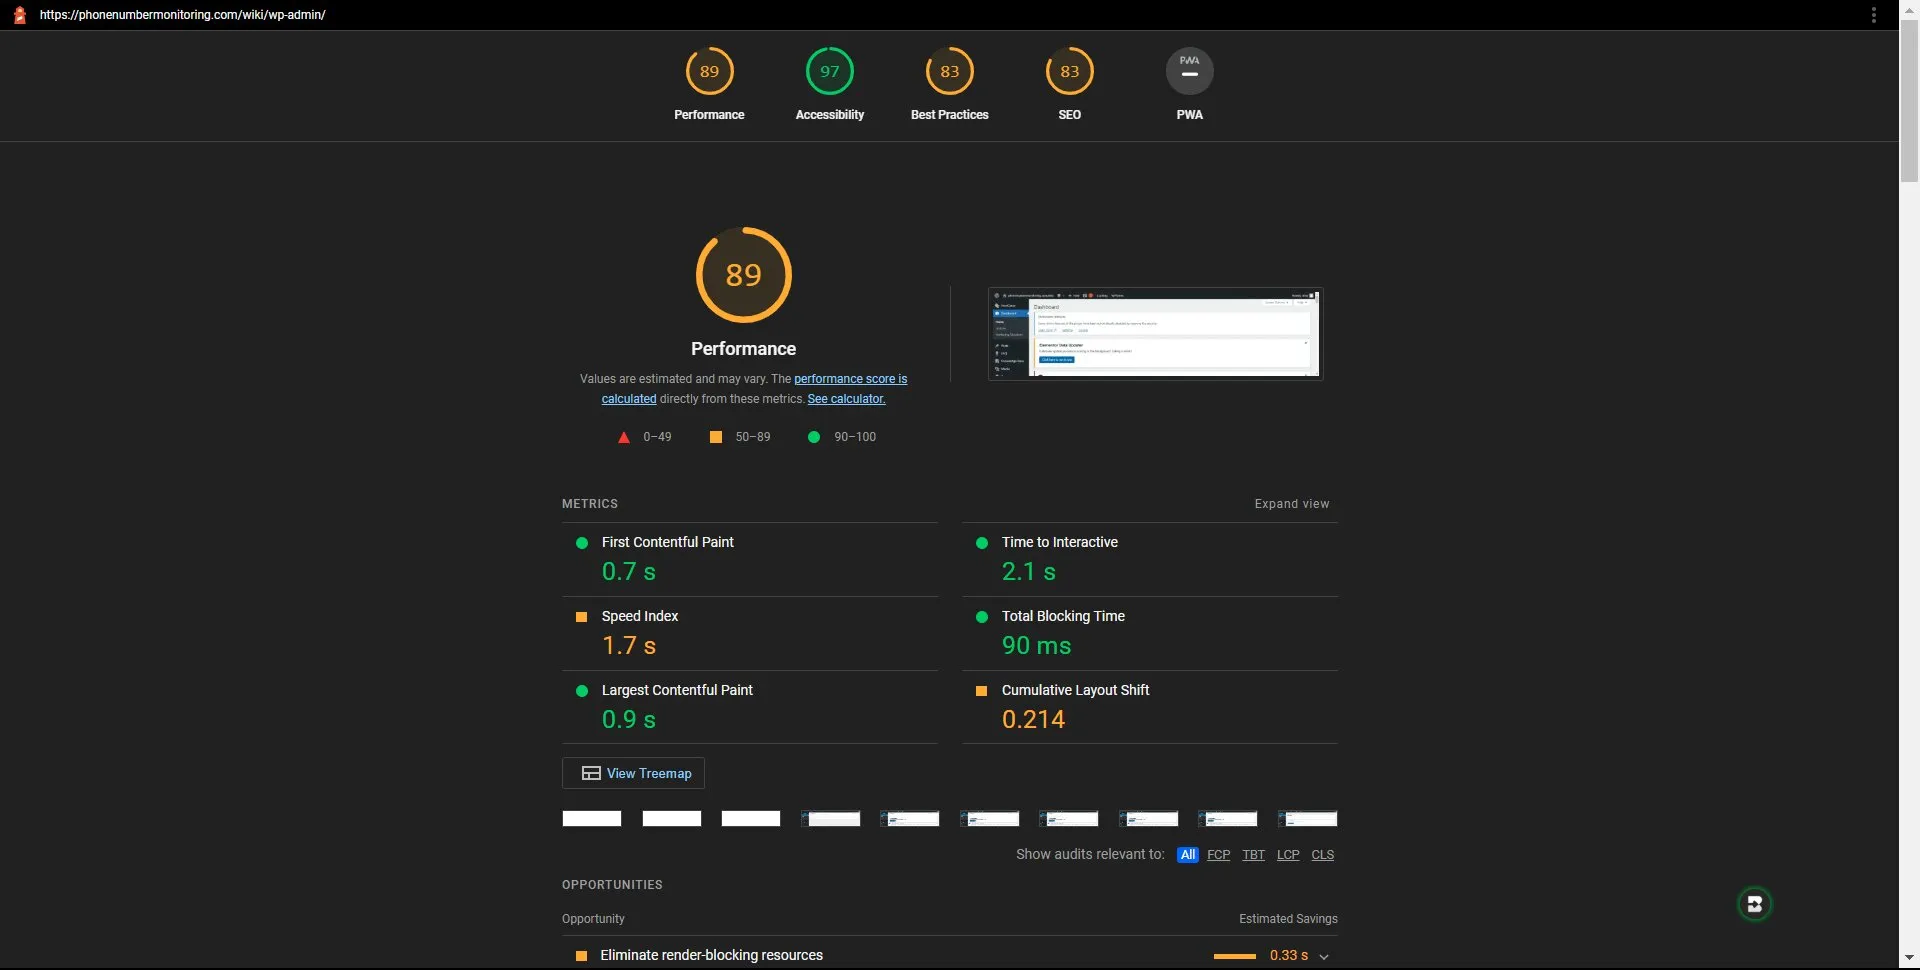
Lighthouse report from a scheduled monitoring task: category scores plus LCP, CLS and Total Blocking Time for the audited page.
Synthetic monitoring catches the regression first. A jump in full load time, First Meaningful Paint or document time to first byte after a deploy shows on this monitor within minutes, before CrUX changes. Lighthouse scores and the lab metrics behind them, including LCP, CLS and Total Blocking Time, come from a separate scheduled Lighthouse monitoring task with its own thresholds and alerts. Run both against the same URL: BrowserView for load time in real browsers from your users’ locations, Lighthouse for the audit scores your SEO team reports on.
Scheduled Lighthouse audits with per-metric thresholds and alerts, including for login-protected pages.
What Google measures, how it is weighted, and what synthetic and field data each tell you.
A walkthrough of timing phases, blocking resources and the patterns that point at specific fixes.
Product Fit
Which Dotcom-Monitor Product Do I Need?
Three products in the platform load web pages, and they answer different questions. Most customers run two of them against the same site.
Question: Is it up?
Uptime Monitoring
Lightweight HTTP(S), ping and port checks that confirm the site responds, from up to every minute, with keyword checks and downtime alerts. Lowest cost per check, no browser involved.
- Availability and response time
- Downtime and SLA reporting
- Hundreds of URLs at low cost
Uptime monitoring
Question: Is it fast, and what slowed it?
Website Performance Monitoring, BrowserView (This Page)
Full real-browser loads of specific pages, scored against a load-time threshold, with per-element waterfalls, video, per-host breakdown and failed-element detection. Use it to keep key pages fast and identify what slows them.
- Page load time and its breakdown
- Slow, failed and missing elements
- Browser, device and network variants
Start free trial
Question: Does the journey work?
Web Application Monitoring
Scripted multi-step user journeys recorded with EveryStep: log in, search, add to cart, check out, submit a form. Verifies each step succeeds and times it, in real browsers, with video and waterfalls per step.
- Logins, carts, checkouts, forms
- Step-level timing and failures
- SPAs, AJAX, WebSockets, SSO
A common setup for an e-commerce site: uptime checks on every URL, website performance monitoring on the home page, top category pages and top product pages, and web application monitoring on the checkout. Each uses the same locations, alert groups and dashboards.
Use Cases
Who Runs Website Performance Monitoring
E-commerce and Marketing Teams
Landing pages and product pages are where paid traffic lands. Monitor the pages your ads send traffic to, from the countries the ads run in, on the devices that traffic uses.
SEO Teams
Catch a speed regression the day it ships instead of weeks later in CrUX. Pair BrowserView load times with the Lighthouse task for the scores, and keep a shareable dashboard to show what changed and when.
Development and DevOps
Set a load-time SLO per page and get paged when a release breaks it. The waterfall and video attached to the alert usually identify the asset responsible. Provision monitors from CI through the API.
Agencies and MSPs
Monitor every client’s key pages under one account with separate groups, thresholds and alert routing, and send each client a white-labeled report showing load time over the period, or which third-party script needs to be removed.
Customers
What Customers Say About Performance Monitoring
“I absolutely love the comprehensive monitoring services Dotcom-Monitor provides. The real-time alerts and detailed performance analytics have been a game-changer for our website’s uptime and speed. The global monitoring feature ensures that our site is optimized everywhere, and the intuitive dashboard makes it easy to track performance. Their customer support is exceptional — always responsive and efficient.”
Tomer C.
Managing Director · Facilities Services · Verified Capterra review, March 2025
“One of Dotcom’s best features is the push/pull API capabilities that provide us with network performance data. We use this to monitor for performance issues as well as page loading stats. Dotcom-Monitor allows us to monitor multiple services within one interface and platform. It’s allowed us to operate more efficiently.”
Gregory S.
Manager · Broadcast Media · Verified Capterra review, May 2020
Reviews sourced from Capterra verified reviews. Ratings as of August 2026.
4.5
Capterra
4.6
Ease of Use
Capterra Score reviews
4.6
Customer Service
Capterra Score reviews
All reviews sourced from Capterra verified reviews. Ratings as of agosto 2026.
Frequently Asked Questions
Website Performance Monitoring Questions
What is the difference between website performance monitoring and a website speed test?
A speed test loads a page once, from one location, and reports the result. Website performance monitoring loads the same page on a fixed schedule, from locations you choose, in browsers you choose, and keeps every result, so you get a baseline, a trend, and an alert when the page gets slower or an element fails. Use a speed test to investigate a known problem. Use monitoring to find out a problem exists.
How often can a page be checked?
From once a minute to once every three hours, per monitoring device. Checks rotate through the locations you selected, one location per interval, and all locations run at once whenever a device is created, edited, restarted, or after an error is detected. Concurrent checks from all locations on every interval are available as an add-on.
Does it detect broken links?
It detects broken elements on the monitored page: images, scripts, stylesheets, fonts, iframes and any other resource that returns a 4xx or 5xx status, times out, or fails to load. Those are flagged as errors on the session, shown in the waterfall and can trigger alerts. It does not crawl the site following hyperlinks, so a link on the page that points at a dead destination is not tested unless you monitor that destination page too. For that, add the destination as its own device or use an uptime check.
Which browsers and devices can it monitor with?
More than 40 real desktop and mobile browsers: Chrome, Microsoft Edge and Firefox on desktop, with selectable versions, and mobile browser profiles for iPhone, iPad and Android devices. Each device is one page in one browser, so monitoring one page on desktop Chrome and on an iPhone profile means two devices with two thresholds.
Does it measure Core Web Vitals?
BrowserView measures full page load, network-only time, W3C Navigation Timing events and First Meaningful Paint in a real browser, plus per-element and per-host timing phases. Core Web Vitals (LCP, INP, CLS) and Lighthouse performance scores are measured by the separate Lighthouse monitoring task in the same platform, which runs Google Lighthouse on a schedule and alerts on per-metric thresholds. Google’s ranking signal uses field data from Chrome users; synthetic monitoring catches a regression weeks before that field data changes.
Can I monitor how the page loads for a returning visitor?
Yes. Every session starts with an empty cache, which measures the first-visit experience. Enable “Simulate a Return Visitor” and the browser reloads the page immediately after the first load and records only the second visit, which shows the effect of your caching headers and CDN.
Can it monitor pages behind a login, on an intranet or on staging?
Pages protected by HTTP basic, digest or NTLM authentication can be monitored directly by adding the credentials to the device. Pages that require a form-based login are handled by web application monitoring, which scripts the login step. Pages on an intranet, behind a VPN, or on a staging environment the public internet cannot reach are monitored with a private agent installed inside your network. A custom DNS host setting lets you point the monitor at a specific origin server or a pre-launch site before DNS changes.
How is this different from web application monitoring?
Website performance monitoring loads one page and measures how fast it loads and what failed on it. Web application monitoring plays back a multi-step script, a login, a search, a checkout, and verifies that each step works and times each one. If the question is “is my landing page fast”, use this product. If the question is “can customers still complete a purchase”, use web application monitoring. They share locations, alerting and reports, and most e-commerce customers run both.
What is included in the free trial?
Everything: all monitoring locations, all browsers and devices, video capture, AI waterfall analysis, all alert channels and integrations, for 30 days, with no credit card required. Set up a page monitor in the first five minutes and trend data starts accumulating immediately.
Find Out What Is Slowing Your Pages Down
Start a 30-day free trial, point a monitor at your most important page, and select the browsers and locations your customers use. The first waterfall is available within minutes.
Start 30-Day Free Trial
Schedule a Demo
No credit card required. Every feature, location and browser included in the trial.