Your pager fires at 2 a.m. The alert payload has a status code in it. What you do next depends almost entirely on which code you see.
That’s the part most HTTP status code guides skip. They list definitions, sort the codes into five buckets, and stop. Useful as a glossary, less useful when a real endpoint is throwing 502s and an exec is asking why checkout is broken.
This guide covers the same ten codes you’ll see most often, plus a few honorable mentions. For each one: what it means, what usually triggers it in production, and what to check first. The goal is to shorten the time between “I see the code” and “I know what to fix.”
What Is an HTTP Status Code?
An HTTP status code is a three-digit number the server sends back with every response. It tells the client whether the request succeeded, failed, or needs to be redirected. You see them everywhere: in your browser’s DevTools Network tab, in load balancer logs, in monitoring alerts, in CDN dashboards. This guide focuses on the ones that actually wake people up.
The Five Categories of HTTP Status Codes
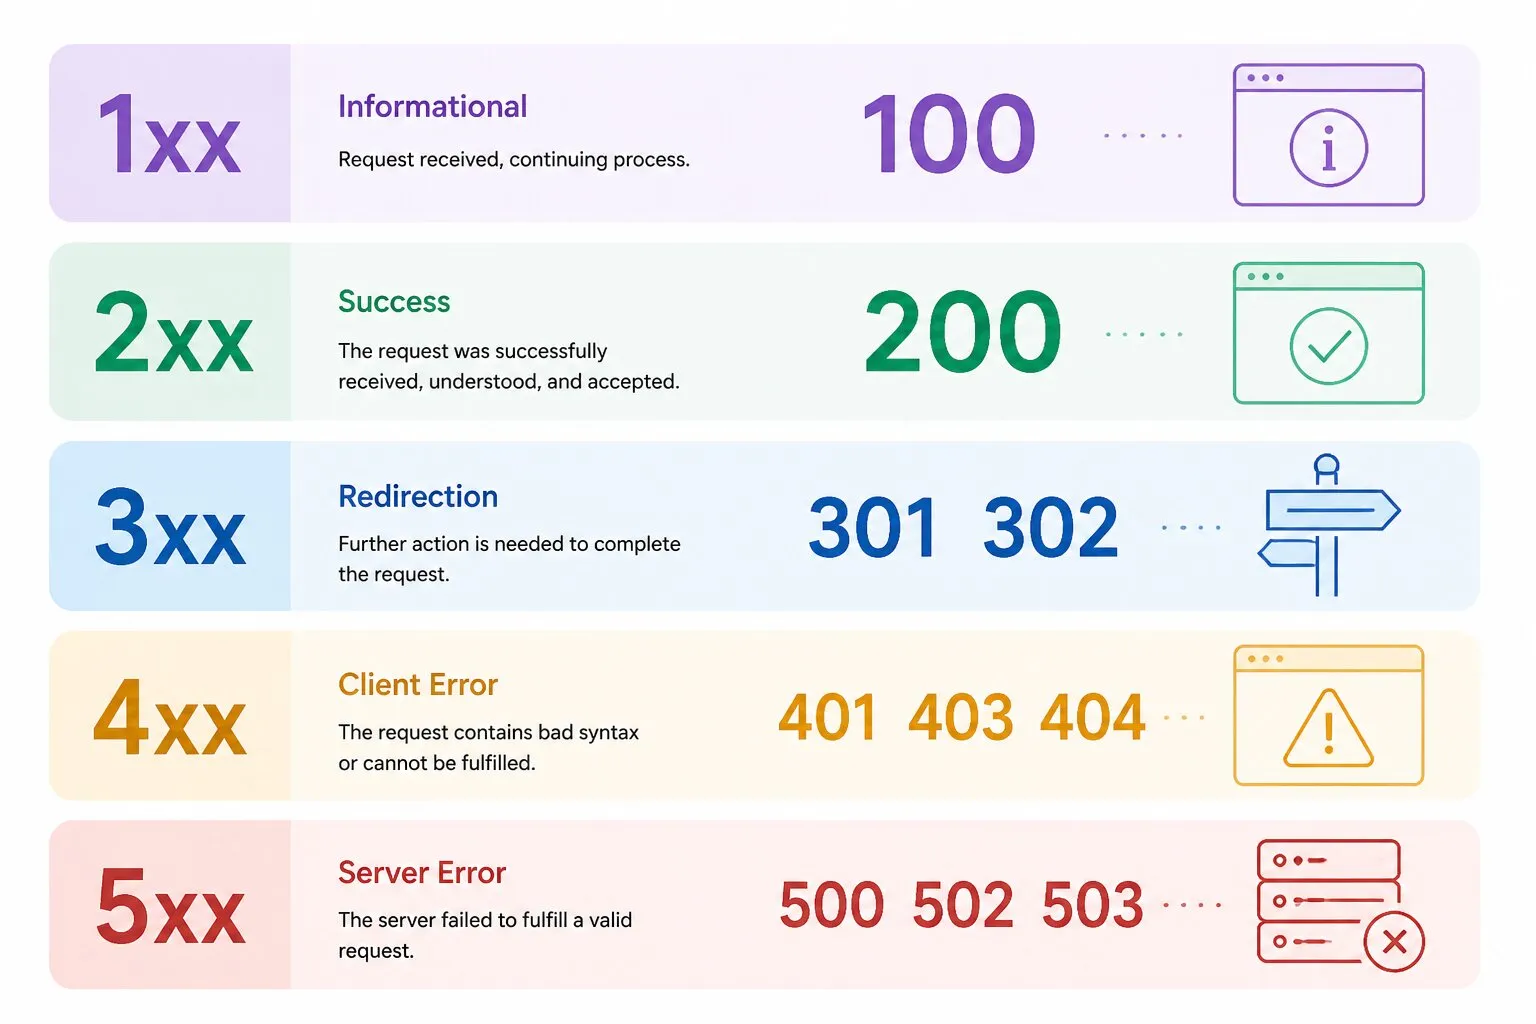
The first digit of the code tells you the response class:
- 1xx Informational. Rare in day-to-day work. Mostly used for protocol negotiation (100 Continue, 101 Switching Protocols for WebSocket upgrades).
- 2xx Success. The request worked. 200 is the default; 201 means a resource was created; 204 means success with no body.
- 3xx Redirection. The resource lives somewhere else. Browsers and crawlers follow these automatically up to a limit.
- 4xx Client Error. The request was wrong. Bad URL, missing auth, blocked permissions, malformed payload.
- 5xx Server Error. The request was fine. The server failed to fulfill it.
The split between 4xx and 5xx is the part that matters most for triage. A 4xx says “the caller did something wrong.” A 5xx says “we did something wrong.” The first goes to whoever called the endpoint. The second goes to you.
For a full enumeration, the complete HTTP status code reference in the Dotcom-Monitor wiki lists every code defined in the spec. The rest of this guide focuses on the ones that actually show up in alerts.
The Ten Most Common HTTP Status Codes
200 OK
The server processed the request and returned the expected response. This is the code you want to see on the vast majority of requests to a healthy production site.
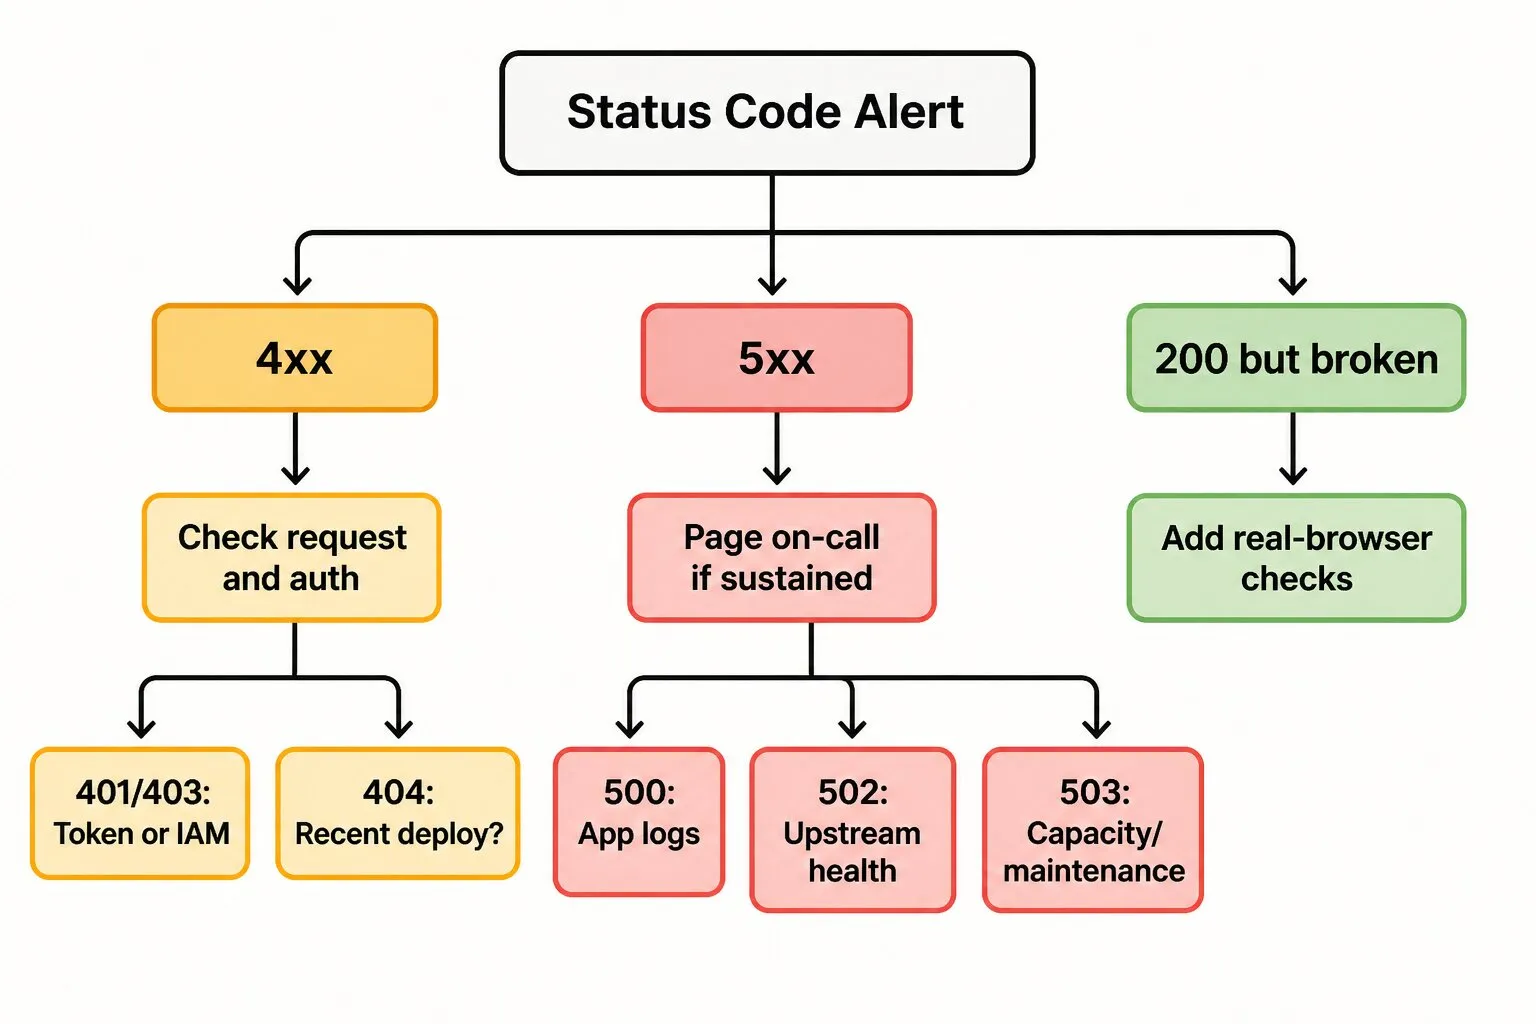
Watch out for: a 200 OK is not proof that the page is correct. JavaScript can fail silently and render a blank page. An API can return 200 with an error body. A login form can show “invalid credentials” inside a 200 response. Status-code-only checks miss these. Pair them with real-browser checks (more on this below).
301 Moved Permanently
The resource has a new permanent URL. Browsers cache the redirect aggressively. Search engines transfer most link equity to the target.
Use it for: URL changes after a site migration, swapping HTTP to HTTPS, consolidating duplicate paths, retiring old slugs. Once a 301 is live and cached, rolling it back is painful—browsers and crawlers will keep going to the new location for weeks.
302 Found (Temporary Redirect)
The resource is temporarily somewhere else. Browsers do not cache the redirect, and search engines do not pass full link equity.
Watch out for: 302 is overused. Teams reach for it because the framework default redirect helper returns 302. If the move is permanent, use 301. If you need to preserve the HTTP method (POST stays POST), use 307 or 308 instead. Google will eventually treat persistent 302s as 301s, but “eventually” isn’t a strategy.
400 Bad Request
The server can’t parse the request. Malformed JSON, invalid headers, oversized payloads, schema violations.
Check first: the request body. A spike in 400s on an API endpoint usually means a client started sending the wrong shape—a deploy on the consumer side, a schema change on yours, or a third-party integration that updated their format. Diff the request payload against your last known good version.
401 Unauthorized
The request has no credentials, or credentials that were rejected. The name is misleading—the issue is authentication, not authorization.
Check first: tokens. A sudden 401 spike on previously working endpoints often means a token expired, a signing key rotated, an OIDC provider had an outage, or someone changed the audience claim. If your API availability monitoring shows 401s where 200s used to live, the auth layer is usually the culprit.
403 Forbidden
The credentials are valid, but the caller is not allowed to access this resource. The issue is authorization, not authentication.
Check first: permissions and infrastructure rules. 403s show up when an IAM policy changes, a WAF rule starts blocking legitimate traffic, a CDN access policy gets too aggressive, or a feature flag flips for the wrong user segment. If 403s started right after a deploy, look at policy and config diffs before app code.
404 Not Found
The server understood the request but has no resource at that URL. The most famous status code in existence.
Two scenarios to separate:
- One-off 404s from typos, old bookmarks, or crawlers probing for vulnerabilities. These are background noise.
- A burst of 404s on canonical URLs right after a deploy. That’s a broken release—routes got dropped, a build artifact is missing, or someone shipped a slug change without redirects. Roll back or push a hotfix.
Persistent 404s on indexed pages will eventually get de-indexed by Google, so canonical pages throwing 404 also have an SEO cost.
Fixing It
Quick path: if the page moved, add a 301 redirect from the old URL to the new one so users and crawlers land in the right place. If the page is truly gone, return a real 404 or 410 rather than a vague homepage redirect.
Real fix: audit the source of the 404s. Broken internal links get fixed at the source; missing routes after a deploy get a hotfix; a bad migration that dropped slugs needs a redirect map. Crawl your own site periodically so you find dead links before Google does.
500 Internal Server Error
The server hit an unhandled exception. The catch-all 5xx. It tells you something broke but not what.
Check first: application logs. Every 500 has a stack trace somewhere—if it doesn’t, your logging needs work before your code does. Common triggers: an uncaught exception in a recently deployed code path, a downstream dependency returning an unexpected shape, a database connection pool exhausted, an out-of-memory restart loop. A sustained 500 spike on a production endpoint should page on-call.
Fixing It
Quick path: if the spike started right after a release, roll back. A 500 that appears within minutes of a deploy is the deploy until proven otherwise.
Real fix: read the stack trace and patch the failing code path, then add a regression test so it doesn’t come back. If the trigger was a resource ceiling—connection pool, memory, file handles—raise the limit and add an alert before you hit it next time.
502 Bad Gateway
A proxy, load balancer, or CDN got an invalid response from the upstream server. The proxy itself is healthy. The thing behind it is not.
Check first: upstream health. Common triggers: an app container crashed and the load balancer is still routing to it, the upstream is timing out before responding, a Kubernetes pod is in CrashLoopBackOff, an Nginx worker is misconfigured, or the connection between proxy and upstream got reset. 502 is one of the highest-signal codes for layered architectures—it tells you the edge is fine and the problem is one hop in.
Fixing It
Quick path: restart or replace the unhealthy upstream instance and confirm the load balancer’s health checks are actually removing dead nodes from rotation.
Real fix: find why the upstream returned garbage. Check whether the proxy’s timeout is shorter than the upstream’s real response time, whether the pod is crash-looping on startup, and whether keep-alive settings match on both sides of the connection.
503 Service Unavailable
The server is temporarily unable to handle the request. Capacity exhausted, maintenance mode, autoscaler still spinning up.
Check first: resource saturation and rate limits. 503s during a traffic spike usually mean the autoscaler can’t keep up or you’ve hit a connection limit. 503s in a steady state usually mean a process is in maintenance mode or a queue is backed up. Some platforms also return 503 when an upstream WAF or anti-bot system rate-limits a caller—worth checking before assuming the app is the problem.
Fixing It
Quick path: return the 503 with a Retry-After header so well-behaved clients and crawlers back off instead of hammering a struggling server. In PHP:
http_response_code(503);
header('Retry-After: 60');
Real fix: find the saturated resource—database connections, worker pool, autoscaler ceiling—and remove the bottleneck. If the 503 came from a CDN or WAF rate limit, raise the limit or allowlist the legitimate caller.
Other Codes Worth Knowing
The ten above cover most production traffic. But a handful of others show up often enough in real incidents that on-call engineers should know them on sight.
- 304 Not Modified. Sent when a cached resource is still fresh. Common in CDN-fronted traffic. A drop in 304s can mean your cache-control headers changed and you’re paying for origin bandwidth you used to save.
- 307 Temporary Redirect. Like 302, but preserves the HTTP method. A POST stays a POST. Use 307 instead of 302 when redirecting form submissions or non-idempotent API calls.
- 308 Permanent Redirect. Like 301, but preserves the HTTP method. The modern choice when permanently redirecting API endpoints that handle POST, PUT, PATCH, or DELETE.
- 429 Too Many Requests. Rate limit hit. You’re either being throttled by an upstream API or you’re throttling someone yourself. Check
Retry-Afterheaders; respect them. - 504 Gateway Timeout. A proxy gave up waiting for the upstream. Different from 502 in that the upstream didn’t return a bad response—it returned no response in time. Usually a long-running query, a frozen worker, or a downstream API that’s slow.
301 vs 302 vs 307 vs 308
The four redirect codes get mixed up constantly. The difference comes down to two things: whether the move is permanent, and whether the HTTP method survives the redirect.
| Behavior | 301 | 302 | 307 | 308 |
|---|---|---|---|---|
| Permanence | Permanent | Temporary | Temporary | Permanent |
| Method preserved | Not guaranteed | Not guaranteed | Yes | Yes |
| Cached by browsers | Aggressively | No | No | Yes |
| Link equity passed | Most | Limited | Limited | Most |
| Use when | Permanent URL move | Short-lived change | Form or POST redirect | API endpoint moved for good |
For a plain page that moved for good, use 301. When the redirect has to keep a POST as a POST—a form submission or a non-idempotent API call—reach for 307 if the move is temporary or 308 if it’s permanent.
The Complete HTTP Status Code Reference
The codes above cover almost everything that fires a real alert. For the unusual ones—the codes that show up once a quarter and make you stop and look something up—here is the full standard list, plus the non-standard codes you’ll see from common infrastructure vendors.
1xx Informational
The server has received the request and is continuing to process it. You’ll rarely see these in application logs because most clients and proxies handle them transparently.
| Code | Meaning |
|---|---|
| 100 | Continue |
| 101 | Switching Protocols |
| 102 | Processing |
| 103 | Early Hints |
2xx Success
The request was received, understood, and accepted. 200 is the workhorse; the rest matter when you’re building APIs or working with partial content, WebDAV, or batch operations.
| Code | Meaning |
|---|---|
| 200 | OK |
| 201 | Created |
| 202 | Accepted |
| 203 | Non-Authoritative Information |
| 204 | No Content |
| 205 | Reset Content |
| 206 | Partial Content |
| 207 | Multi-Status |
| 208 | Already Reported |
| 226 | IM Used |
3xx Redirection
The resource lives somewhere else, or the cached copy is still good. 301 and 302 dominate; the rest matter for APIs (307/308 preserve the HTTP method) and caching pipelines (304 saves origin bandwidth).
| Code | Meaning |
|---|---|
| 300 | Multiple Choices |
| 301 | Moved Permanently |
| 302 | Found |
| 303 | See Other |
| 304 | Not Modified |
| 305 | Use Proxy (deprecated) |
| 306 | Switch Proxy (unused) |
| 307 | Temporary Redirect |
| 308 | Permanent Redirect |
4xx Client Errors
The request was wrong. Most of these you’ll never see; the half-dozen common ones show up daily. Worth knowing the rare ones exist so you don’t waste time guessing when a 418 or 451 lands in a log.
| Code | Meaning |
|---|---|
| 400 | Bad Request |
| 401 | Unauthorized |
| 402 | Payment Required |
| 403 | Forbidden |
| 404 | Not Found |
| 405 | Method Not Allowed |
| 406 | Not Acceptable |
| 407 | Proxy Authentication Required |
| 408 | Request Timeout |
| 409 | Conflict |
| 410 | Gone |
| 411 | Length Required |
| 412 | Precondition Failed |
| 413 | Payload Too Large |
| 414 | URI Too Long |
| 415 | Unsupported Media Type |
| 416 | Range Not Satisfiable |
| 417 | Expectation Failed |
| 418 | I’m a teapot |
| 421 | Misdirected Request |
| 422 | Unprocessable Content |
| 423 | Locked |
| 424 | Failed Dependency |
| 425 | Too Early |
| 426 | Upgrade Required |
| 428 | Precondition Required |
| 429 | Too Many Requests |
| 431 | Request Header Fields Too Large |
| 451 | Unavailable For Legal Reasons |
5xx Server Errors
The request was fine. Something on the server side failed. These are the codes most likely to wake somebody up.
| Code | Meaning |
|---|---|
| 500 | Internal Server Error |
| 501 | Not Implemented |
| 502 | Bad Gateway |
| 503 | Service Unavailable |
| 504 | Gateway Timeout |
| 505 | HTTP Version Not Supported |
| 506 | Variant Also Negotiates |
| 507 | Insufficient Storage |
| 508 | Loop Detected |
| 510 | Not Extended |
| 511 | Network Authentication Required |
Non-Standard and Vendor Codes
Cloudflare, Nginx, Microsoft, and Akamai all return codes outside the official spec when their infrastructure layer fails. These are the ones to recognize on sight because they tell you the failure is in the edge, not your origin.
| Code | Meaning |
|---|---|
| 419 | Authentication Timeout |
| 420 | Enhance Your Calm / Method Failure |
| 440 | Login Timeout (Microsoft) |
| 444 | No Response (Nginx) |
| 449 | Retry With (Microsoft) |
| 450 | Blocked by Windows Parental Controls |
| 460 | Client Closed Connection |
| 494 | Request Header Too Large (Nginx) |
| 495 | SSL Certificate Error (Nginx) |
| 496 | SSL Certificate Required (Nginx) |
| 497 | HTTP Request Sent to HTTPS Port |
| 498 | Invalid Token |
| 499 | Client Closed Request (Nginx) |
| 509 | Bandwidth Limit Exceeded |
| 520 | Unknown Error (Cloudflare) |
| 521 | Web Server Is Down (Cloudflare) |
| 522 | Connection Timed Out (Cloudflare) |
| 523 | Origin Is Unreachable (Cloudflare) |
| 524 | A Timeout Occurred (Cloudflare) |
| 525 | SSL Handshake Failed (Cloudflare) |
| 526 | Invalid SSL Certificate (Cloudflare) |
| 527 | Railgun Error (Cloudflare) |
| 529 | Site Overloaded |
| 530 | Site Frozen / Origin DNS Error |
| 561 | Unauthorized (Akamai) |
| 598 | Network Read Timeout |
| 599 | Network Connect Timeout |
Code ranges not listed above (104-199, 209-225, 227-299, 309-399, 432-450, 452-499, 512-599) are either unassigned, deprecated, or reserved for vendor use. Treat any code in those ranges as vendor-specific and check your infrastructure’s documentation.
The Codes Your Monitoring Should Actually Alert On
Out of the 60+ codes above, the ones that earn alert thresholds in most production setups are a much shorter list:
- 200—as a baseline ratio. A sudden drop means something else is going wrong.
- 301, 302, 307, 308—redirect counts. Spikes can mean misconfigured routing or a deploy that broke canonical URLs.
- 400—malformed requests. Usually a consumer-side change.
- 401, 403—auth and permission failures. Often a token, IAM, or WAF change.
- 404—missing resources. Background noise as one-offs; a release problem in bursts.
- 408—client timeouts. Worth alerting at sustained rates; signals slow downstream calls.
- 429—rate limiting. Either you’re being throttled or your throttle is too aggressive.
- 500, 502, 503, 504—application, upstream, capacity, and gateway timeout failures. These page on-call.
- 520-526—Cloudflare edge failures. If you’re behind Cloudflare, these are critical signals because they isolate the failure to the edge-to-origin path.
Everything else is worth logging but rarely worth waking somebody up over.
How to Check the HTTP Status Code of a Page
Before you can act on a code, you have to see it. Three ways, from quickest to most thorough.
In Chrome DevTools
- Open the page.
- Right-click anywhere and choose Inspect, then open the Network tab.
- Reload. The first document request shows the code in the Status column.
From the Command Line
A header-only request returns the status line without downloading the body:
c url -I https://example.comThe first line of the response is the status code—for example, HTTP/2 200.
At Scale
Single-shot checks tell you the current state. They won’t catch the failure that happens at 3 a.m. and clears before you wake up. To catch intermittent failures, you need scheduled checks from multiple regions—which is what synthetic monitoring does.
When a 200 OK Lies
An e-commerce team gets paged at 11 a.m. on a Tuesday. Conversion is down 80 percent. They check their uptime dashboard. Every endpoint is green. Every status code is 200. Every region reports the site is up.
The site is not up. A deploy 40 minutes earlier shipped a JavaScript bundle that throws on the checkout page. The HTML renders, the server returns 200, the status-code monitor sees 200, no alert fires. Users see a blank cart and bounce.
This is the failure mode pure status-code monitoring can’t catch. The fix is layered:
- Run real-browser checks on critical user paths—home, search, product, cart, checkout. Real browsers execute the JavaScript and surface client-side errors that a curl-style check misses.
- Watch for body-level signals: keyword presence, element visibility, expected response structure. Don’t trust the status code alone.
- Tie deploys to monitoring: any check that goes from green to red within 15 minutes of a release should auto-tag the deploy. Half of post-mortem time is figuring out what changed; the monitoring system already knows.
What Is a Soft 404?
One version of this problem has a name: the soft 404. A soft 404 is a page that returns 200 OK while telling the user the content doesn’t exist—a “page not found” message served with a success code. Google’s guidance is to return a real 404 or 410 instead, because soft 404s waste crawl budget and confuse the index about which pages are real.
Pure status-code monitoring won’t catch a soft 404, for the same reason it misses a broken checkout: the code says 200. Real-browser checks with body assertions—looking for the actual content you expect, or the absence of a “not found” string—will.
How HTTP Status Codes Affect SEO
Search engines use status codes to decide what to crawl, what to index, and how often to come back. Three patterns matter:
- 4xx codes erode the index over time. A page that returns 404 for several crawl attempts gets dropped. If you delete a page, redirect it with 301 instead of letting it 404.
- 5xx codes slow crawling and damage rankings. Googlebot interprets persistent 5xx as “this site is unhealthy.” Crawl rate drops, indexing slows, rankings can fall.
- 301 vs 302 matters. 301 passes link equity. 302 is treated as temporary and may not. If the move is permanent, choose 301.
The practical takeaway: 5xx errors aren’t just an availability problem. They’re an SEO problem that compounds the longer they persist. DNS, TCP, TLS, and HTTP errors each have a different SEO cost—knowing which layer is failing helps you triage faster.
Monitoring HTTP Status Codes Without Drowning in Alerts
Every team that monitors HTTP traffic eventually runs into the same problem: too many alerts, not enough signal. A few practices keep status code monitoring useful instead of noisy.
Alert on rates, not single requests. One 500 is noise. Fifty 500s in five minutes is an incident. Configure thresholds against your baseline traffic volume.
Separate user-facing endpoints from internal ones. A 500 on the checkout API should page. A 500 on an admin endpoint nobody’s hitting can wait until business hours.
Test from where your users are. A check from one data center won’t catch a regional CDN failure. Use a monitoring network with multiple geographies to spot location-specific issues before customers do.
Combine status checks with content checks. 200 OK is a starting point, not a finish line. Validate that the response contains what it should.
Dotcom-Monitor’s web application monitoring handles all four: rate-based alerting, endpoint segmentation, global monitoring locations, and real-browser content checks. For API-heavy stacks, the API monitoring path adds schema validation and response-time SLOs on top of status code checks. Both feed the same alerting pipeline so you’re not stitching together signals from three vendors.
Closing Thoughts
The most common HTTP status codes haven’t changed in years. 200, 301, 404, 500, 502, 503—you’ll see all of them this week. What changes is how fast your team gets from “saw the code” to “fixed the cause.”
That gap is where good monitoring pays off. Status codes alone tell you something happened. Layered checks—status, content, real-browser, multi-region—tell you what, where, and what to do next.
If you want to see what that looks like, Dotcom-Monitor has a free trial. Point it at one of your endpoints and see what it surfaces.
