Uptime and SLA Reports
Prove your API reliability with transparent, data-backed reporting
Dotcom-Monitor Uptime and SLA Reports help teams detect outages quickly, track long term performance, and demonstrate contractual reliability with verifiable monitoring data.
⭐ G2 Top Performer | SOC 2 Type II | 99.99 % Uptime SLA | ISO 27001 Certified
Trusted by 10,000+ Organizations Worldwide
Website monitoring leader since 1998
Reliability defines customer trust
Every minute of downtime affects user confidence and revenue.
Consistent API uptime is not only a backend concern. It shapes how customers perceive your brand, how partners rely on your systems, and how stakeholders evaluate your operational maturity.
SLA compliance as a business promise
Service Level Agreements define the uptime that customers and partners should expect.
Your ability to measure, document, and share SLA metrics determines how credible that promise feels to your users and how easy it is to renew or expand contracts.
The visibility gap in traditional monitoring
Many monitoring tools only send a basic alert when an API is down.
They often lack clear historical views, easy exports, or structured SLA summaries that business stakeholders can understand.
Dotcom-Monitor closes this gap with:
- Uptime reports that summarize availability across days, weeks, or months so you can prove long term reliability.
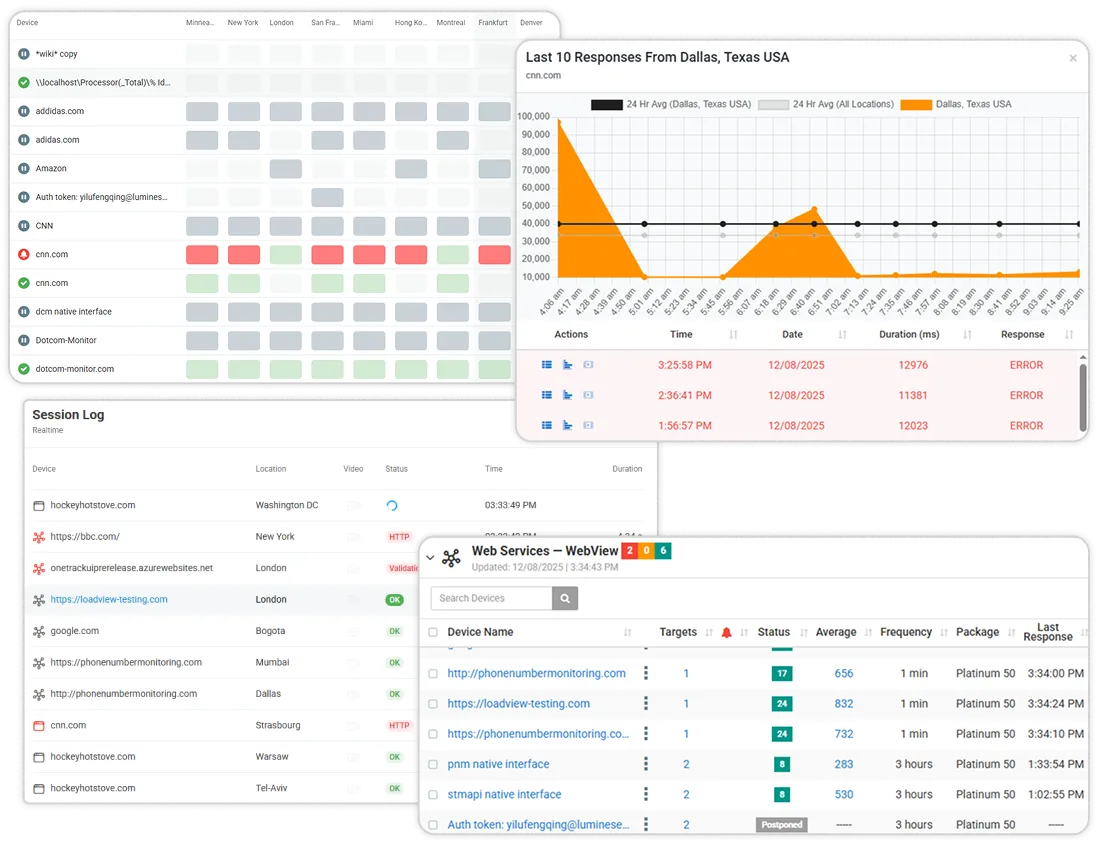
- Performance and error reports that show where issues occurred during the reporting period so engineering can investigate root causes.
- Exportable formats that make it simple to share results with customers, auditors, or leadership.
See how uptime fits into your complete API performance strategy on the Web API Monitoring product page.
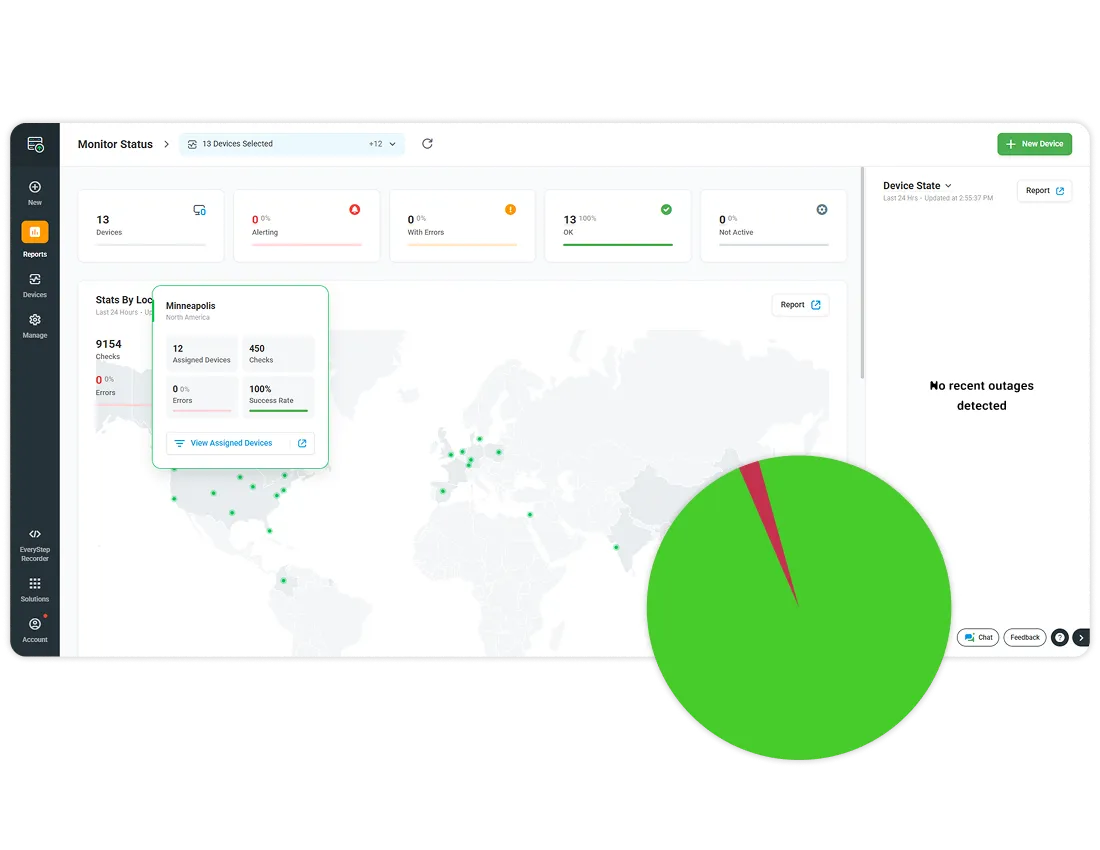
How Dotcom-Monitor Tracks API Uptime
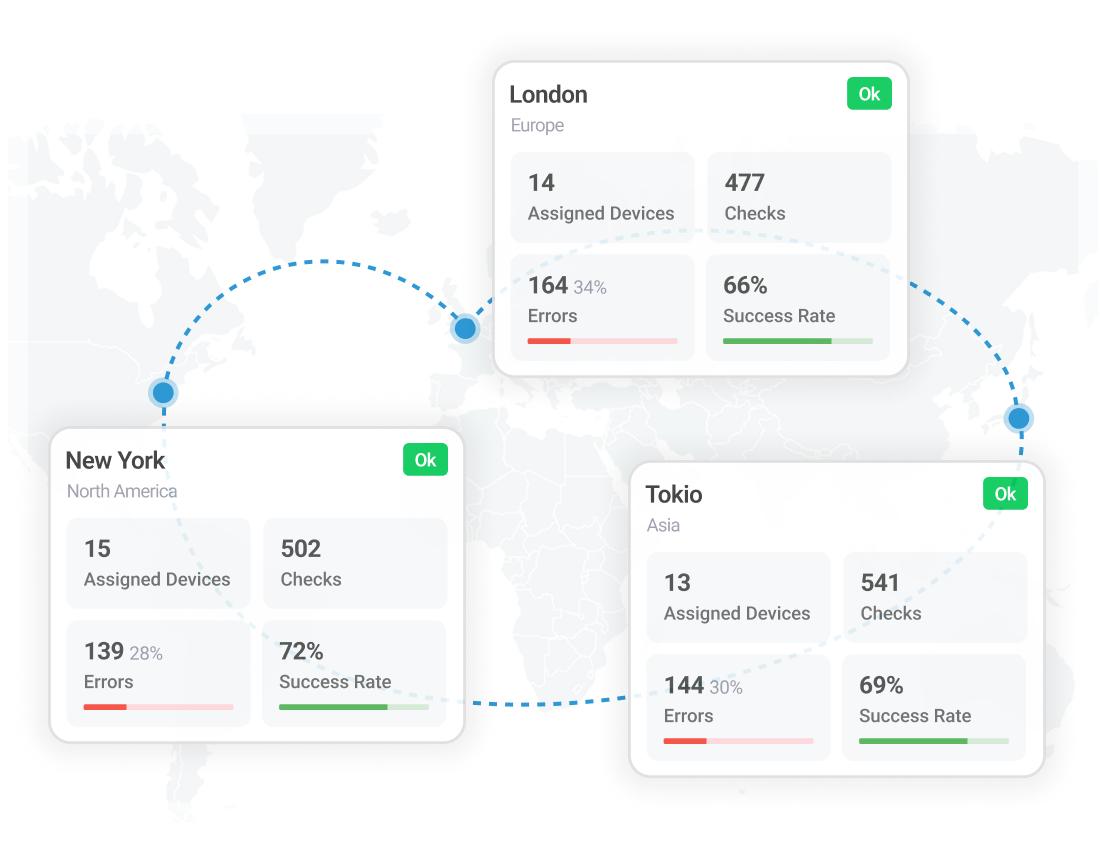
Real time monitoring from global checkpoints
Dotcom-Monitor runs checks from multiple global locations so you can see how APIs behave for users around the world.
From these checkpoints you can:
- Detect issues that affect only specific regions or networks, rather than assuming every failure is global.
- Understand latency differences between locations using performance reports.
- Confirm that recent fixes are working from all configured regions.
Accurate uptime calculations with retry logic
Dotcom-Monitor uses standard checks and retry behavior so that short lived network glitches do not immediately skew your uptime percentage.
- Monitors can recheck an endpoint after a failure to confirm whether the outage is ongoing.
- Validated results are then used to calculate uptime for the reporting period.
- This approach helps your SLA numbers reflect true availability rather than transient network noise.
Detect outages and trigger alerts
Configure alert conditions so you know when uptime drops below your expectations.
- Create thresholds for failed checks, error responses, or connection problems.
- Route alerts to email, SMS, or integrated tools such as Slack, Teams, or PagerDuty.
- Use escalation workflows to notify additional contacts if an incident is not resolved within a defined period.
Build your first multi-step API or browser transaction monitor
💡 Note: Both monitoring types complement each other; API-level checks ensure backend reliability, while browser-based recording validates full end-to-end user experiences.
SLA Reporting and Visualization
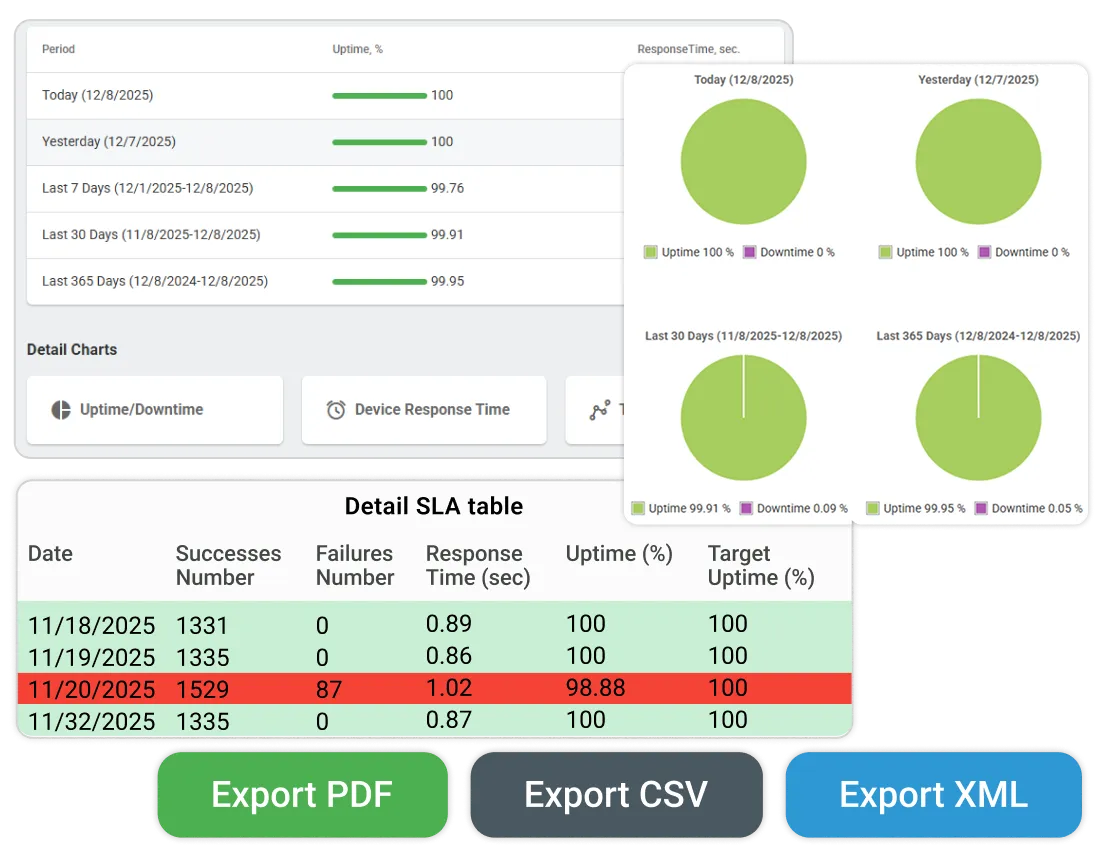
Generate detailed SLA compliance reports
Dotcom-Monitor provides reporting views that summarize availability, failure counts, and related metrics against your SLA targets.
Within these reports you can:
- View uptime percentages across chosen time ranges such as 7, 30, or 90 days.
- See error counts and status code distribution to understand why downtime occurred.
- Compare actual uptime to your SLA target to confirm whether you met the commitment.
Customize reporting intervals and data views
Different audiences care about different windows of time. Dotcom-Monitor allows you to tailor views so each stakeholder sees the information they need.
- Filter reports by custom date ranges to align with billing cycles or contract periods.
- Group results by device or device group to isolate specific services.
- Focus on a particular monitoring location or set of locations when investigating regional issues.
Export SLA reports for internal or client review
You can download SLA and uptime data in formats that make sharing and archiving easy.
- Export PDF reports for quick executive reviews and client summaries.
- Export CSV files for spreadsheet analysis, trending, or custom charting.
- Export XML for integration with internal systems or long term storage.
These exports are suitable for compliance documentation, quarterly business reviews, and incident postmortems.
Review SLA metrics for multiple monitored APIs
If you monitor several APIs or endpoints with Dotcom-Monitor, you can evaluate their SLA performance together.
- Organize monitored APIs into SLA groups so you can assess related services in a single view.
- Review uptime results for each API within the group to see which ones are consistently strong performers.
- Identify APIs that regularly run close to or below your SLA target so you can prioritize improvements.
Using SLA Reports for Continuous Improvement
Identify recurring downtime patterns
Historic SLA reports help teams move beyond “what happened” and into “why it keeps happening.”
- Compare incidents across months to spot patterns tied to specific deployments, regions, or time windows.
- Use error type and status code information to determine whether issues are related to infrastructure, application logic, or third party dependencies.
- Feed these insights into capacity planning, redundancy improvements, and release practices.
Validate vendor or third-party service reliability
APIs often depend on external services such as payment gateways, identity providers, or data vendors.
- Use uptime and error reports to verify whether these providers are meeting their own SLAs.
- Share evidence during vendor reviews to support contract discussions or escalation.
- Document third party outages that affected your own availability for future reference.
Review uptime, latency, and assertion metrics across separate reports
Uptime is only one part of API health. Other Dotcom-Monitor features provide additional dimensions.
- Use performance reports to examine response time, latency trends, and location based differences.
- Use assertions and validation reports to see whether responses contain the expected fields and values.
- Combine insights from these different reports to build a complete picture of reliability, speed, and data correctness.
Ensure secure endpoints stay available and compliant with SLAs by combining this feature with OAuth API Monitoring and Assertions Monitoring.
Automate and Share Reports With Your Team
Scheduled report delivery
Dotcom-Monitor can generate and deliver recurring reports so stakeholders stay informed without manual exports.
- Configure automated reports on a daily, weekly, or monthly schedule that aligns with business reviews.
- Send reports directly to distribution lists so engineering, operations, and leadership receive the same information at the same time.
- Reduce the chance that important SLA conversations are delayed because data was not ready.
Share SLA dashboards based on account permissions
Dotcom-Monitor supports user roles and permissions within the account so that access to reporting reflects organizational structure.
- Grant team members access to specific devices, groups, or reporting areas through account level permissions.
- Allow engineering or SRE teams to drill into detailed reports while giving leadership access to high level summaries.
- Maintain security by limiting edit capabilities to authorized administrators.
Use exports with external analytics tools
Dotcom-Monitor does not include native connectors for Grafana or Power BI. Instead, it provides flexible exports that can be imported into many BI platforms.
- Export uptime and SLA data in CSV files and load them into dashboards you maintain in Grafana, Power BI, or other tools.
- Use XML exports when your internal systems expect structured data feeds.
- Combine these imports with other observability data so your BI environment reflects a complete view of digital health.
Start Tracking Your API Uptime and SLA Performance
Build confidence in your APIs and provide proof for your partners and customers.
With Dotcom-Monitor Uptime and SLA Reports, you can:
- Prove SLA compliance using verifiable monitoring data collected from global locations.
- Improve reliability using historic insights that highlight recurring issues.
- Strengthen transparency by sharing automated reports with internal and external stakeholders.
Get answers
Frequently Asked Questions
An API uptime report shows how consistently your endpoints remained available and responded to monitoring checks during a selected time period. It summarizes availability based on successful and failed tests across all configured locations.
Dotcom-Monitor uses monitoring results to calculate uptime percentages over the reporting window, then compares those values to SLA thresholds that you define in your configuration and reports whether targets have been met.
Yes. You can export uptime and SLA reports in PDF, CSV, or XML formats so you can share them with clients, attach them to audit packages, or archive them for long term records.
Yes. You can configure multiple monitored APIs in Dotcom-Monitor and include them in the same SLA reporting structure, which makes it easier to analyze the reliability of related services together.
All-in-One Web API Monitoring | Simple. Powerful. Proven.
No credit card required. All premium features included. 24×7 expert support.