Assertions Monitoring
Validate API Logic, Not Just Uptime
Dotcom-Monitor Assertions Monitoring verifies the correctness of your API responses at every step. Check response fields, headers, conditions, authentication outputs, and multi-step logic to ensure your data behaves exactly as expected.

⭐ G2 Top Performer | SOC 2 Type II | 99.99 % Uptime SLA | ISO 27001 Certified
Trusted by 10,000+ Organizations Worldwide
Website monitoring leader since 1998
Watch How It Works
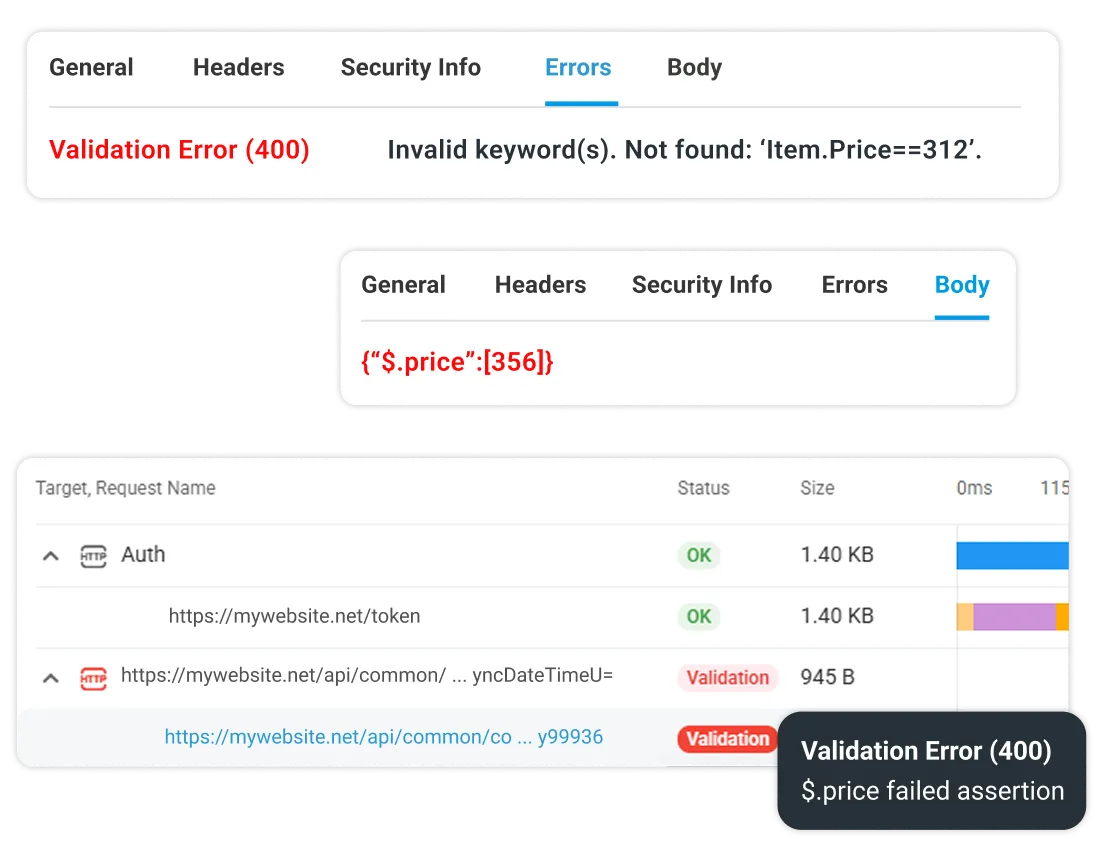
See how Dotcom-Monitor validates field-level logic in API responses and flags data issues with clear logs and test-level reporting.

Uptime Is Not Enough, Accuracy Builds Trust
A stable API can still return incorrect data.
A status 200 response does not guarantee that totals, IDs, or computed values are correct.
Assertions Monitoring verifies the content of each API response and alerts you when the data does not match expected business logic.
Example: If the order total in the response does not match the posted amount, the monitor logs the discrepancy and flags the condition in the step result.
Learn more about REST API Monitoring to combine uptime and field-level validation.
Data Integrity Protects User Experience
Incorrect pricing, balances, or KPIs can quietly harm user trust. Assertions help catch these issues before they reach production.
Industries benefiting from Assertions Monitoring:
- eCommerce: Confirm that prices, discounts, and stock counts match expected values.
- Fintech: Validate balances, transaction states, and ledger updates.
- SaaS Analytics: Verify metric thresholds, counters, and timestamp logic.
Assertions as Continuous Quality Gates
Assertions operate as always-on verification checkpoints that validate logic during every monitor run. They help teams move data validation into production and provide a reliable signal for SLO and error-budget planning.
💡 Try our API SLO and Error Budget Calculator to understand how validation failures impact your reliability targets.
How Assertions Work in Dotcom-Monitor
Define Logic Using Conditions on Any Response Element
Assertions can validate values in:
- JSON fields
- XML fields
- Response headers
- Response codes
- Step processing results
Use exact match, contains, numeric comparisons, or field existence checks.
Examples:
- “status equals success”
- “price greater than 0”
- “response contains transactionId”
Assertions require no code, and can be added directly within the HTTP or HTTPS task configuration.
Learn how assertions complement performance and uptime checks in our API Monitoring overview.

Correlate Assertions With Performance Metrics
API monitors include charts and reports for:
- Response time
- Availability
- Errors and failed steps
- Assertion outcomes
You can view validation failures alongside timing metrics to understand whether latency or outages are contributing to data issues.
Explore Uptime and SLA Reports for compliance tracking.
Multi-Step Assertions With Parameter Passing
Dotcom-Monitor supports multi-step API sequences. Each step can extract values such as tokens, IDs, or keys and use them in subsequent requests.
Assertions can be applied at any step of the workflow.
Example:
- POST login
- Extract token
- GET orders with token
- Validate that status equals confirmed
Discover OAuth API Monitoring to validate Bearer token flows.

Supports:
- Variable extraction
- Conditional checks
- Early alerting when any step fails
Build your first multi-step API or browser transaction monitor
💡 Note: Both monitoring types complement each other; API-level checks ensure backend reliability, while browser-based recording validates full end-to-end user experiences.
Use Cases and Return on Investment
Scenario
Problem
Solution
Business Impact
E-commerce pricing
Wrong discount or sale price returned
Assertions compare expected and actual price fields
Prevents margin loss and customer confusion
Fintech ledger validation
Balances drift between systems
Assertions verify values for each transaction state
Restores confidence in financial integrity
API regression testing
Schema or response changes after a release
Assertions detect field changes before production
Reduces outages and accelerates recovery
Integrate Assertions Into CI/CD Workflows
Shift-Left Validation for API Quality
You can trigger monitors via API from any CI/CD platform and evaluate assertion results to determine whether a build should proceed.
Example logic:
If assertion failures are greater than zero, block deployment.
See CI/CD Integration to automate checks using API triggers.
Combine Assertions With REST, SLA, and Metrics Monitoring
Assertions become more powerful when combined with:
- REST API performance checks
- Uptime SLA reporting
- Custom Metrics
- Global monitoring locations
Together, these features provide complete visibility into correctness, speed, and reliability.
Visualize and Export Results Anywhere
Export API results such as logs, response bodies, headers, and reports through:
- XML
- CSV
These outputs can be imported into Grafana, Prometheus, or BI tools with manual configuration. Use the UserView Platform to filter data by geography, test type, or device.
Read more in Custom Metrics Analysis in Web App Monitoring.
Evaluator Proof and Conversion Drivers
Instant Proof
- Detailed request and response logs
- Field-level validation summaries
- Error codes and step breakdowns
- Exportable XML or CSV bundles for evaluation
Comparison Table
Feature
Dotcom-Monitor
Uptime-Only Tools
Multi-step validation
✅ Yes
❌ No
JSON and XML field checks
✅ Yes
Partial
Token extraction
✅ Yes
Partial
Log level visibility
✅ Yes
❌ No
XML and CSV export
✅ Yes
Partial
REST API Monitoring
Monitor REST APIs from Logic to Latency, in One Unified Dashboard.
Learn More About Web API Monitoring Features
Explore REST API Monitoring
Learn About OAuth Authentication Checks
Track Reliability With Uptime and SLA Reports
Automate Deployments with CI/CD Integration
Export Custom Metrics & Reporting Data
Monitor Dynamic Web Apps (SPA)
Get answers
Frequently Asked Questions
Assertions are conditions that verify the correctness of API responses, ensuring fields, headers, and codes match expected values.
Yes. Dotcom-Monitor can validate JSON and XML content by checking the existence and correctness of fields.
You receive a notification and can review detailed logs showing exactly which step and condition failed.
Yes. Assertions can be added to any step in a multi-step sequence.
Dotcom-Monitor sends alerts based on defined thresholds and first-error detection rules for multis-step sequences.
Yes. Export logs or share access within your Dotcom-Monitor account.
Yes. Assertions can be validated automatically by triggering monitors via API inside your CI/CD pipeline.
All-in-One Web API Monitoring | Simple. Powerful. Proven.
No credit card required. All premium features included. 24×7 expert support.