Home » Products » API Monitoring » REST API Monitoring
- REST API Monitoring
- Synthetic checks · 30+ regions
Never Get Paged for an API Outage You Didn’t See Coming With Dotcom-Monitor REST API Monitoring
Dotcom-Monitor runs real REST workflows against your endpoints from 30+ global locations — chains multi-step calls, validates every field of every response, and alerts your team the second something breaks. Catch partial failures, schema drift, and latency spikes before your users do.

- No credit card required
- All features included
- Live in under 5 minutes
- Cancel anytime · No auto-charge after trial
Multi-step scenarios
Monitor Real API Workflows, Not Isolated Endpoints
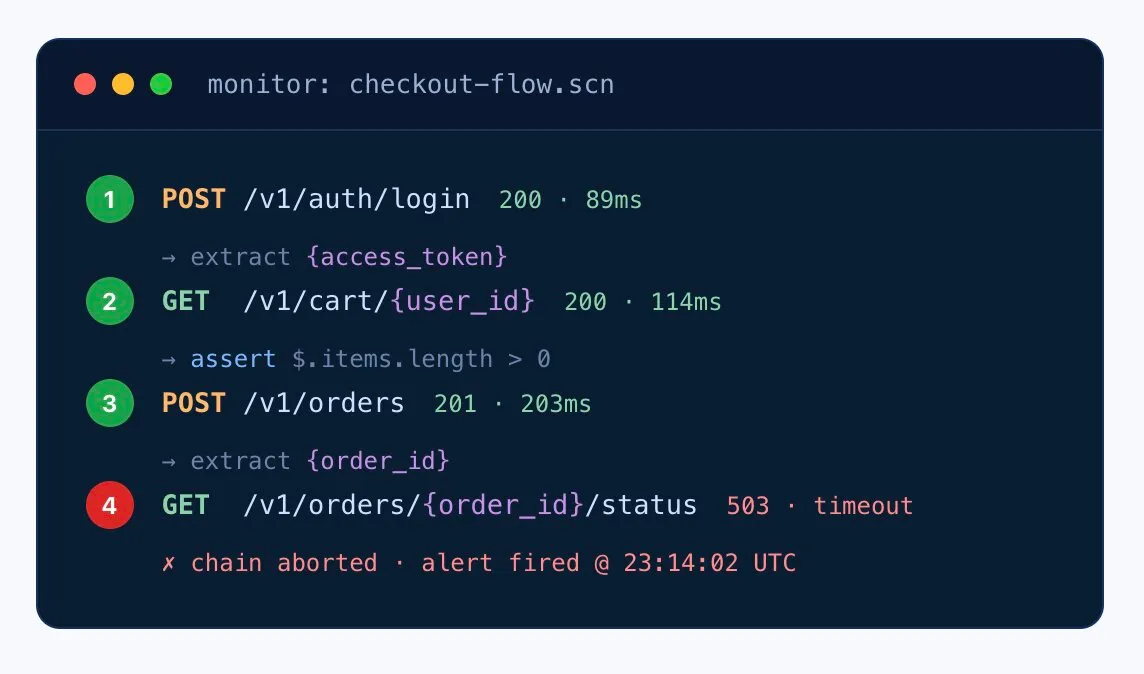
A working /health check doesn’t prove your business logic still works. Dotcom-Monitor chains real sequences — auth → fetch → mutate → verify — and validates every step. The moment the chain breaks, you know exactly where, why, and what the response payload looked like.
- Pass variables between calls — tokens, IDs, and dynamic values flow automatically from one step to the next.
- Per-step assertions — validate status, headers, schema, and payload contents on each request, not just the last one.
- Abort on first error — stop the chain when something breaks, capture full request/response logs for every step.
- Built for OAuth 2.0 + JWT — refresh tokens automatically, mask secrets in the Secure Vault.
Granular validation & alerting
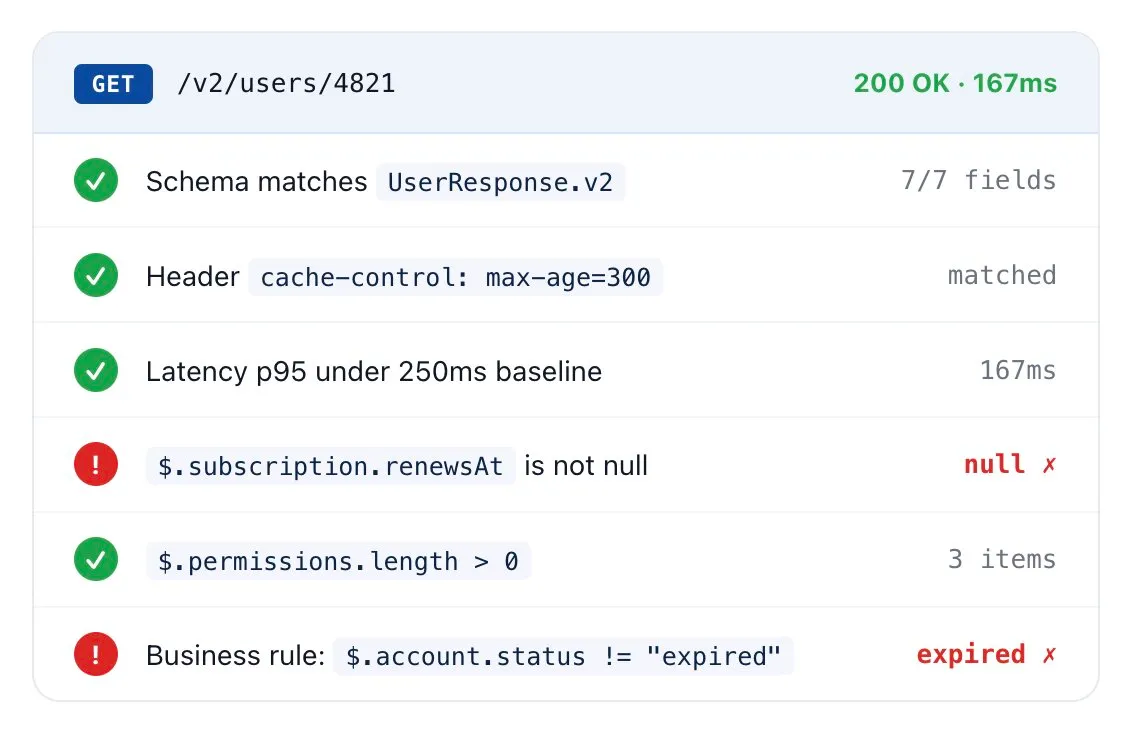
200 OK Isn’t Good Enough. Validate Every Field.
Half of API failures return a 200. Dotcom-Monitor inspects status, headers, JSON schema, XML nodes, and individual response fields — then escalates only the things that actually matter, so your on-call doesn’t learn to ignore the alerts.
- JSON / XML schema validation — detect missing keys, wrong types, null fields, and outdated values.
-
Business-rule assertions — express checks like
$.order.total > 0or$.status == "success". - Latency percentile thresholds — page only on p95/p99 deviations from baseline, not single noisy samples.
- Per-assertion alerting — route schema failures and SLA breaches to different channels and escalation paths.
Use cases
What DevOps Teams Actually Monitor With Us
Real scenarios from teams running production REST APIs at scale. Every one of these can be live in your account inside an hour.
Login → Checkout Flow
Chain auth, fetch cart, place order, poll confirmation. Catch the partial outage where login works but order placement silently 503s.
Webhook Delivery
Validate that your provider’s webhooks land at the right endpoint with the right schema — and that yours fire downstream when triggered.
Third-Party API Slas
Hold Stripe, Twilio, Auth0, or any upstream vendor accountable. Track latency and error rate against the SLA they sold you.
Regional Bottleneck Detection
Run the same checks from 30+ locations. Catch the CDN misconfiguration that only shows up from APAC, or the DNS rollout that didn’t propagate to EU-West.
Pre-Deploy Smoke Tests
Trigger monitor runs from your CI pipeline post-deploy. Gate the release on assertion results — block bad builds before they reach prod traffic.
Internal Microservices
Drop a Private Agent inside your VPC. Monitor service-to-service REST calls the same way you monitor public APIs — no inbound firewall rules.
Not ready for a trial?
Want a 15-Minute Walkthrough First?
A performance engineer will walk you through your first multi-step REST monitor — chained auth → fetch → assert — no sales pitch, just a working monitor by the end of the call.
Fits your stack
Plays Well With the Tools Your Team Already Runs
Slack
PagerDuty
Microsoft Teams
Opsgenie
Webhook
Email / SMS
Grafana
Prometheus
GitHub Actions
Jenkins
Azure DevOps
Power BI
Global monitoring network
Checks That Run Where Your Users Live
Dotcom-Monitor operates its own monitoring infrastructure across 30+ locations on six continents — including private agents you can deploy inside your VPC, behind firewalls, or on-prem.
That means you catch the regional outage, the DNS propagation gap, the CDN misroute — not just the global one.
30+
Global monitoring locations
6
Continents covered
1 min
Minimum check interval
Private Agents
For behind-firewall

Alerting that doesn’t cry wolf
The Right Person Paged. With the Right Context. The First Time.
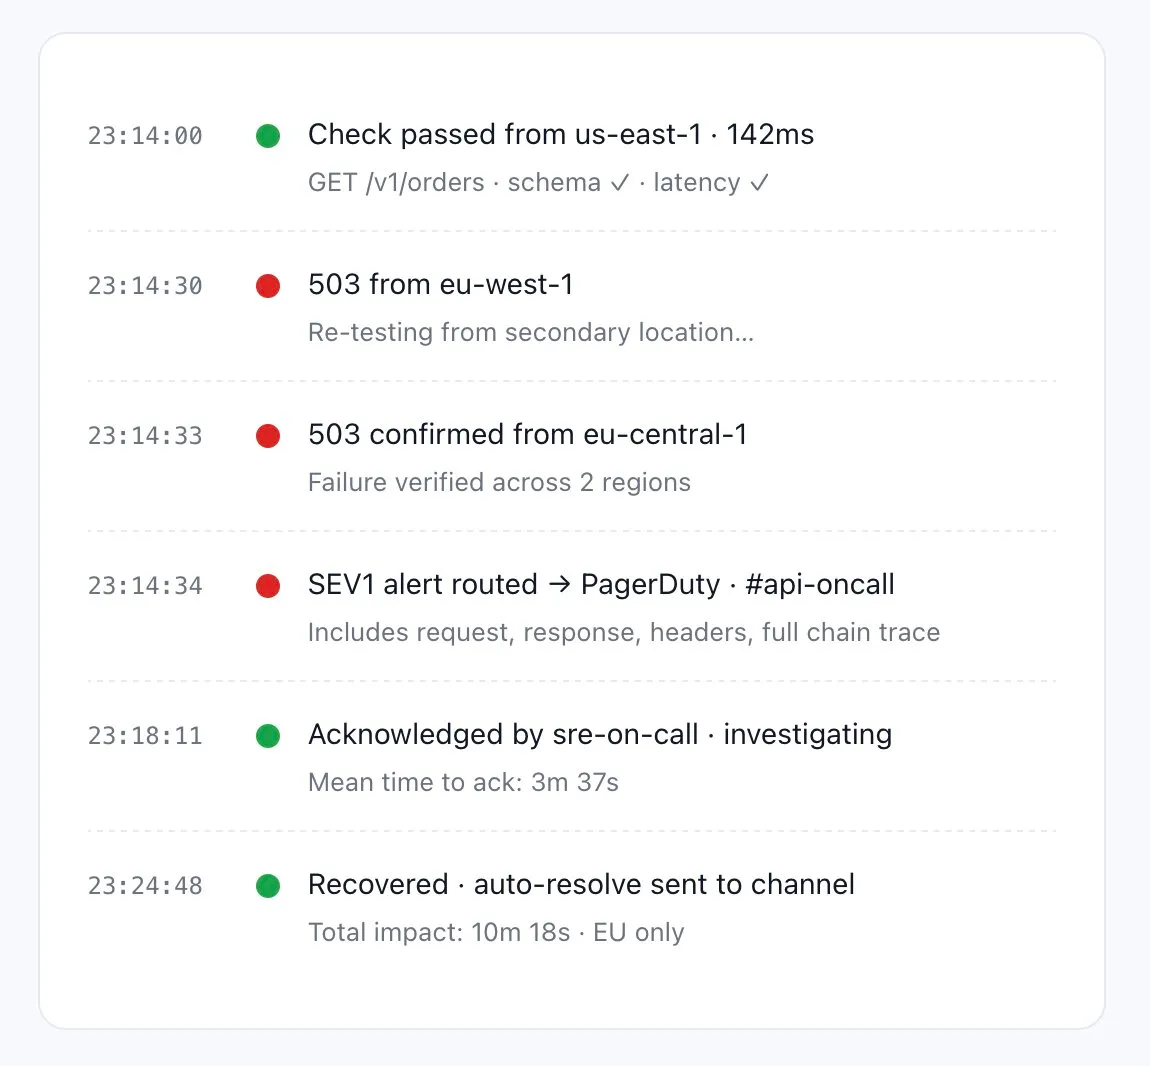
Wake-up-at-3am alerts only work when they’re trustworthy. Dotcom-Monitor routes by severity, suppresses noise, and gives the responder everything they need to triage in one notification — the failing request, the response body, which assertions broke, and which locations saw it.
- Multi-channel routing — page Slack for warnings, PagerDuty for SEV1, Teams for status updates.
- Failure confirmation — re-test from a second location before firing. No alerts on single noisy samples.
- Severity escalation — escalate up the on-call chain if not acknowledged inside your SLA window.
- Full forensic payload — every alert includes request, response, headers, and step-level traces.
Slack
PagerDuty
Opsgenie
MS Teams
Webhook
SMS / Voice
What teams say
Engineers Don’t Recommend Tools Lightly. They Recommend This One.
"I absolutely love the comprehensive monitoring services Dotcom-Monitor provides. The real-time alerts and detailed performance analytics have been a game-changer for our website's uptime and speed. The global monitoring feature ensures that our site is optimized everywhere, and the intuitive dashboard makes it easy to track performance. Their customer support is exceptional — always responsive and efficient."
Tomer C.
Managing Director · Facilities Services
Verified Capterra review · March 2025
"One of Dotcom's best features is the push/pull API capabilities that provide us with network performance data. We use this to monitor for performance issues as well as page loading stats. Dotcom-Monitor allows us to monitor multiple services within one interface and platform. It's allowed us to operate more efficiently."
Gregory S.
Manager · Broadcast Media
Verified Capterra review · May 2020
"I have been thoroughly impressed with the level of detail and comprehensiveness of the reports generated by the software. Moreover, the support team at Dotcom-Monitor has exceeded my expectations. On almost a daily basis, I reach out with various questions and they have consistently demonstrated unwavering patience, providing detailed and insightful answers."
Shirin R.
Software Test Engineer · Computer Software
Verified Capterra review · February 2023
"I'm a network analyst and use Dotcom tools inside the ISP I work, it's a really good and reliable tool for monitoring things along the network, and testing network components, I usually use it to make diagnostics of servers latency, and dns resolve time."
Leonardo J.
IT & Network Infrastructure Analyst Internet
Verified Capterra review · October 2022
4.5
Capterra
82 reviews
4.6
Ease of Use
Capterra Score reviews
4.6
Customer Service
Capterra Score reviews
All reviews sourced from Capterra verified reviews. Ratings as of July 2026.
Want to kick the tires without committing? Free Forever plan available — up to 25 targets, 2 monitoring locations, 7 days of data retention. Get started free → or Compare plans
Frequently asked questions
Answers DevOps Teams Want Before They Sign Up
What is REST API monitoring?
Continuous, automated testing of REST endpoints from outside your infrastructure — verifying availability, response time, and payload correctness, then alerting your team the moment any of those break. Unlike one-off tests, monitoring runs 24/7 from multiple global locations on a fixed cadence.
Does it support OAuth, JWT, and other auth schemes?
Yes. API Key, Basic Auth, OAuth 2.0 (Client Credentials and Authorization Code), JWT with automatic refresh, custom headers, mTLS, and AWS Signature v4. Secrets are masked through the Secure Vault.
Can I chain multiple API calls into a single monitor?
Yes — that’s the core of multi-step monitoring. Pass tokens, IDs, and dynamic values between steps, validate each step independently, and abort the chain at the first failure with full per-step request/response logs.
Can I block a release if monitoring thresholds fail?
Yes. Trigger monitor runs via API from GitHub Actions, Jenkins, Azure DevOps, or any CI/CD tool. Gate the deploy on availability, latency, or assertion results to stop bad builds from reaching production.
How often can checks run?
As often as every minute per endpoint, with custom intervals available per monitor. For critical paths like login or checkout we recommend 1-minute checks; for less critical endpoints, 5- or 15-minute intervals.
Can I monitor APIs behind a firewall?
Yes. Deploy lightweight Private Agents inside your network — they initiate outbound connections to the platform, so no inbound firewall rules are required. You get the same monitoring depth for internal microservices as you do for public APIs.
How is this different from uptime-only monitoring?
Uptime tools mark you green when a 200 comes back. We validate the actual response — JSON schema, headers, payload contents, latency percentiles, downstream chain success — so partial failures (the 200-but-broken kind) get caught before users notice.
Can I export performance data to Grafana or BI?
Yes. Stream uptime, latency, and error metrics via XML feed into Grafana, Prometheus, Power BI, or your own BI stack. The API also exposes historical data for custom dashboards and reports.
What HTTP status codes should I alert on?
5xx errors always (server problems). 4xx errors selectively — alert on 401/403 spikes (auth breakage) but typically not 404 (client errors). 429 (rate limit) deserves an alert if your monitor itself is being throttled. Combine with payload assertions to catch the 200-but-broken case.
How do I monitor a REST API that returns paginated data?
Set the monitor to request page 1 and assert on the total-count field plus the presence of next-page metadata. For full validation across pages, build a multi-step chain that follows the next link and validates each page through the cursor.
What is JSONPath and why use it for REST monitoring?
JSONPath is a query language for JSON, analogous to XPath for XML. It lets you assert on specific fields deep inside a response payload without parsing the whole body. Example: $.order.status == “confirmed” or $.items.length > 0.
Can I monitor a REST API protected by AWS Signature v4?
Yes. Configure the AWS access key and secret in the Secure Vault; Dotcom-Monitor handles SigV4 request signing automatically per AWS specifications.
Monitoring more than REST? See the full API Monitoring platform →
Catch the Next API Outage Before Your Users Do
30-day free trial. No credit card. Full platform access. Live in under five minutes.
- 10,000+ organizations
- Monitoring leader since 1998
- 99.99% Uptime SLA