Pingdom Alternatives

Dotcom-Monitor: An all-in-one performance monitoring platform for your websites, web applications, APIs, web services, and infrastructure.

performance reporting
dotcom-monitor logo

The Dotcom-Monitor platform gives you the features you need to ensure uptime, performance, and availability on a global scale.

Real Browsers

Measure performance within real desktop browsers like Chrome, Firefox, and Internet Explorer.
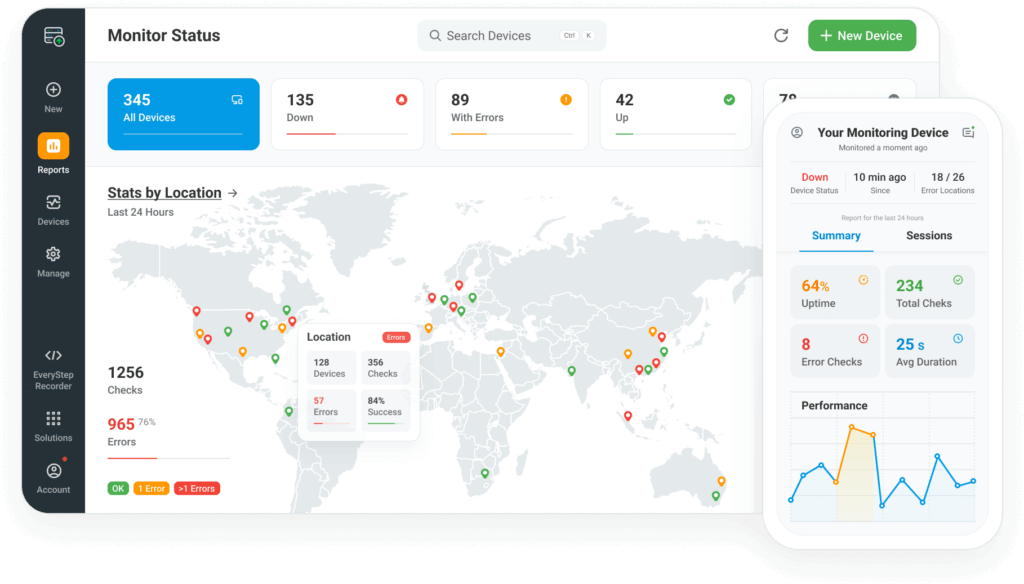
web network

Global Monitoring

Understand user performance from nearly 30 global locations.

Point and Click Scripting

Record custom scripts to monitor website and web application elements.

Full End-to-End
Monitoring Offerings

Choose the monitoring solution that best suits your needs.

Monitor performance of your most complex websites, web applications, APIs, and web services. Comprehensive reports and metrics allow you to quickly identify the root cause of downtime or performance issues.
Features
Pingdom
Other Providers
Dotcom-Monitor
Easy to use dashboard
Powerful, point and click scripting tool
Real browser-based monitoring
24/7 award-winning support
Popular third-party integrations
3-year data retention for all solutions
If you’re currently in the market for a website performance monitoring solution, you’ll want to put Dotcom-Monitor on your list of considerations. Pingdom recently made changes to how they structure their plans, so there are some similarities between the platforms and pricing, in terms of offerings and benefits, so we’ll dive into how Dotcom-Monitor sets itself apart from Pingdom, as well as other performance monitoring solutions and tools in the market today.

Pingdom vs. Dotcom-Monitor

Dotcom-Monitor was founded in 1998 and has been providing performance monitoring solutions for over 20 years. Dotcom-Monitor has solutions to monitor all your critical websites, web applications, web services, and infrastructure – from nearly 30 global locations. And with a suite of enterprise-level features, such as the EveryStep Web Recorder, real-time dashboards and reports, configurable alerts, and third-party integrations, the platform allows you to ensure your websites, applications, and related services are performing optimally, ensuring users get a flawless experience.

Pingdom was founded in 2007 and are headquartered in Sweden.  In 2014 they were acquired by the SolarWinds Cloud family.  Pingdom markets themselves as providing easy and affordable monitoring solutions for end user experience monitoring (EUEM). They offer both RUM and synthetic monitoring solutions, along with features like page speed, alerts, transaction monitoring, and uptime monitoring.

The Best Alternative to Pingdom

The Dotcom-Monitor platform consists of four main individual monitoring solutions. Each solution allows you set up checks as frequent as every minute and includes benefits like unlimited public dashboards, multi-user support, SSO integration, unlimited PDF reports, 24/7 support, and more.

Infrastructure

Monitor availability of email servers, audio or streaming services, network protocols, and more, for full visibility into the health of your IT infrastructure.

Learn More

Web Services

Monitor web services like HTTP/S, SOAP/REST web APIs, GET/POST requests, and SSL Certificates.


Learn More

Web Page Monitoring

Web Pages

Check web page performance in real desktop/mobile browsers to get performance insights to improve the user experience.


Learn More

Web Applications

Using the EveryStep Web Recorder, you can script/record critical user paths and monitor them for performance & functionality.

Learn More

scripting tool tutorial
Play Video about scripting tool tutorial
The EveryStep Web Recorder will show you how to create basic monitoring scripts for web applications, server uptime tasks, and load testing.
The recorder supports dynamic technologies that do not create DOM events, like AJAX, Flash, Java, Silverlight, and more. This is critically important advantage for the web application monitoring solution over the Pingdom solution. For example, this allows more users more freedom and flexibility to record and script elements like hovering over page elements, selecting automatic menu items, filling out forms, etc.
The Pingdom editor doesn’t create scripts by just pointing and clicking. Users must create each step by manually choosing from a list of commands. With the EveryStep Web Recorder, users can point and click as a normal user would. The tool automatically records your scripts as you navigate through your site or applications. The Pingdom editor uses a Chromium-based browser. However, the transaction check is performed by a bot, which cannot simulate a mouse cursor, so any events that requiring hovering over an element are not supported and will not work.
Furthermore, the EveryStep Web Recorder allows users to customize their scripts with using additional features from within the recorder like the following:

Context parameters

Useful for username and password inputs when monitoring a login process.

Crypt variables

Hide passwords and sensitive information, such as passwords or credit card details within the scripts. Configure a central Secure Vault and store sensitive data as encrypted variables in Crypt name-value collections.

Network throttling

Slow down or speed up Internet service speeds (2G/3G/4G) to emulate the experience of real users.

Delays

Include pauses between steps in monitoring script execution process to better emulate how users navigate.

Network Filters

Customize scripts to ignore certain elements so they don’t cause unnecessary alerts.

Image/Content validation

Validate that an image or section of a page renders properly in your script during the monitoring process.

The platform also supports the load and stress testing solution, LoadView. Manage all your performance monitoring and testing requirements from one single interface.

Want to try out the Dotcom-Monitor tools before you buy? Select from 10 free tools you can try before moving into the full platform. Everything from testing your website’s speed and web server performance to DNS blacklist and traceroute checks.

Powerful Features

Along with each of the solutions, the Dotcom-Monitor platform provides specialized features to help improve the performance of all your web pages, applications, services, and infrastructure. 

Reports and Real-Time Dashboards

Drill down into element-level details to find where errors happened. Share reports with colleagues and customers.

Learn More

Configurable Alerts

Get alerted immediately when errors occur. Depending on your needs, you can choose from multiple alert mechanisms or third-party integrations.

Learn More

chat

XML Data Feed and APIs

Utilize our XML data feed and API to integrate with custom desktop, web, or mobile applications.


Learn More

EveryStep Web Recorder

As mentioned above, this web-based, point and click script recorder allows you to record user paths and monitor interactive and dynamic web page and web applications.

Learn More

security

Private Agents

Private Agent allows you to monitor your websites, applications, or other network services from behind your firewall and not accessible from outside your network.

Learn More

Integrations

Integrate the tools and software you and your teams already utilize with the Dotcom-Monitor platform, such as Microsoft Azure, Slack, PagerDuty, and many more.

Learn More

network cloud

Monitoring Network

Choose from nearly 30 global monitoring locations. Monitor from the locations your customers are, ensuring availability and performance from around the world.

Learn More

Pingdom: Solutions, Tools, and Features

Pingdom’s solutions are focused on website and web application performance monitoring, providing just two solutions, Synthetic Monitoring and Real User Monitoring. There are no offerings for monitoring other web services, like GET/POST, TCP, ICMP and APIs, or IT infrastructure like streaming media, email servers, VoIP, and other network protocols. Their solutions consist of the following products:

Synthetic Monitoring

Uptime Monitoring

Check site availability from over 100+ locations.

Page Speed Monitoring

Identify elements that could be affecting page load performance. Tests your page every 30 seconds. Also includes a visualization/filmstrip and timeline metrics. Captures the elements present on the site every 500ms for the duration it took to load the complete page.

Transaction Monitoring

Like the web application monitoring solution from Dotcom-Monitor, this feature utilizes a built-in editor to script user flows and a Chromium-based browser. However, like mentioned previously, the editor makes users select each step manually from a list of options. Also, the editor has some limitation when it comes to scripting and supporting dynamic applications.

API

Pingdom’s RESTful-based API to create your own scripts and applications to automate interactions, like building web pages, gathering reports and data, and much more.

Status Pages

Allows companies to display and share uptime to customers to verify and ensure SLAs.

Alerts

Set up alerts (up to 15 members) to notify when issues occur, so that additional users aren’t impacted. Choose how alerts are sent based on the severity of the issue - email, SMS, or push notifications (Android and iOS devices supported). Pingdom also partners with third-party integrations, like Slack, Webhooks, PagerDuty, OpsGenie, VictorOps, as well as others.

Real User Monitoring

Pingdom uses a JavaScript code snippet to track and collect performance of actual users to your websites. Compared to HTTP monitoring, using RUM shows actual response times from the user’s perspective, based on location, device, browser, etc. However, one of the downsides of RUM is that you need a lot of real users to generate enough traffic to figure out where issues are located.

Live Map

See where users are experiencing issues or where downtime is happening via a live map.

User Experience Monitoring

Set pre-defined user experience performance thresholds to ensure users are receiving a good experience and get alerted when metrics fall under that threshold.

Page Load Performance Reports

View and share summary and detailed page load metrics with customers and teams.

User Behavior Metrics

View and compare historical user session data and metrics.

Pingdom vs. Dotcom-Monitor: Summary

Dotcom-Monitor is an all-in-one performance and monitoring platform, offering robust solutions based on your specific monitoring needs. Our synthetic monitoring solutions allow you to easily set up, simulate, and monitor page load times and user interactions, even the pages and applications that rely on third-party content, APIs, and other services. 

 If you’re looking for a basic website and web application monitoring solution, then Pingdom is a great choice. They offer both RUM and Synthetic Monitoring along with some nice-to-have features. Many Pingdom users have claimed the platform is hard to set up and it can get expensive if you go over your monthly monitoring SMS alerts. You should make sure you know which solution best suits your needs before investing in any option.

Compare Industry Monitoring Tools

Get started today with Dotcom-Monitor.

Try the full platform for free.

Comcast logo
Dell Logo
Dish Logo
volvo logo
Aflac logo
xerox logo
citrix logo