





Organizations Worldwide
Platform Uptime SLA
Global Monitoring Locations
Website Monitoring Leader
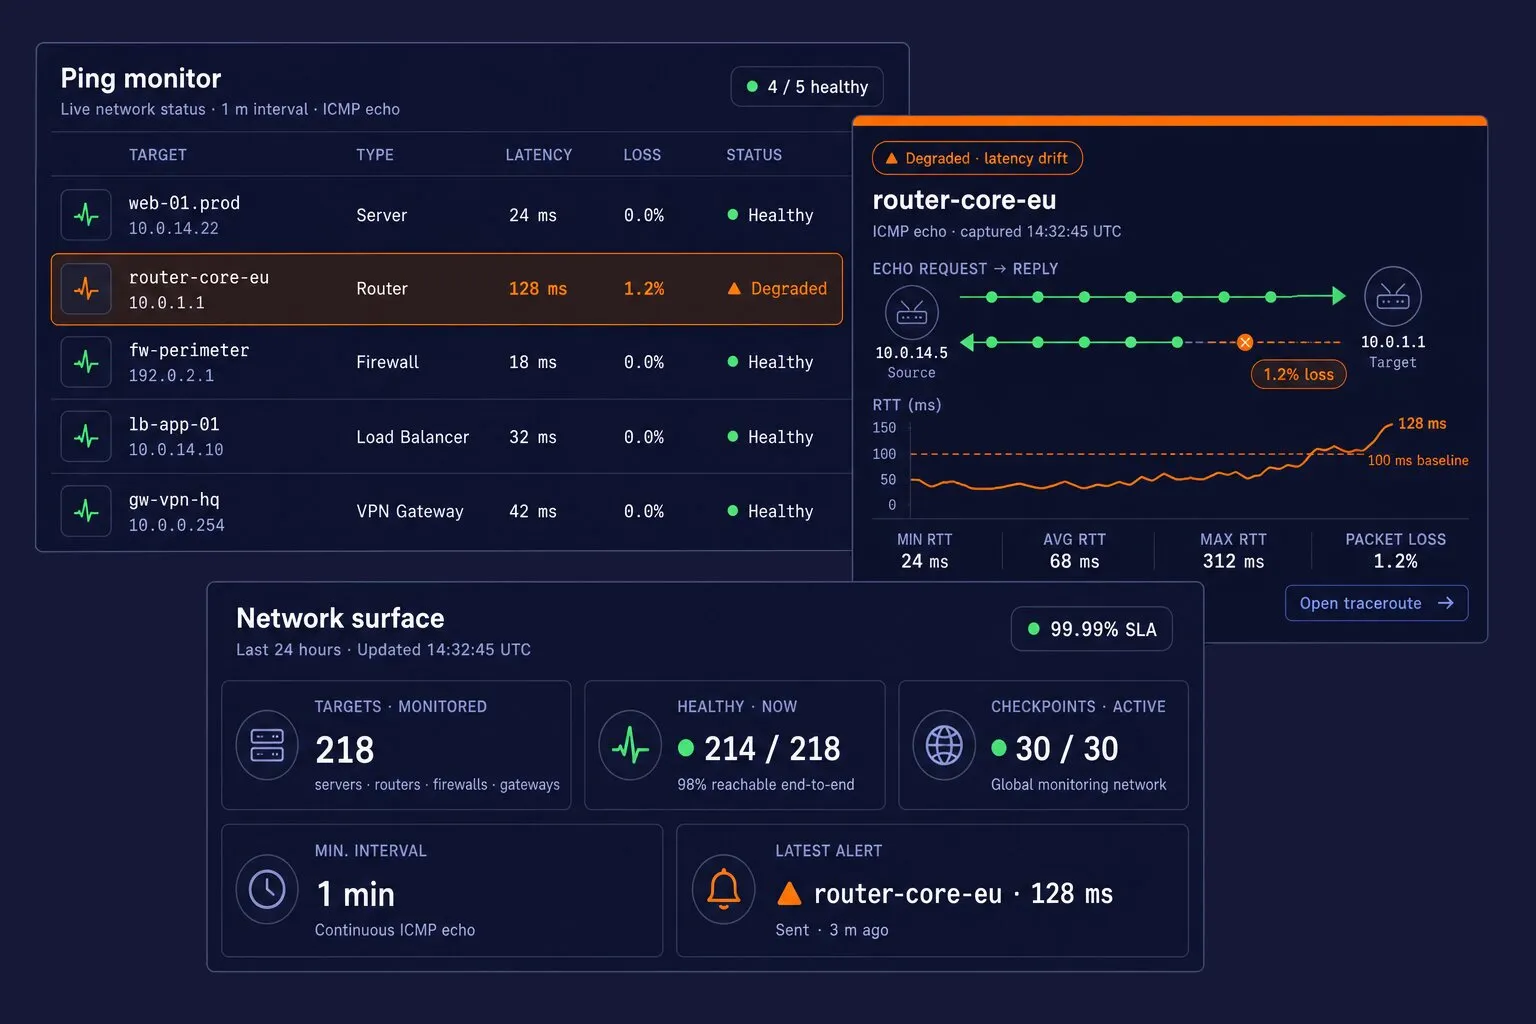
Because almost every internet-accessible device answers ICMP, ping is the fastest, lowest-overhead way to confirm that servers, routers, firewalls, load balancers, and other network devices are alive and reachable. Dotcom-Monitor sends these echo requests continuously and analyzes the replies to track uptime, response time, and packet loss.
The capabilities and coverage that turn raw ICMP replies into actionable connectivity monitoring.
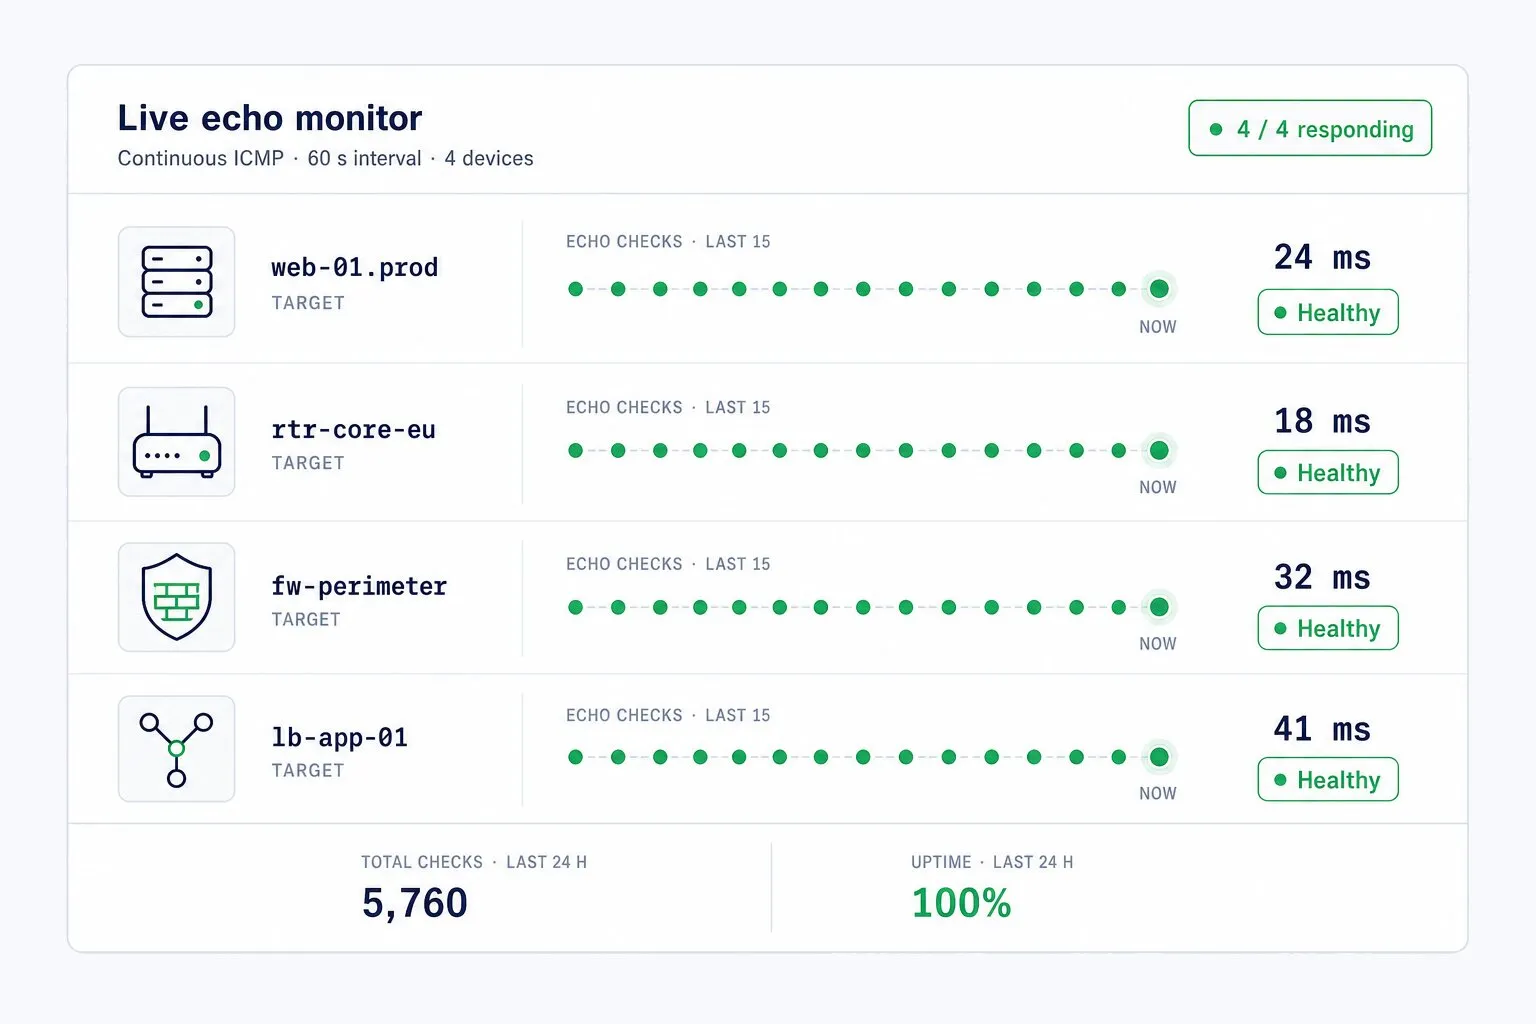
Continuously sends ICMP echo requests to determine the availability and responsiveness of devices on the network, providing a consistent, repeatable method of connectivity verification across servers, routers, firewalls, and other hardware.
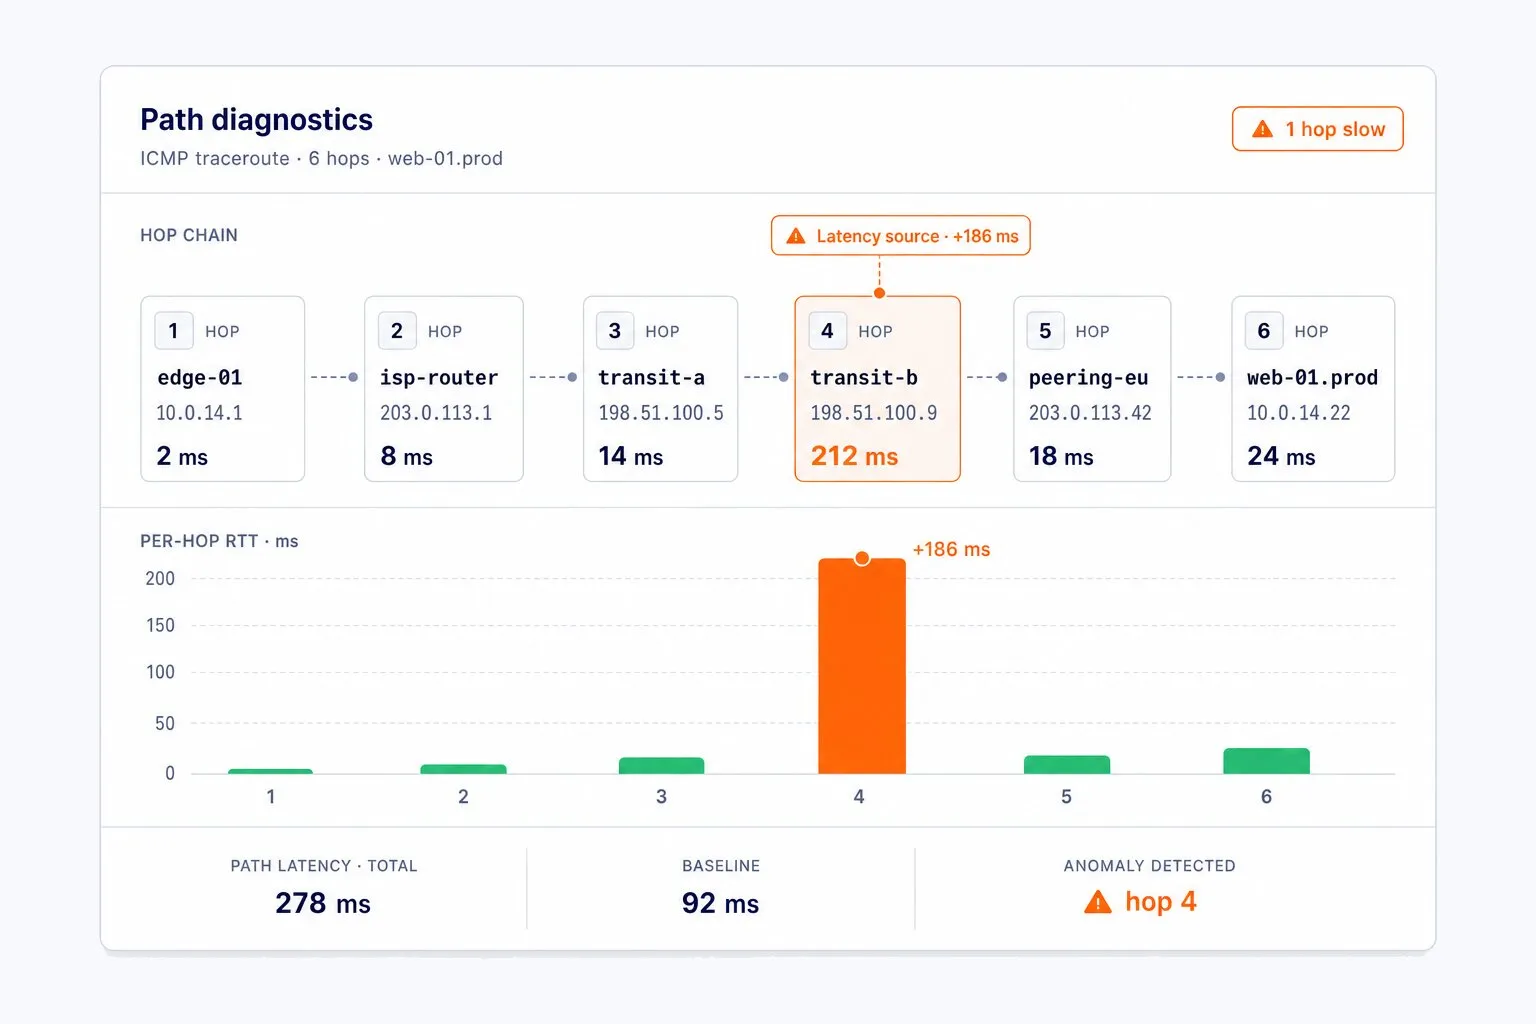
Uses the ICMP responses to drill into network data, pinpoint the sources of latency, and proactively surface potential issues before they escalate into outages that disrupt communication across the wider network infrastructure.
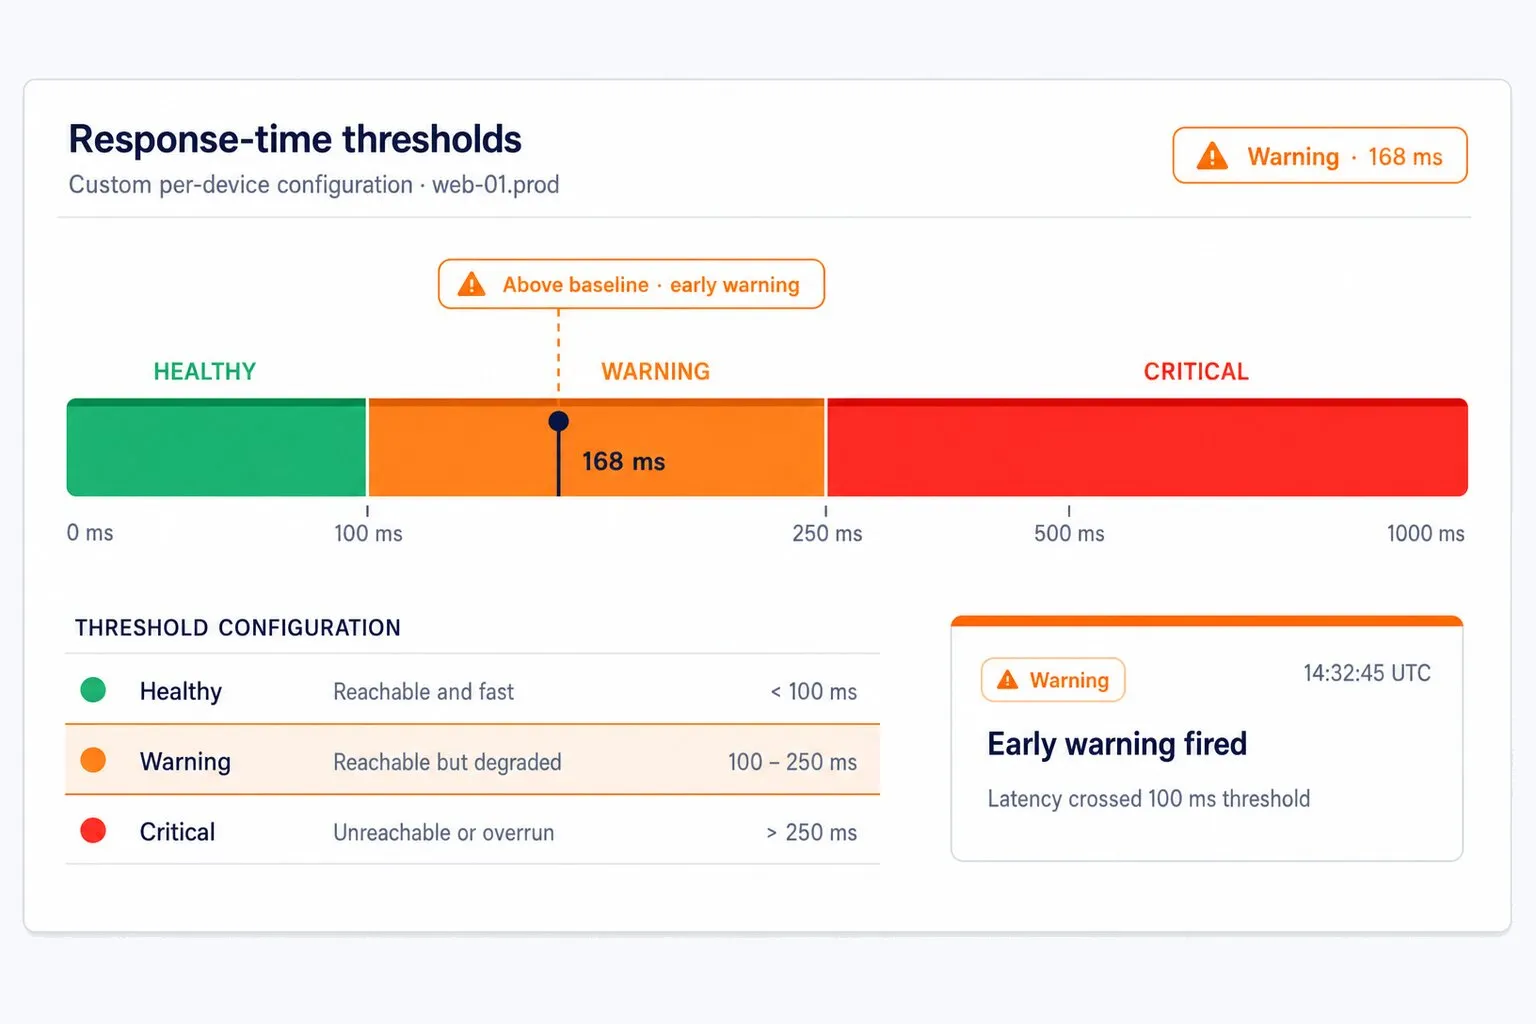
Custom response-time parameters can be set so the system alerts on degradation, not just hard failures, so a device that is reachable but responding too slowly still triggers an early warning.
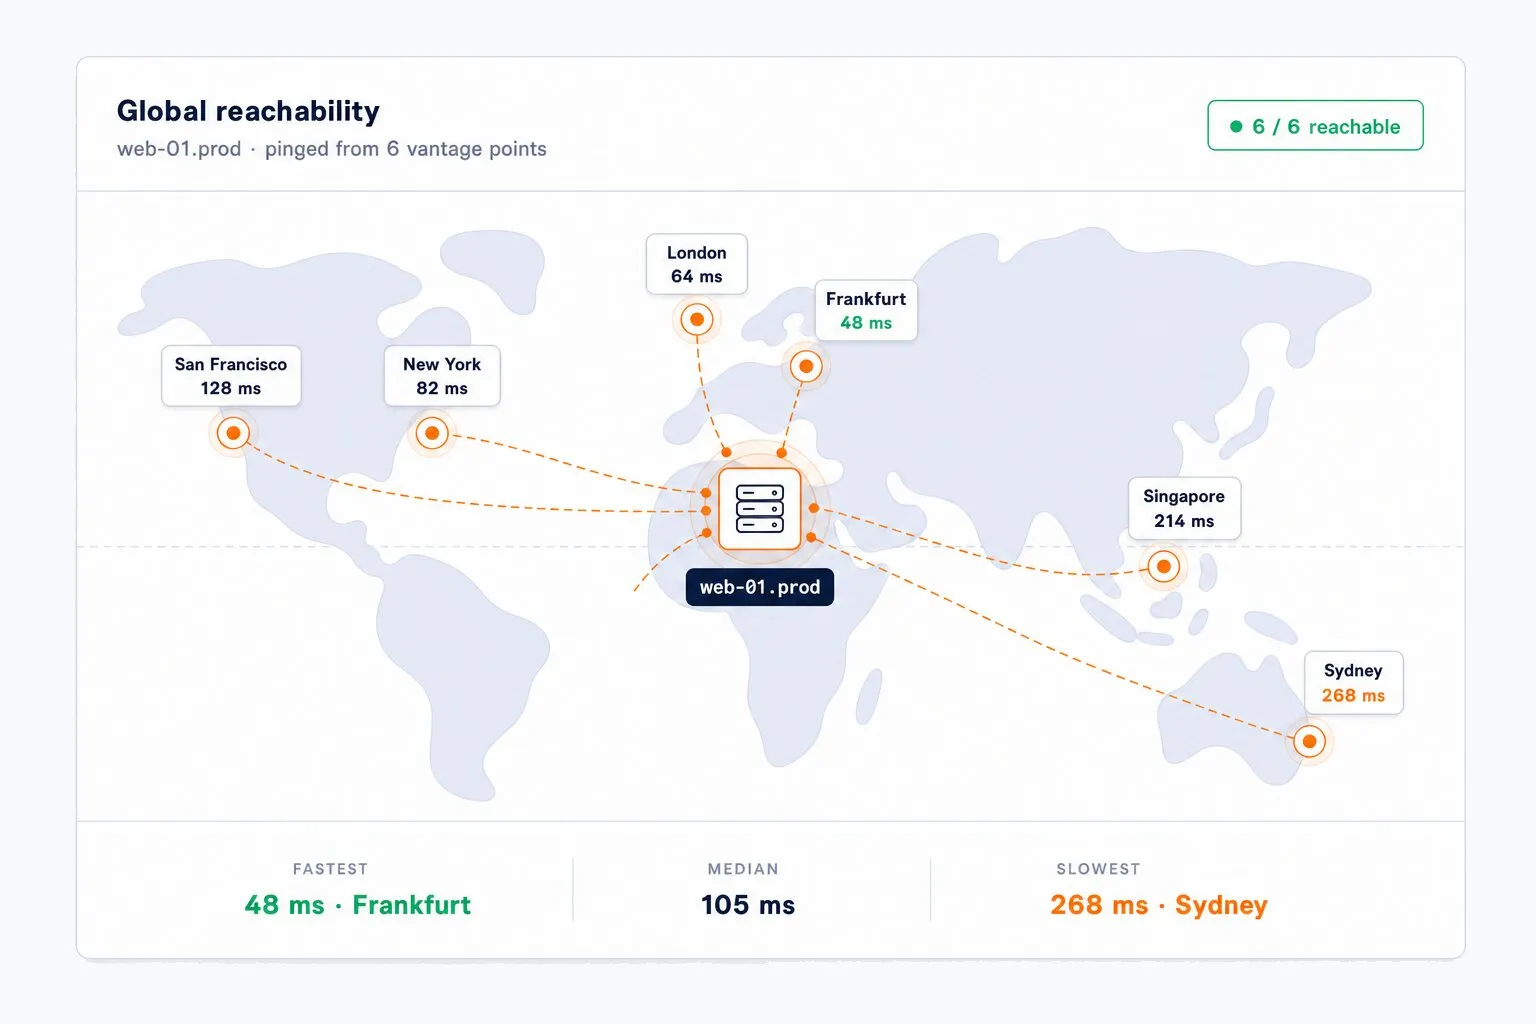
The worldwide monitoring network pings devices from many geographic vantage points, confirming global reachability and showing how a device’s health looks from different regions rather than from a single, fixed location.
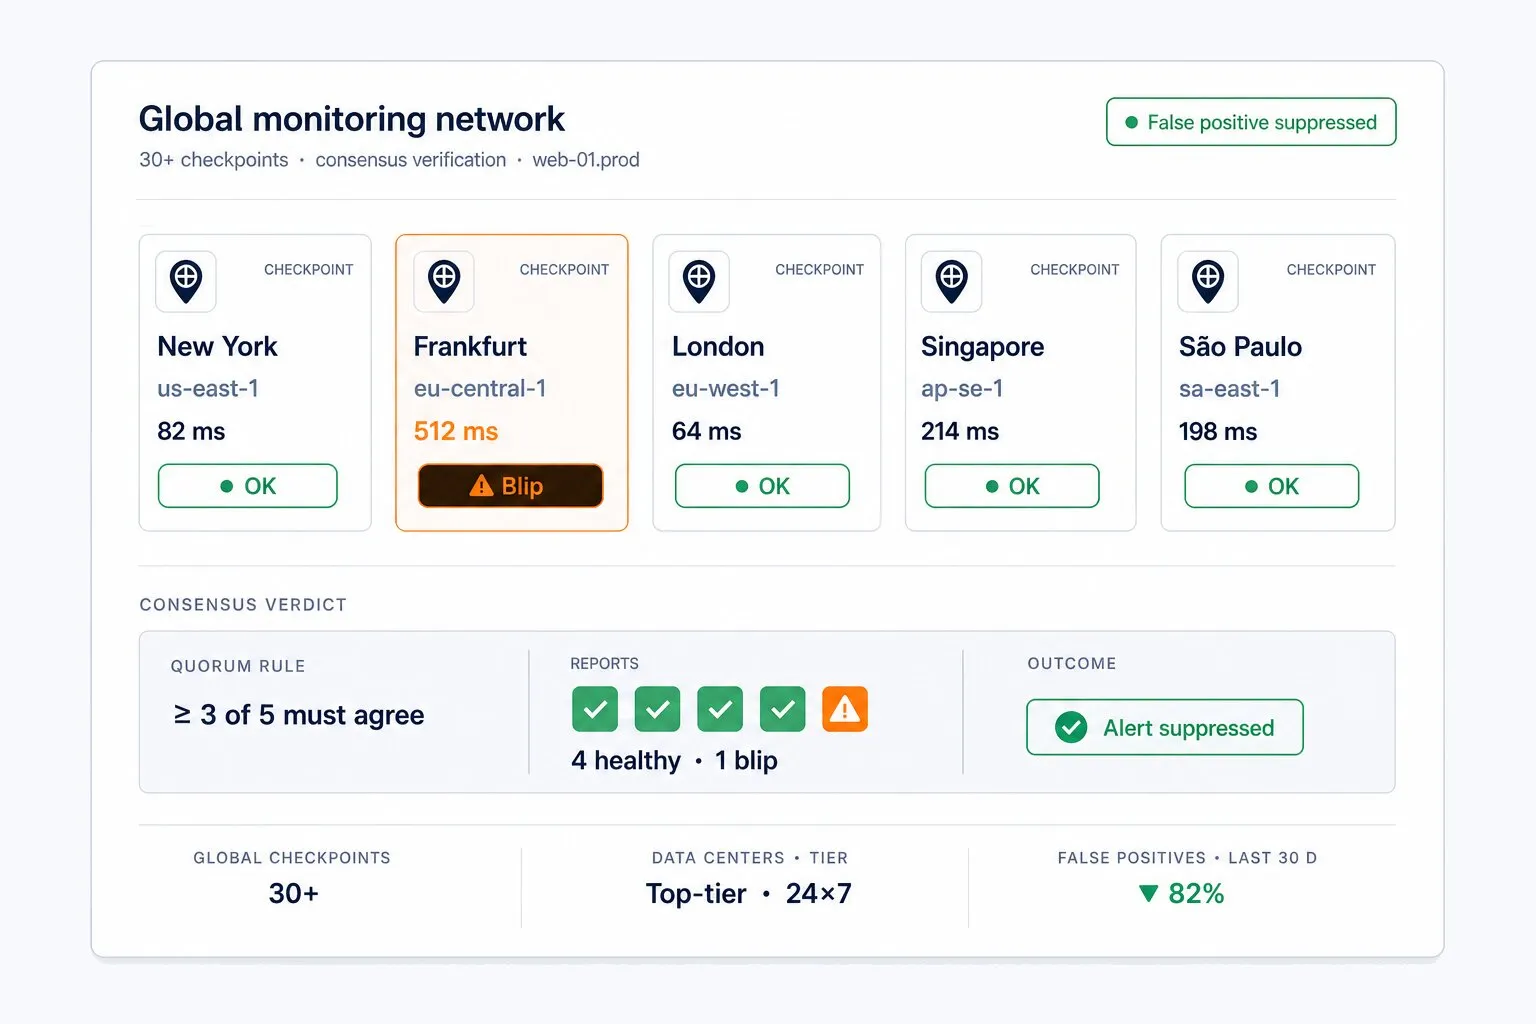
Checks run from 30+ global checkpoints hosted in top-tier data centers, operating around the clock. Confirming an alert from several vantage points rather than one transient blip helps minimize false positives.
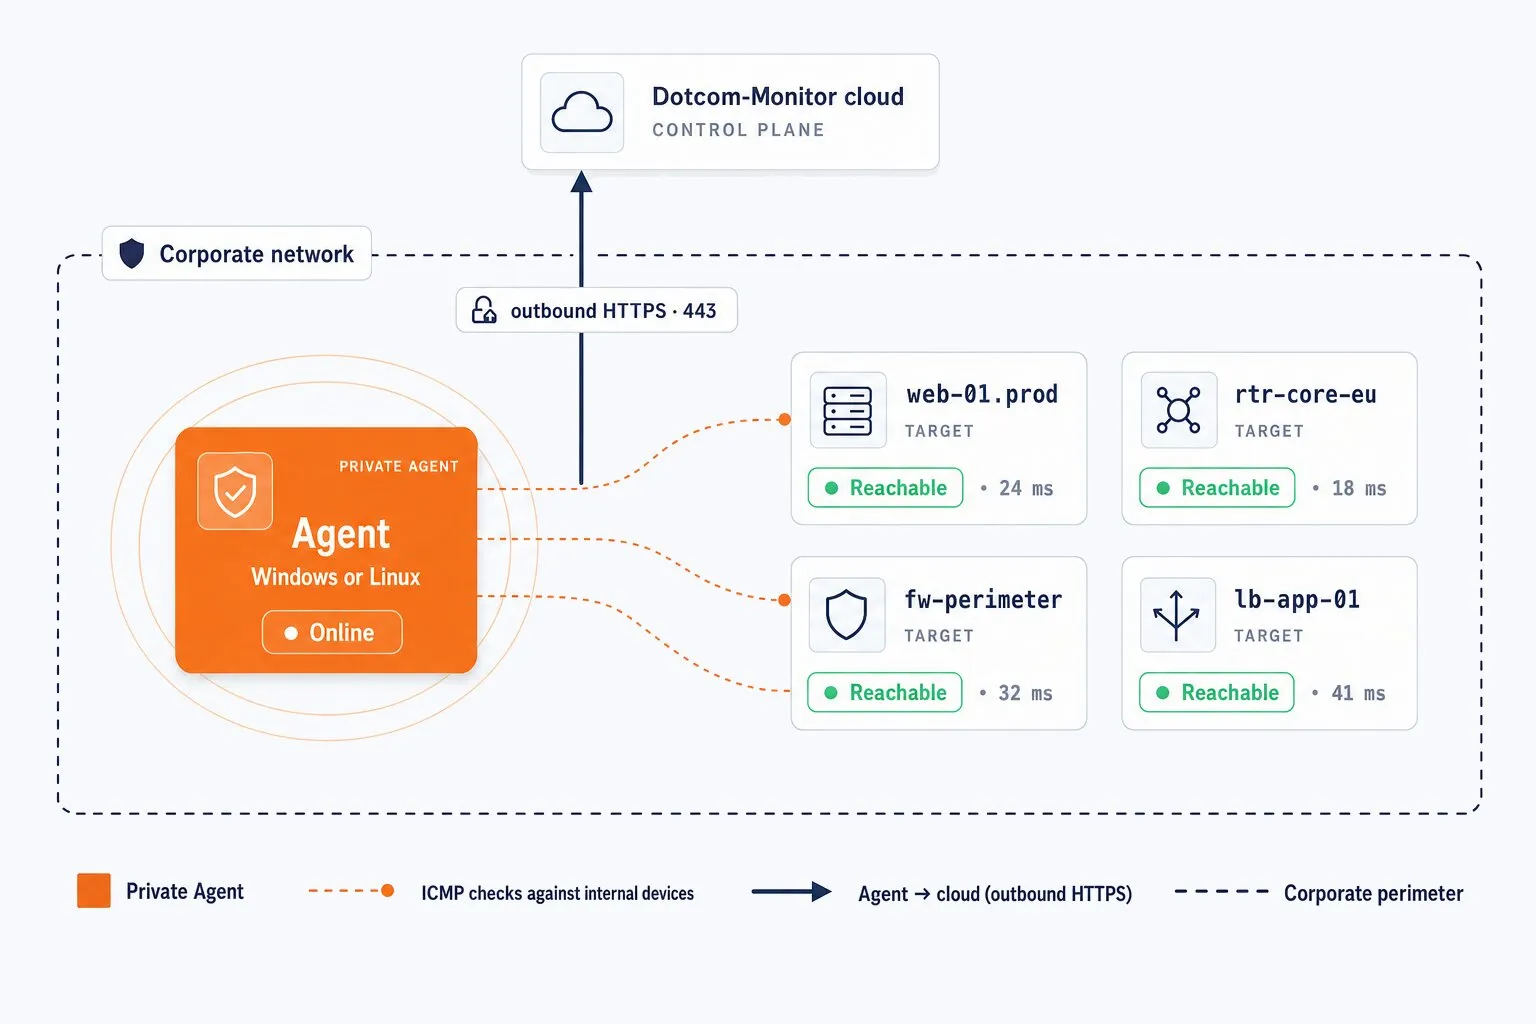
For devices not exposed to the public internet, Private Agents run inside your own network, monitoring internal servers and devices from behind the firewall without requiring changes to existing security settings.
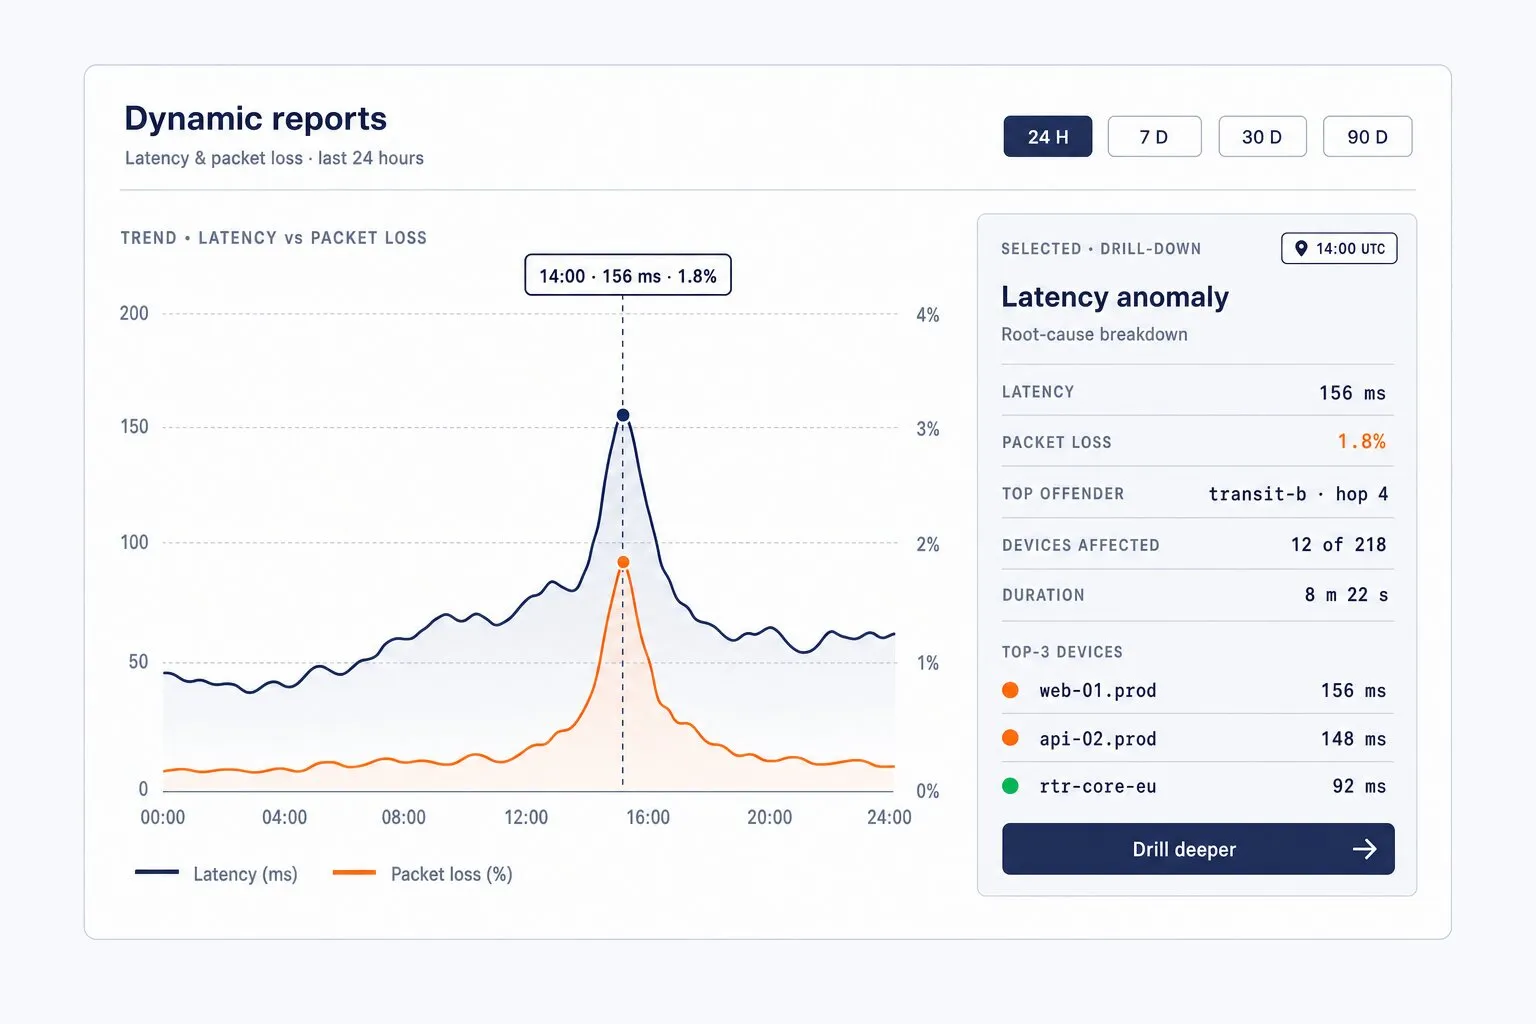
Interactive reports visualize network behavior and performance trends, including latency and packet loss over time, with the ability to drill down level-by-level for fast root-cause diagnosis across servers and network paths.
ICMP Ping Monitoring is aimed at network-layer targets — anything with an IP address that answers ICMP, plus adjacent service checks. Typical targets include:
What each check captures, how often it runs, and how it reacts to errors.
Ping checks feed Dotcom-Monitor’s alerting system, which notifies the right people the moment a device becomes unreachable or breaches a threshold. Alerts support flexible schedules and maintenance windows to avoid noise during planned work.
Email, SMS, and phone, plus integrations with tools teams already use.
Slack, Microsoft Teams, PagerDuty, ServiceNow, and others for routing incidents into existing workflows.
A push/pull API lets teams provision monitors, manage configuration, and extract real-time and historical network-performance data programmatically.
Monitoring status and alerts are available on the Dotcom-Monitor mobile app for iOS and Android.
Confirm that essential servers, firewalls, and network devices are always reachable and operational.
Catch network-related outages quickly by watching for missed echo replies across locations.
Identify sources of latency and slow responses before they affect users or applications.
Use traceroute to pinpoint ISP routing problems or congested hops affecting customer experience.
Detect misconfigurations and path problems across multi-cloud or distributed network performance.
Diagnose firewall, VPN-tunnel, and internal network-path issues, including from inside the network via private agents.
Combine ping with TCP port / Telnet checks to confirm specific internet services are not just reachable but actually listening.
Verify that devices and services are reachable from every region your audience lives in.
The ping protocol, or Internet Control Message Protocol (ICMP), works by sending an ICMP echo request to verify IP-level connectivity. Dotcom-Monitor sends these echo requests continuously to check the health of routers, firewalls, servers, and other internet-accessible devices — a reply confirms the device is reachable, while a missing or slow reply signals an outage or degradation.
By continuously sending ICMP echo requests, Dotcom-Monitor verifies the uptime status of servers and other network devices, providing a consistent, repeatable method of connectivity verification. Checks run around the clock from multiple global locations, so reachability is confirmed from several vantage points rather than from a single source.
Checks run on a configurable schedule. ICMP echo requests can be sent 24/7 at frequencies as fast as every 1–5 minutes from multiple global network locations.
Yes. Dotcom-Monitor Private Agents run inside your own network and monitor internal-only servers, devices, and applications from behind the firewall, without requiring changes to your security settings. Combined with the public network, you can compare how a device looks internally versus from the outside world — useful for VPN-tunnel and internal-app monitoring.
Each check records availability and uptime status (reachable vs. unreachable), response time and latency per check and per location, and packet loss. You also get min/max/average response times.
Ping checks feed Dotcom-Monitor’s alerting system, which notifies the right people the moment a device becomes unreachable or breaches a response-time threshold. Alerts go out via email, SMS, and phone, plus integrations with Slack, Microsoft Teams, PagerDuty, and ServiceNow.
The reports cater to a wide audience. While they are designed to be understood by anyone, IT professionals can drill into the data level-by-level to diagnose network problems. Interactive visualizations show latency and packet loss over time, and a color-coded Visual Traceroute maps up to 30 hops with per-node detail for root-cause analysis.
With real-time monitoring, in-depth analysis, and a user-centric approach, Dotcom-Monitor ensures your devices and servers are consistently accessible and operational. Ping and network checks sit alongside browser, page, and API monitoring in one platform, so infrastructure health can be correlated with the actual user experience — all managed and reported from a single dashboard.
30-Day Free Trial. No Credit Card Required.