New Relic Alternatives

Dotcom-Monitor: The all-in-one performance monitoring platform for websites, web applications, APIs, web services, and infrastructure.
performance reporting
dotcom-monitor logo

The Dotcom-Monitor platform gives you the features you need to ensure uptime, performance, and availability on a global scale.

Real Browsers

Measure performance within real desktop browsers like Chrome, Firefox, and Internet Explorer.

web network

Global Monitoring

Understand user performance from nearly 30 global locations.
.

Point and Click Scripting

Record custom scripts to monitor website and web application elements.

Full End-to-End
Monitoring Offerings

Choose the monitoring solution that best suits your needs.

Monitor performance of your most complex websites, web applications, APIs, and web services. Comprehensive reports and metrics allow you to quickly identify the root cause of downtime or performance issues.
Features
New Relic
Other Providers
Dotcom-Monitor
Easy to use dashboard
Powerful, point and click scripting tool
Real browser-based monitoring
24/7 support stanard for all solutions
Popular third-party integrations
3-year data retention for all solutions

If you’re looking for a solid, all-in-one monitoring and performance testing solution, Dotcom-Monitor is the choice for you. They offer straight-forward packages that can meet the needs of all organizations. Dotcom-Monitor can instantly notify users when there are issues. In-depth analysis and diagnostics enable the user to take a quick corrective action and see troubling trends, hiccups, and recurrent issues clearly, ensuring your services, web sites, and web applications perform properly 24/7. We’ll dive into what makes each platform different.

Try the full Dotcom-Monitor platform free.

Dotcom-Monitor

Dotcom-Monitor has been providing services since 1998. Dotcom-Monitor offers solutions for web application monitoring, as well as we page, web services, and IT infrastructure. Application performance monitoring, which can be considered a key asset of your business, can guarantee that your applications perform as expected and deliver on the business purpose for which they have been designed.

The platform makes it easy for you to guarantee the performance, uptime, and functionality for your websites, web applications, servers, and APIs. The platform consists of advanced synthetic monitoring solutions to aid in enhancing your applications using real web browsers, instead of stimulating on Selenium-based browsers as New Relic does.

New Relic

Founded in 2008, New Relic is a multi-tenant APM platform that provides users deep insight and analytics into every part of their environment, giving them the power to optimize application response times, transactions, and load times. It stimulates monitoring on a Selenium-based browser. New Relic offers enterprise-grade security. New Relic also offers advanced features such as AI, machine learning, full-stack monitoring and integration, multi-channel integrations, and advanced support for the latest technologies, but these features can become very expensive on a monthly basis for the average business. Also, one of the drawbacks of the platform is there can be a steep learning curve. You can’t just begin using this kind of product, and in some cases, individuals must take additional training to become certified to use the platform before its implemented.

New Relic vs. Dotcom-Monitor

Let’s start comparing these monitoring platforms by comparing the various solutions and features they provide.

Why Dotcom-Monitor is the Best Alternative to New Relic

Internet Infrastructure

Downtime equals lost customers. Availability is the most basic feature of ensuring performance. Even a few minutes of downtime can translate into thousands of dollars from a missed opportunity. Monitoring your infrastructure and continually checking uptime of email servers, FTP servers, DNS, VoIP, protocols, and more, provides you with the peace of mind in knowing that your site is online and accessible to your customers.

Learn More

Web Page Monitoring

Page Speed

Slow web pages frustrate customers. Web users are impatient. Constant delivery of your pages at top speed is the critical to customer satisfaction and repetitive visits. Web page monitoring ensures that your websites perform with the speed and reliability your customers want.

Learn More

Performance Counters

There are hardware servers where all the applications are running. What will happen if the server runs out of disk space, or an application consumes all the available memory? This can also lead to downtime of the server or your web page not working properly. Performance counter monitoring monitors the state of different hardware devices on the server, or network devices, such as switches or routers. Learn More

Web Application Availability

Let’s face it, broken apps mean lost opportunities. When interactive components, such as menus, configurators, shopping carts, widgets, and portals fail, your users lose patience and confidence in your offerings. Some will never return while others will post negative comments in every nook and cranny of the web. Take back control by ensuring early discovery of customer-centric web app failures.

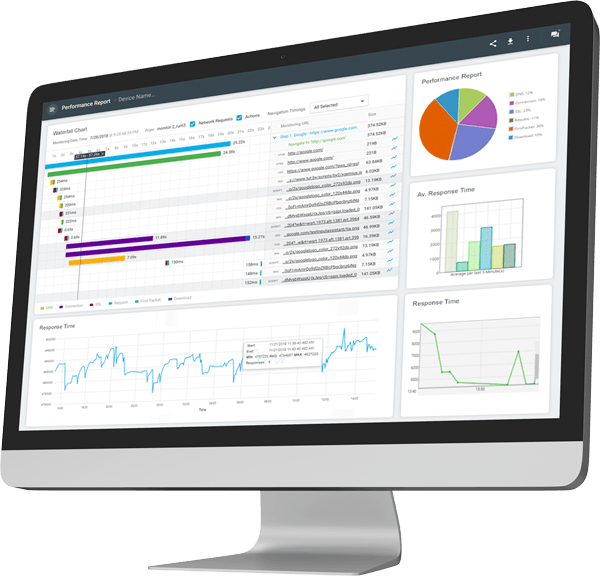
Additionally, the web application monitoring solution also include a video capture of the session, which takes error diagnostics to a completely new level by attaching a synchronized video to the waterfall chart.

Learn More

Web Services

The added, more modest way to monitor your website, is availability or uptime monitoring. In other words, if the goal is to watch if your users can enter a selected URL and don't receive any sort of page errors like “Error 404: Page Not Found,” but reach the address, this sort of monitoring is your most preferable choice. This type of monitoring will not tell you if some part of your web page is not loading or not working, but this the most cost-effective way of monitoring.

Learn More

Now let’s look at some of the unique features provided by the Dotcom-Monitor that New Relic doesn’t offer.
folders

FTP Monitoring

FTP monitoring allows you to check the supply and reaction time of your FTP server from multiple locations around the world. Monitoring FTP manually is a simple task, via ftp or general telnet client. As with many other sorts of monitoring, using automated monitoring means would scale back time required to check the service for availability. Testing FTP connection, in fact, checks not only the overall availability if the server, but credentials validity also. The lack of thorough testing may end in unexpected FTP service downtime.

Learn More

Email Server Performance Monitoring

Dotcom-Monitor’s email performance monitoring provides SMTP monitoring through SMTP handshake which tests the ability of an SMTP server to accept incoming connections from all around the globe. It also provides POP3/IMAP monitoring, Round-trip email monitoring to check the complete end-to-end server’s ability to receive and process emails.

The platform has some unique features, like ActiveSync, which logs into an exchange server to send and retrieve an email to a specific server to ensure ActiveSync is working and exchange is processing emails properly. Additionally, Dotcom-Monitor’s email server performance monitoring provides constant monitoring to the most common DNS Blacklists, and it sends an alert immediately if the server becomes listed.

Learn More

Maintenance Scheduling

Dotcom-Monitor also allows the user to schedule the maintenance of the server.

Learn More

Integrations

The platform supports popular integrations that you and your teams probably already use, such as Microsoft Azure, Slack, PagerDuty, Splunk, and many more.

Learn More

New Relic Features

Real-time Instrumentation and Analytics

With New Relic’s SaaS model, engineers can quickly get up and running with visualizations that deliver opinionated insights on their applications, whether it’s on-premises or in the public cloud across seven languages, without the necessity for fixing expensive hardware or complicated custom dashboards.

Detailed Transaction Data

New Relic agents use multiple data types to count and measure every single request to that you've got performance visibility right down to the tactic level, including metrics, event data, transaction traces, SQL queries, and stack-trace details. And New Relic Insight’s custom command language, NRQL, allows you to iteratively query and explore the info in real-time.

Integrations

DevOps success requires not only effective monitoring and measurement but also a various set of capabilities enabled by multiple tools. New Relic APM flawlessly integrates with popular incident-response tools (such as PagerDuty and Slack), major logging tools like Splunk and Sumo Logic also as successful configuration-management tools like Chef and Puppet.

Connects Application and Infrastructure Performance

As businesses shift to dynamic infrastructure, application strength is increasingly tied to the strength of the underlying foundation. New Relic Health Map provides a prioritized, high-density perspective of your applications with a translucent linkage to the infrastructure hosts upon which the applications rely. If the difficulty seems to get on the host, engineers can easily dive into New Relic Infrastructure to further explore the matter.

Built to Scale

New Relic’s Software-as-a-Service architecture means you never need to worry about provisioning or configuring new servers for your monitoring to handle spikes in traffic.

Real Browsers vs. Selenium Browsers

When we’re talking about features of both solutions, let’s go a little deeper and analyze the technologies have been integrated into the browser automation testing tools and attempt to understand what competitive advantage this obtains when it comes to web application monitoring.

real browser testing
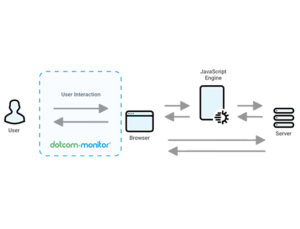
When we talk about browsers, Dotcom-Monitor operates on the real browser and New Relic on the Selenium-based browser. Before going into detailed analysis of Selenium browser automated testing and real browser testing, you need to understand the fundamentals of Selenium-based browsers and why it is different from real browsers.

Selenium browser can be categorized as a headless browser. Headless browser automation testing exists without loading the client-side interface, with scripts being operated from the back-end, which means it lacks the GUI interface, and the main difference between a real browser and a headless browser.

The primary application of a Selenium browser is to automate testing of web applications. It has been grown to serve as a full-blown automation framework. Below are the details that you would require to understand the advantages and disadvantages of Selenium-based browsers and to understand why a real browser is more effective to serve this purpose.

Why Web Application Monitoring is Essential

Application monitoring is a combination of tools and processes that checks how strong a digital business is operating.

web application monitoring dashboardsIn this era when technological evolution and customer expectations are progressing at an incredible pace, speed is everything in today’s connected world. Having a sluggish application wouldn’t satisfy the needs of a customer. They’ll quickly lose interest and find somewhere else to go, most likely one of your direct competitors. It becomes far more crucial when it comes to applications that can be accessed by users from anywhere, and any time, in the world and are critical to driving revenue.

This would be an immediate impact on the business profit, customer retention, and the brand value of a certain business. No matter what platform a digital business is using, the user experience, great performance, and the success of a business are intertwined.

A full-fledged synthetic monitoring platform like Dotcom-Monitor would is not able to just detect problems, but it’s also be able to precisely pinpoint the spot when and where the end users encountered issues. It ensures your applications are within pre-defined response time, as well as the consistency and functionality from the perspective of the end user.

Advantages of Real Browser-based Performance Monitoring
When it comes to being concerned with how your applications and sites function with users, below are the reasons why real browsers are better for examining the user’s performance compared to headless browsers.

Simulating The User’s Journey

When we integrate Automated Load Testing with the Real browser then all the Images, CSS, and every aspect of the application is getting monitored visually and functionally as the real user.

Better Insights Into Error Detection

Testing in the Real browser is being done in front of the user. So it can give insights to where the actual error is being lied into. And as functions are being performed in front of actual use it is a quite easy and rapid way for debugging if anything goes wrong.

UI Issues Can Be Taken Into Consideration

As the real browser integrates UI and the testing is getting happened in front of real users, UI issues like hiding show of button or CSS issues which can get happen to the real user and can be a hurdle to real users transaction will be taken into consideration. Due to these factors, we know that a real browser is a little slower than the Selenium-based browser because real browser is loading every aspect of your application. Hence, it is more effective in being able to monitor and detect issues. After all, it will always replicate real users' journey and will be far more useful for the business perspective.

Now before going into further analysis, let’s understand the technologies behind the platforms.

New Relic Real User Monitoring vs. Dotcom-Monitor Synthetic Monitoring

Real User Monitoring (RUM) from New Relic
Advantages of RUM
  • Deep Visibility of SPAs. Applications that are running on a single page, for every state we need more insights into resource load, response times, and request times. We need all the details for every page load. By analyzing the detailed performance information, we can reduce all the obstruction that can be in the path of Aimed performance.

  • Identify JavaScript errors. For example, AngularJS is a pure JavaScript-based framework, so during each page load, every service call is being taken care of by JavaScript/AJAX calls. So for better user experiences, we need to make sure that JavaScript is error-free, that all extensions are working as expected, and not causing any errors that can lead to application crashes or any impediments to the user’s experience.
Disadvantages of RUM
  • Requires traffic. To analyze errors, we need real users’ traffic on the environment. RUM only works only when real people are visiting the site. Even when you have capabilities of monitoring, analyzing, and capture every user’s data, you still need people generating data to analyze effectively. This is the reason RUM’s best point can be the greatest weaknesses.
  • Lacks in benchmarking capabilities. Getting instant website performance is tough for RUM. RUM solutions only give effective analysis when user’s traffic is higher, and this makes it difficult to find the issue(s) within a system that have been occurring over a long period of time.
  • Volume of data makes it hard to find an accurate result. Sometimes it becomes tough to find the accurate result of the actual user is getting hampered in the journey because of the sheer amount of data and we cannot have the desired result out of it.

As described above, there are disadvantages, or blind spots, using RUM. These gaps can be resolved by implementing synthetic monitoring.
Synthetic Monitoring from Dotcom-Monitor
Synthetic monitoring, also known as active monitoring, monitors your application by stimulating the user’s path. This examined data can be used to find areas which require improvement. Below are the exciting features which can make you shift from RUM to synthetic monitoring.

Availability from any place at any time.

Synthetic monitoring makes it easy for business owners to observe the availability and execution of your applications as encountered by consumers throughout the world at any time. Synthetic monitoring simulates the user’s actions. It is effective monitoring that implements the ability to monitor performance periodically and at the places of your choice, at any time. The performance data can then be used to find areas that require development.

Monitor complex transaction processes.

Synthetic monitoring offers the ability to examine completely brand-new applications or features prior to launch. to the concrete user and would able to achieve all the exposures of the application which can redeem the ultimate disturbances when the furthermore bugs would be faced by real users that can cost the business losing its customers.

UI Issues Can Be Taken Into Consideration

When we’re striving for better performance, it’s not enough to only check the uptime of your APIs and server availability. This monitoring can enable you to trace, examine, and simulate every click and swipe can help you optimize your strategy and identify steps within the transaction process that aren't performing as intended without negatively impacting actual users. With synthetic monitoring, businesses can monitor web and network assets and obtain alerts when things do not work as demanded.

Plans and Pricing

Below are the details of the plans offered by the New Relic and Dotcom-Monitor.

New Relic is one of the larger APM solutions on the market today. They offer many different products and solutions, with varying features and capabilities. These factors can make it difficult to predict how much you’re going to spend. The features you may want to have may end up being in a higher pricing tier. This is not ideal for smaller companies with limited budgets.

New Relic Browser

$223/month or $149/month if paying on annual basis. Features of this plan include:

  • Unlimited New Relic users
  • Single Page Application (SPA) visibility
  • Page load timings, waterfalls, and traces
  • JavaScript errors, AJAX timings, browser reports
  • Premium Support (dependent on level of spend)
  • Performance metrics and dashboards from New Relic Insights
  • High Security Mode

New Relic Mobile

$1,499/month or $999/month if paying on annual basis. Features of this plan include the same features as New Relic Browser, plus the following:

  • Crash Traces, Trails, and Network Errors
  • App Version, Device, and HTTP Reports
  • Premium Support (dependent on level of spend)

New Relic Synthetics

$103/month or $69/month if paying on annual basis. Features of this plan include the following:

  • Data retention 13 months
  • Unlimited New Relic users
  • Simulated transactions and API testing
  • World-wide ping
  • Premium support (dependent on level of spend)
  • Performance metrics and dashboards from New Relic Insights

New Relic APM

Starts at $25/month (pricing t2.micro instance running 750 hours per month when billed annually). Features include the following:

  • 90 Days of metric data retention
  • 8 days of insights events retention
  • Distributed tracing, service maps, deployment tracking, SLA tracking and more
  • Unlimited containers + custom attributes

New Relic Infrastructure

Consists of two different plans, Pro and Essentials. Pricing for the Pro tier starts at a little over $14/month. Pricing for the Essentials plan begins at just over $7 per month. Features of both plans include the following:

Essentials

  • 3 Months of Data Retention
  • Host health metrics (CPU, Load, Memory)
  • Dynamic alerting
  • Live-state change and event tracking
  • Docker container monitoring

Pro

  • 13 Months of Data Retention
  • Up to 2,275 Integration Events are included per licensed Compute Unit. Additional Integration Events are available on a per-event basis.
  • Cloud services monitoring on AWS, GCP, and Azure,
  • Services monitoring with on-host integrations
  • Kubernetes monitoring
  • SDK for custom metrics, Inventory, and events
dotcom-monitor logo
Dotcom-Monitor offers four different monitoring solutions, based upon your monitoring needs. Find the solution for your specific environment and monitor only what you need.

Web Services Monitoring

$1.99/month per target (minimum of 10 targets required). Monitoring features include the following:

  • 1-5 minute check frequency
  • HTTP/S
  • Web Server
  • Web API – SOAP/REST
  • ICMP/Ping
  • SSL certification checks
Web Page Monitoring

Web Page Monitoring

$5.99/month per page (minimum of 5 pages required). Monitoring features include the following:

  • 1-180 minute check frequency
  • Real browsers (Chrome, Internet Explorer, Firefox)
  • Desktop/mobile/tablets
  • Detailed waterfalls
  • Video capture
  • DOM element timings
  • Element trend reporting
  • Content validation
  • DNS/SSL/Connect breakdown

Web Application Monitoring

$7.79/month per step (minimum of 5 steps). Monitoring features include the following:

  • 1-180 minute check frequency
  • EveryStep Web Recorder (web-based scripting tool)
  • Chrome/Internet Explorer playback
  • Desktop/mobile/tablets
  • Playback video capture
  • Detailed waterfall charts
  • Image/content validation
  • Support for dynamic web applications, such as Flash, Silverlight, AJAX, and more

Infrastructure Monitoring

$7.99/month per target (minimum of 5 targets). Monitoring features include the following:

  • 1-180min check frequency
  • Streaming media servers
  • Email servers
  • DNS
  • Traceroute
  • FTP
  • VoIP/SIP
  • DNS Blacklist
  • Telnet/Port check

All Monitoring

Each solution comes standard with the following benefits/features:

  • Access up to nearly 30 monitoring locations
  • 24/7 Support
  • Data retention for 3 years
  • Unlimited public dashboards
  • Multi-user support
  • Configuration API
  • Real-time XML data feed
  • SSO integration
  • Unlimited PDF reports
  • Third-Party integrations

New Relic vs. Dotcom-Monitor: Conclusion

Users have reported that the pricing offered by New Relic can be too high, especially for smaller organizations. And unlike Dotcom-Monitor, many features within the New Relic solutions are locked behind expensive paywalls. Additionally, New Relic Synthetics does not offer as many monitoring locations as Dotcom-Monitor. Furthermore, they do not have a tool like the EveryStep Web Recorder for creating and replaying scripts in a real browser. It’s one of the few application monitoring tools that allows you to interact with a variety of application technologies, such as Flash, AJAX, Silverlight, and HTML5.

New Relic users have commented that the platform is expensive and difficult to navigate. Some companies can only afford to use their free Lite account once their Pro trial ends. There can be a steep learning curve to using the platform and individuals may need to take additional courses in order to learn how to properly use their solutions and tools.

Compare Industry Monitoring Tools

Try the full Dotcom-Monitor platform free.

Comcast logo
Dell Logo
Dish Logo
volvo logo
Aflac logo
xerox logo
citrix logo