Dynatrace Alternatives

Ensure uptime, performance, and availability on a global scale with the solutions from Dotcom-Monitor.
Real Browsers
Measure performance within real desktop browsers like Chrome, Firefox, and Internet Explorer.
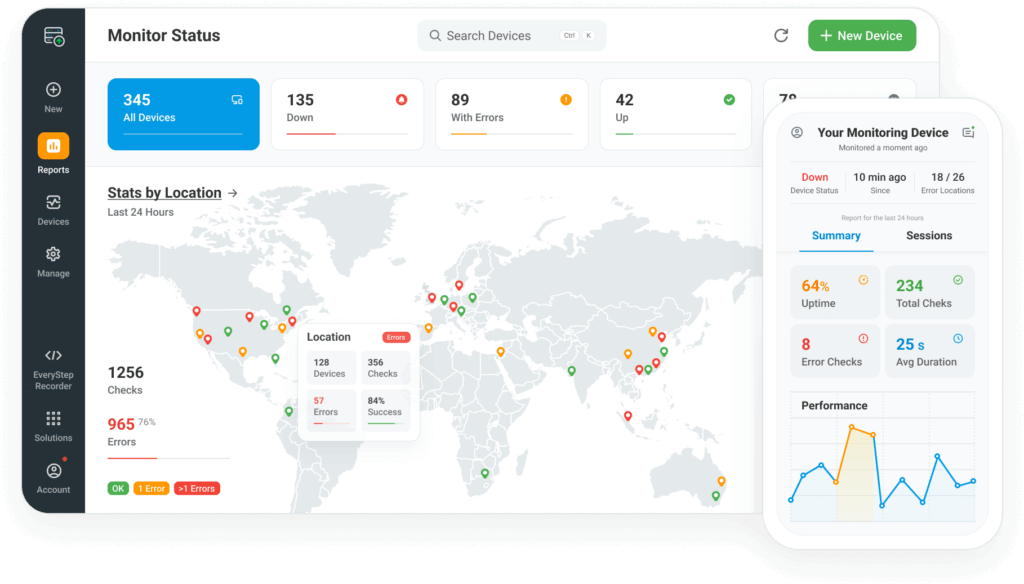
Global Monitoring
Understand user performance from nearly 30 global locations.
Point and Click Scripting
Record custom scripts to monitor website and web application elements.
End-to-End Performance Testing Solutions
A wide array of solutions for your specific needs.
Monitor your most complex websites, web applications, APIs, and web services.
Comprehensive reports and metrics allow you to quickly identify the root cause of downtime or performance issues.
Features | Dynatrace | Other Providers | Dotcom-Monitor |
---|---|---|---|
Easy to use dashboard | |||
Powerful, point and click scripting tool | |||
Real browser-based monitoring | |||
24/7 support standard for all solutions | |||
Popular third-party integrations | |||
Straightforward plans and pricing |
What is Application Performance Monitoring?
A Brief Introduction to Dotcom Monitor and Dynatrace
Web Services
Includes monitoring for web services such as REST, TCP/IP, SOAP, and SSL for downtime and performance and includes key monitoring features such as alerts, reports, and dashboards. Learn More
Web Pages
Monitoring single web pages for errors, performance issues, and load times using real browsers and devices that are located around the world. Learn More
Web Applications
Enables monitoring of web applications that consist of well-defined transactions. These transactions may involve multiple steps that can span across multiple web pages. Learn More
Web Infrastructure
Helps in monitoring a variety of web infrastructures such as streaming services, FTP Servers, DNS Servers, Email Servers, and more. Learn More
Web Resource Monitoring
Enables you to monitor resource usage across different components such as Network, Server storage, and CPU usage for both Windows and Linux platforms. Learn More
Load Testing
A separate solution from their monitoring products, but available from within the same interface. Set up stress tests and carry them out on real browsers to test the robustness of your websites, web applications, and web services. Learn More

Dynatrace Platforms and Solutions
Application Performance
Dynatrace offers performance monitoring for various technologies such as Linux, Android, Web, and iOS. Include code-level tracing, microservices, hybrid cloud environments, and SQL/NoSQL databases.
Infrastructure Monitoring
Enables monitoring for various infrastructures such as cloud, VMs, containers, and hybrid environments.
Digital Experience
Dynatrace offers monitoring insights from real users and synthetic workloads combined with a video-based session play. Includes support for mobile, web, and IoT, RUM, Synthetic, and session replay.
Digital Business Analytics
Provides real-time answers to business questions by inferring conclusions obtained from APM metrics and digital experience modules.

Dynatrace vs. Dotcom-Monitor
Monitoring Web Services
Web Services are the backbones of a traditional website or a modern web application. These services include (but are not limited to) REST APIs, SOAP Services, SMTP, TCP, ICMP, XML, and JSON. Also, these services are critical to any application that is dependent on it. Hence, it’s essential to make sure that these services are performing up to their standards, and there are no critical flaws in their implementation.
Dotcom-Monitor offers comprehensive surveilling of SOAP, REST, JSON, and XML web services by validating the correctness of their response content, performance, and uptime. The performance of a service is measured by setting alert thresholds for both minimum and maximum response times. More importantly, the correctness of the response is also validated by verifying that API calls return proper text, JSON, or XML. These metrics are calculated for every API request, and the alerts are instantly sent to your email or phone number.
Dotcom-Monitor also has a unique approach to monitor OAuth 2.0 APIs. It does so by creating a multi-task monitoring device using an HTTP/S task. This HTTP/S task monitors the performance and availability of OAuth based APIs. Dotcom-Monitor provides an easy-to-use form-based interface to set-up and configure monitoring for different Web Services.
Dynatrace also offers to monitor API services by allowing you to define APIs and their expected responses. However, you should be familiar with JavaScript to use their HTTP monitor feature as it requires you to write some of your verification logic in JavaScript language. Dynatrace offers to monitor OAuth 2.0 APIs as well. However, like the method above, the process is quite complicated and requires a bit of tinkering before you can get it right.

Monitoring Web Pages
Now let’s see what Dotcom Monitor and Dynatrace have to offer in monitoring traditional web pages.
The web page monitoring solution from Dotcom-Monitor measures various aspects of a web page to provide a detailed breakdown of your website’s performance. Their monitoring software runs on real browsers (both desktops and mobiles) on data centers that are located around the world. You can also simulate different devices and network connections by emulating 2G, 3G, or 4G connections during synthetic monitoring.
The final results show an element-by-element breakdown of your webpage and provide information such as load times for each element and size. You can easily determine which of them load quickly and which elements take considerable time to load. Along with the metrics, the results can also show any errors that occur during monitoring and provide diagnostic information about those errors.
Dynatrace also provides a similar solution to web page monitoring, called Browser Monitor. You can monitor a single URL and have it run across devices located in different geo-locations. The results of which start showing up instantly, and it includes information such as events, errors, and properties. However, the error and diagnostics dashboard can do with a little more technical information.
Dotcom-Monitor EveryStep Web Recorder vs. Dynatrace PurePath
Unlike websites which only have visual information to show to a user, web applications deal with data and allow a user to manipulate this data. Therefore, monitoring a web application can become a challenging task. Let’s see how Dotcom-Monitor and Dynatrace tackle this issue.
In response, Dotcom Monitor has an intuitive solution to monitoring web applications. Their EveryStep Web Recorder can record common UI paths for specific actions and run them on real browsers and devices located across the world to gather real-world monitoring data. The tool also supports keyword and image validation to verify the content being loaded in your application is correct.
For example, you can record the steps required to generate a sales report in the EveryStep Web Recorder tool. Subsequently, for each step, you can add one or more keywords that must appear on that page—for example, a heading text. You can also add image-based checks that verify if a specific image is loaded or not. Due to its simple yet effective approach, the EveryStep Web Recorder tool works surprisingly well for dynamic applications such as Angular, Vue, and React as well.
Dynatrace also offers a similar solution to Dotcom Monitor’s EveryStep Web Recorder, called PurePath. PurePath records steps related to a transaction in a script. It then runs this script on a multitude of devices and builds a code level trace that spans the entire transaction. Also, every user interaction (either real or synthetic) is individually tracked and reported. However, PurePath does not work well with dynamic web applications such as Vue or React because it cannot detect changes in the DOM at runtime. So, if you want to monitor web applications built with Vue or React, Dotcom Monitor offers the better solution.
Infrastructure Monitoring
To consistently maintain good performance in your web applications/websites, it is crucial to take care of your supporting infrastructure as well. Your IT infrastructure may include Servers, Network Devices, Email Setup, Docker, Kubernetes, etc. For traditional server infrastructure, go with Dotcom-Monitor. For anything cloud or containerized, Dynatrace offers more robust options.
Dotcom Monitor offers dedicated monitoring solutions for most of your infrastructural needs. They have monitoring solutions available for different parts of your infrastructure, such as Network, FTP servers, DNS performance, SMTP/IMAP Email servers, and even VOIP services.
Unlike Dotcom Monitor’s solutions, Dynatrace infrastructure monitoring revolves around monitoring Cloud and Hybrid environments. They provide monitoring for platforms such as AWS, Docker, Kubernetes, Microsoft Azure, and Google Cloud.
Therefore, what you choose here is entirely dependent on your infrastructure. If you don’t use any of the cloud/hybrid deployments mentioned above, then Dotcom-Monitor can be a simple, yet powerful solution.
Load Testing
Load testing involves putting your sites, services, or applications through heavy synthetic traffic to determine any performance issues related to scaling, concurrency, and responsiveness. If done right, load testing can reveal unforeseen issues in your application that might have only surfaced in the production environment. Dotcom Monitor offers a cloud-based solution called LoadView that can perform real browser-based testing across a global, distributed network of devices. It is also easy to configure scripts using the same EveryStep Web Recorder that we mentioned earlier.
Unfortunately, Dynatrace does not have a dedicated tool for load testing web applications. They do offer integrations with third-party load testing tools such as JMeter, Neotys, and LoadRunner, but this requires you delve into two different eco-systems and having to manage everything that goes along with that.

Dynatrace vs. Dotcom-Monitor: Quote-based vs. Subscription-based Pricing
If you want to try out either of these solutions before you decide, both Dynatrace and Dotcom-Monitor offer a free trial plan. Albeit, Dotcom-Monitor offers a much more extended 30-day trial period compared to the 15-day trial period offered by Dynatrace. In my opinion, you should try out both solutions before settling with one of them.
Dynatrace offers a personalized quote for each customer, so there is no fixed pricing. However, in some cases, it can be $0.04/hour, which comes to around $30/month. To clarify, it can be much higher than this or maybe even lower depending upon your use case. So clearly, Dotcom-Monitor seems like a viable solution if budget is a concern for you.
After the trial period, if you are looking to opt in to one of these solutions, then the subscription plans for Dotcom-Monitor are extremely economical for all the tools and services you’re getting in return. All Dotcom-Monitor plans come standard with 24/7 support and many other great features.
Web-Services Monitoring
$1.99/month per target
(minimum of 10 targets required). Monitor HTTP/S, web servers, web APIs (SOAP/REST), ICMP/Ping, SSL certificates and more.
Learn More
Web Page Monitoring
$5.99/month per page
(minimum of 5 pages required). Monitor with real browsers (Chrome/Internet Explorer, Firefox) and simulate desktop/mobile devices. Detailed waterfall charts give you element-level performance detail.
Learn More
Web Application Monitoring
$7.79/month per step
(minimum of 5 steps). Supports scripting for dynamic web applications like Flash, Silverlight, AJAX, Vue, Knockout, and more and verfying content and images. See video playback and identify where issues occur.
Learn More
Internet Infrastructure Monitoring
$7.99/month per target
(minimum of 5 targets). Monitor your streaming media servers, email servers, DNS, traceroute, FTP, VoIP/SIP, and more.
Learn More
Dynatrace vs. Dotcom-Monitor: Conclusion
We’ve explained in detail what Dynatrace and Dotcom-Monitor have to offer when it comes to application performance monitoring. If your application is a simple website, then you can’t go wrong with either of these solutions. However, if you want an APM for a web application that has complexity and is dynamic, then Dotcom-Monitor is your best bet. Dynatrace users have commented that the UI can be quite complex to manage and walk through. Additionally, the platform runs on top of the network, which consumes memory, potentially slowing down the performance of a web transaction. The Dotcom Monitor platform has an easy-to-use interface with no complex, hard to read dashboards. It is also an overall preferred solution considering its pricing and the services it has to offer.
Compare Industry Monitoring Tools


