





Organizations Worldwide
Platform Uptime SLA
Global Monitoring Locations
Website Monitoring Leader
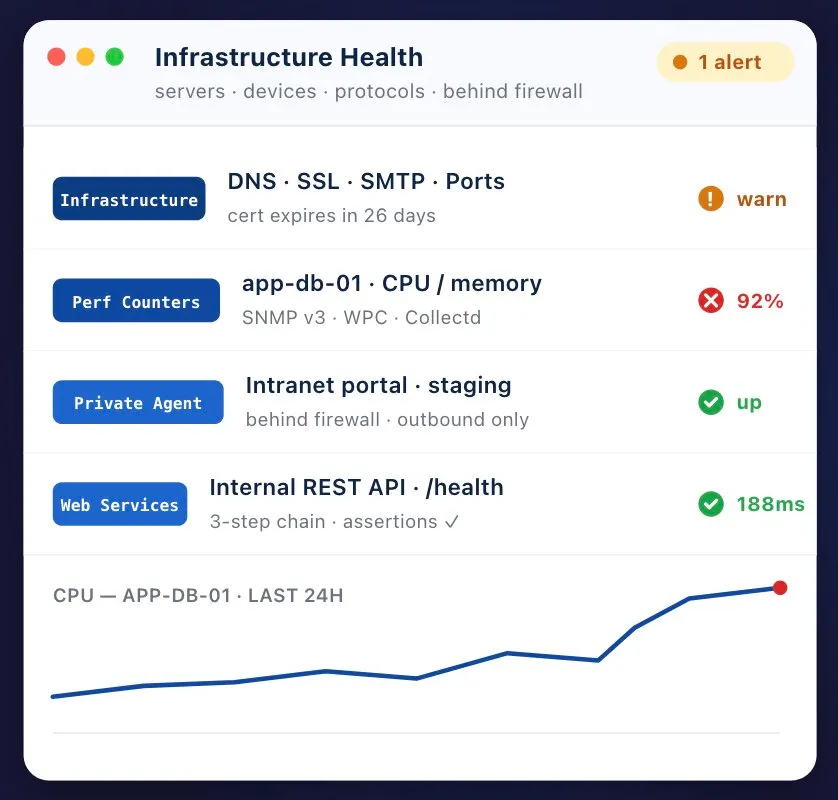
Infrastructure monitoring is the continuous checking of the servers, network devices, protocols, and internal systems your applications depend on — confirming they are up, reachable, and performing within thresholds. Dotcom-Monitor watches infrastructure from two directions at once: Internet Infrastructure checks availability and protocols from the outside, and Performance Counters collects deep server and device metrics (CPU, memory, disk, SNMP counters) from the inside. Private Agents extend both behind your firewall.
Most monitoring tools give you one vantage point. An external checker tells you a site is down but not why. An agent on a box tells you the CPU is pegged but not that DNS resolution just started failing for half your users. Real infrastructure problems don’t respect that boundary — a certificate expires, a switch drops packets, a disk fills, a mail queue backs up — and the layer that broke is rarely the layer where you first feel the pain.
Dotcom-Monitor collapses that gap into a single platform. Internet Infrastructure runs protocol and uptime checks from monitoring agents on major internet backbones across six continents — the outside-in view. Performance Counters installs a lightweight collector inside your network to pull Windows Performance Counters, Linux Collectd counters, and SNMP data from servers and network gear — the inside-out view. Private Agents carry every check type into private networks so internal apps, staging, and firewalled devices are monitored the same way as public ones. And because Web Services, Web Applications, and Web Pages share the same dashboard, you can trace a slow checkout all the way down to the database server that’s swapping.
Each platform covers a different layer of your infrastructure. Run them together and a single dashboard shows availability, protocol health, device metrics, and the user experience on top — with one drill-down path from a red tile to the root cause.
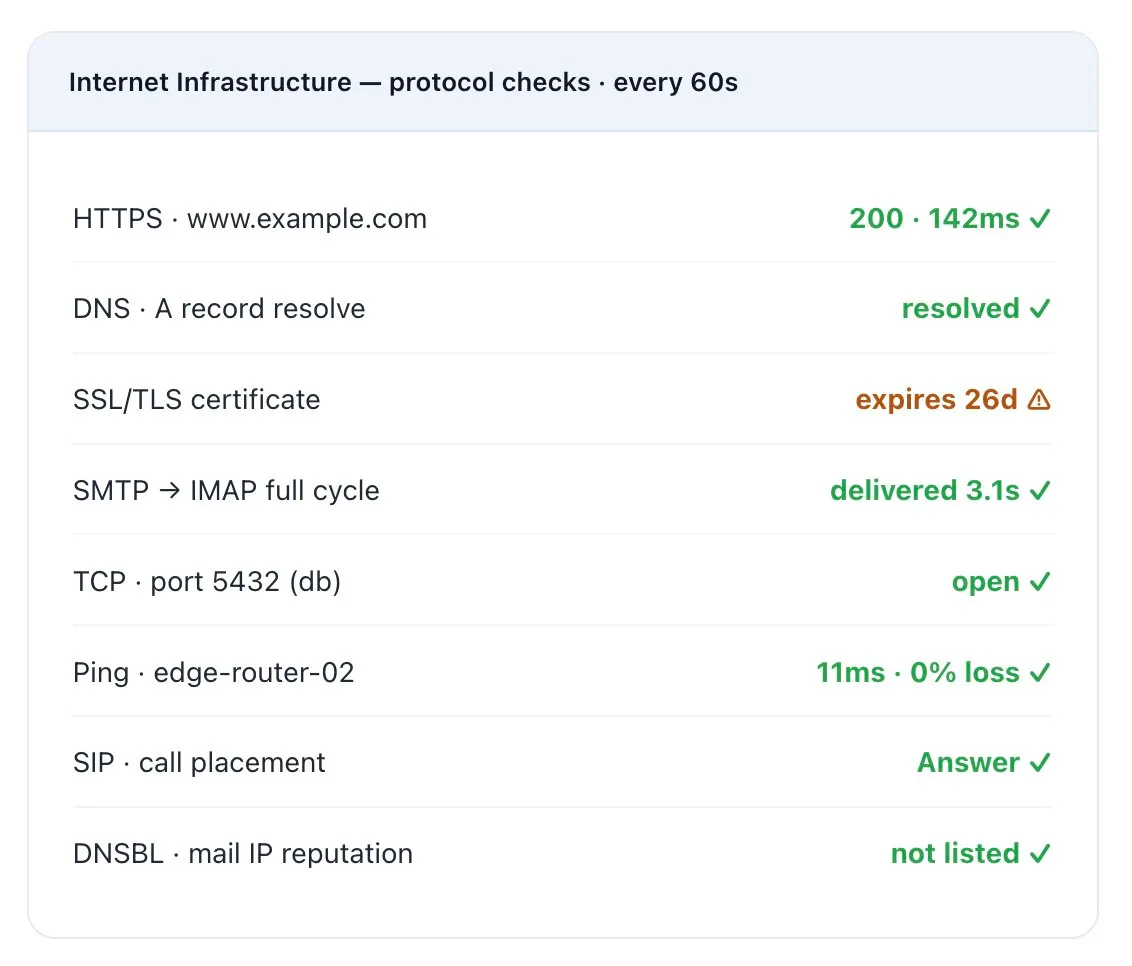
Uptime and protocol checks from global agents — HTTP/HTTPS, DNS, SSL/TLS certs, SMTP/POP3/IMAP mail, FTP, VoIP/SIP, TCP/UDP ports, ICMP ping, and traceroute.
Deep device and OS metrics collected by an agent inside your network — Windows Performance Counters, Linux Collectd, SNMP v1/v2/v3, and custom metrics via REST.
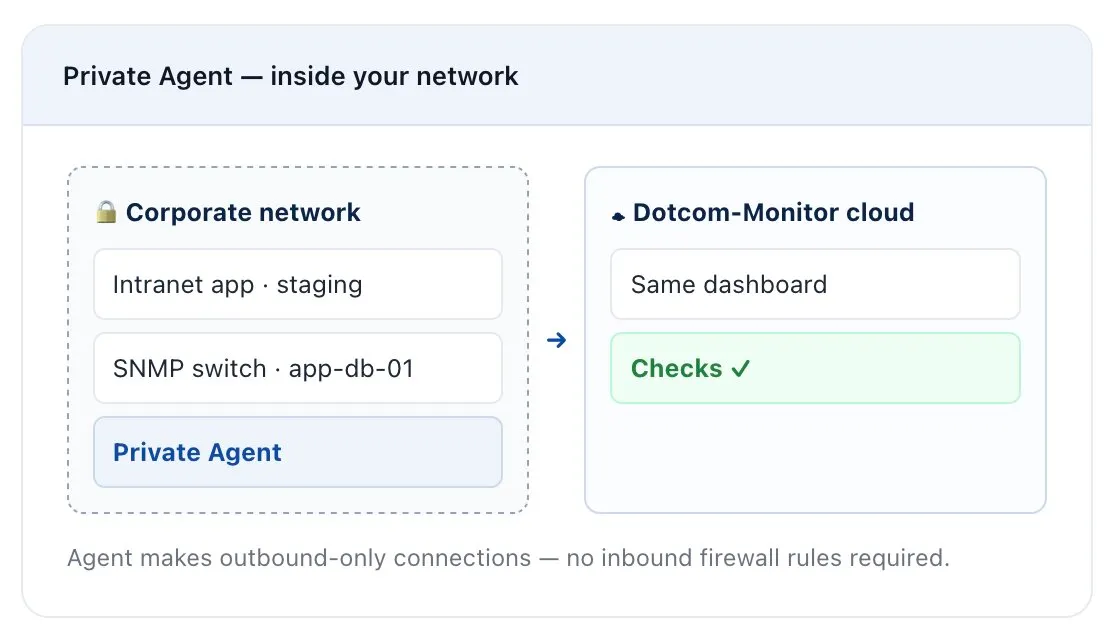
Run any check type against internal systems that have no public IP. Outbound-only connection to the cloud — no inbound firewall rules, same dashboard as public monitors.
Multi-step API and web-service checks — REST, SOAP, GraphQL, WebSocket — with assertions on status, latency, and payload. Watch internal health endpoints and service meshes.
Scripted browser transactions that exercise the full stack end-to-end, so infrastructure faults show up as a broken step with a screenshot, video, and waterfall.
Real-browser page-load and Core Web Vitals checks that reveal when a backend, CDN, or third-party dependency is dragging the front end down.
Internet Infrastructure checks your servers, network, and services the way the outside world actually reaches them — from monitoring agents positioned worldwide across major internet backbones. Redundant checks across multiple agents verify every failure before it pages you, so you get real alerts, not false alarms.
Use it for: web & app servers · DNS · mail · VoIP · network devices · certificates
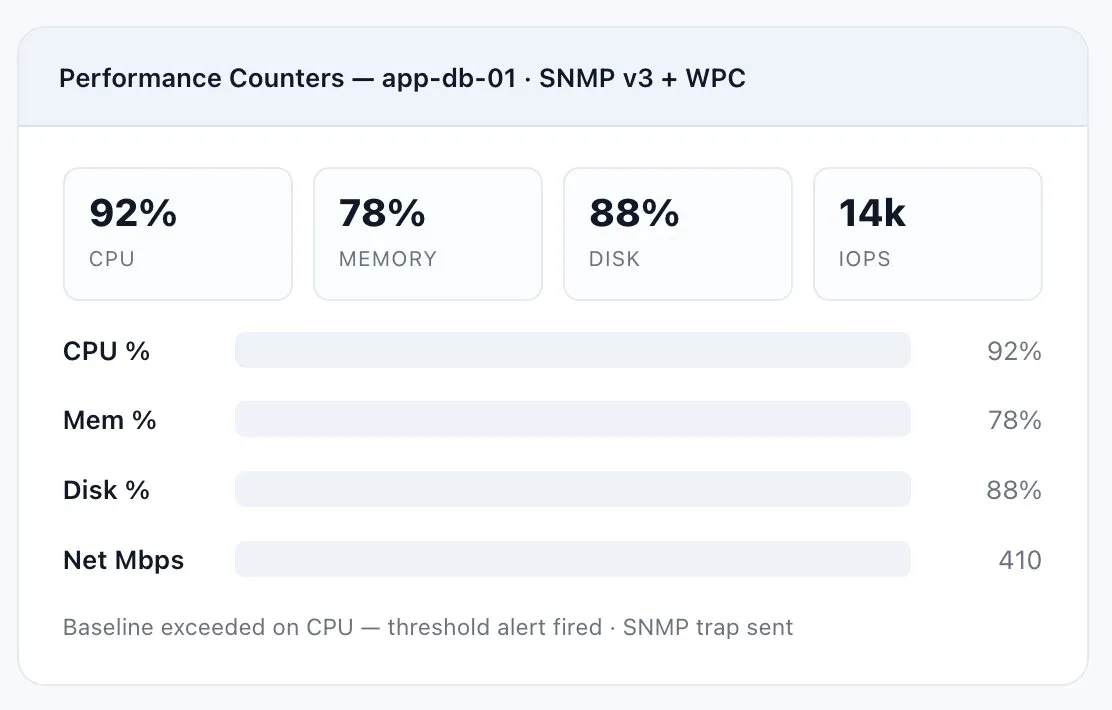
Performance Counters reaches the metrics external checks can’t see. Install the Performance Counters agent on a single machine inside your network and it polls performance data from your servers and network devices — no agent required on every box, because one collector can gather from any remote node it has rights to.
Use it for: CPU · memory · disk · switches & routers · SNMP devices · custom telemetry
Intranet apps, staging environments, internal APIs, and devices with no public IP still need monitoring. Deploy a Private Agent on a Windows or Linux host inside your trusted network — a VM, a jump box, or a dedicated appliance — and it opens a single outbound HTTPS session to Dotcom-Monitor. No inbound firewall rules. No holes punched.
Use it for: internal apps · staging · VPN-only systems · firewalled devices · pre-production
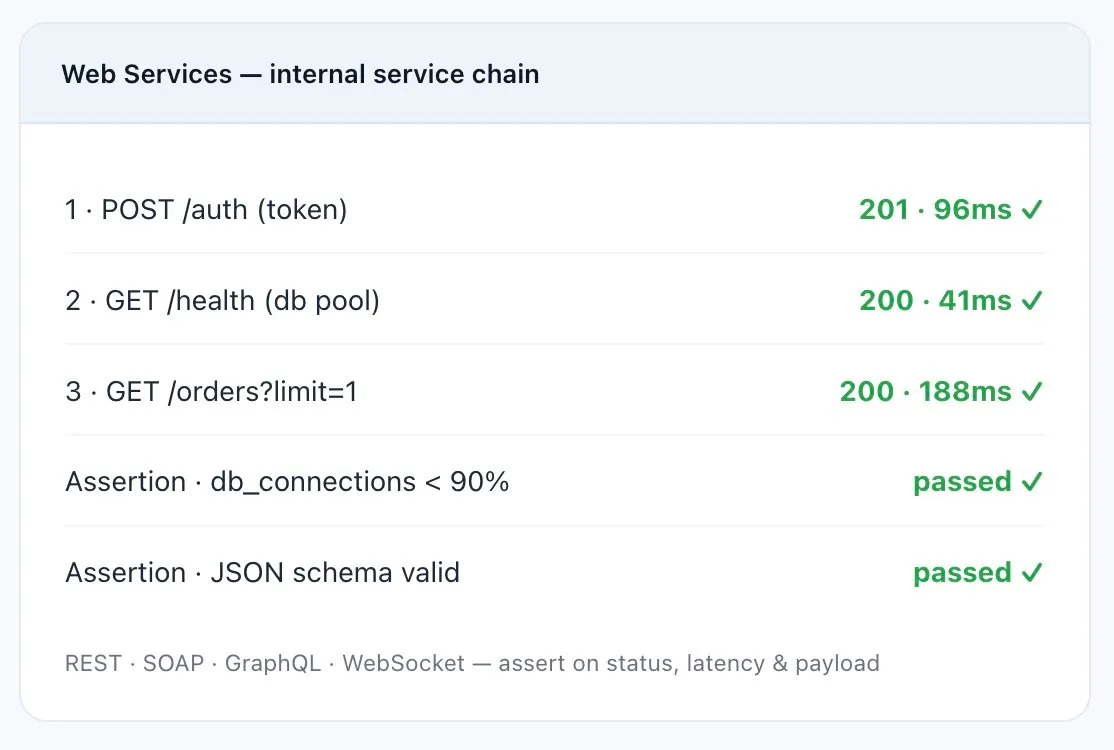
Infrastructure isn’t only hardware — it’s the internal APIs and services that tie it together. Web Services runs multi-step checks against REST, SOAP, GraphQL, and WebSocket endpoints, asserting on status codes, response times, and payload contents so you know a service degraded before the app on top of it does.
Use it for: health endpoints · internal APIs · microservices · message queues · service meshes
Web Applications and Web Pages sit on top of the stack and exercise it end-to-end. When something in the infrastructure below breaks, it surfaces as a failed step or a slow page — with the evidence attached to prove where it happened.
Record a real user journey — log in, search, add to cart, check out — with the EveryStep recorder and run it on a schedule from real browsers. A backend timeout, an expired cert, or a failing dependency stops the script at the exact step, and you get a screenshot, a session video, a console log, and a waterfall captured at the moment of failure.
Measure Largest Contentful Paint, Time to Interactive, and load waterfalls from actual desktop and mobile browsers. Element-level timing shows when a slow backend response, an overloaded server, or a third-party dependency is what’s dragging the page down — not the front-end code.
Internet Infrastructure checks run from tier-3 data-center agents across six continents, so you catch a regional DNS failure or an ISP routing change before a support ticket does. Performance Counters and Private Agents run inside your network, so firewalled servers and SNMP devices are covered with the same rigor. Both feed one dashboard, one alerting engine, and one set of SLA reports.
Continents of monitoring agents
Down to 1-minute check frequency
SNMP versions supported
Monitoring infrastructure since
Point Internet Infrastructure at public URLs, hosts, and protocols. Group related checks into devices so reports and alerts stay clean.
Install the Performance Counters agent to collect SNMP and performance counters, and a Private Agent to reach anything behind the firewall.
Establish baseline performance, define acceptable thresholds per metric, and choose check frequencies down to one minute.
Send verified alerts to the right team, suppress false alarms with redundant checks, and export SLA and trend reports.
Tier-3 checkpoints across six continents. Run checks from specific regions to isolate geo-routing, CDN, and ISP-level problems instead of guessing whether an outage is yours or the network’s.
Internet Infrastructure protocol checks, Performance Counters device metrics, Web Services APIs, and front-end checks in one view. Drill from an aggregate health tile to a single failed check in seconds.
Performance Counters establishes baseline performance for each counter, captures trends in reports, and fires alerts per variable or data point when values drift outside your acceptable range.
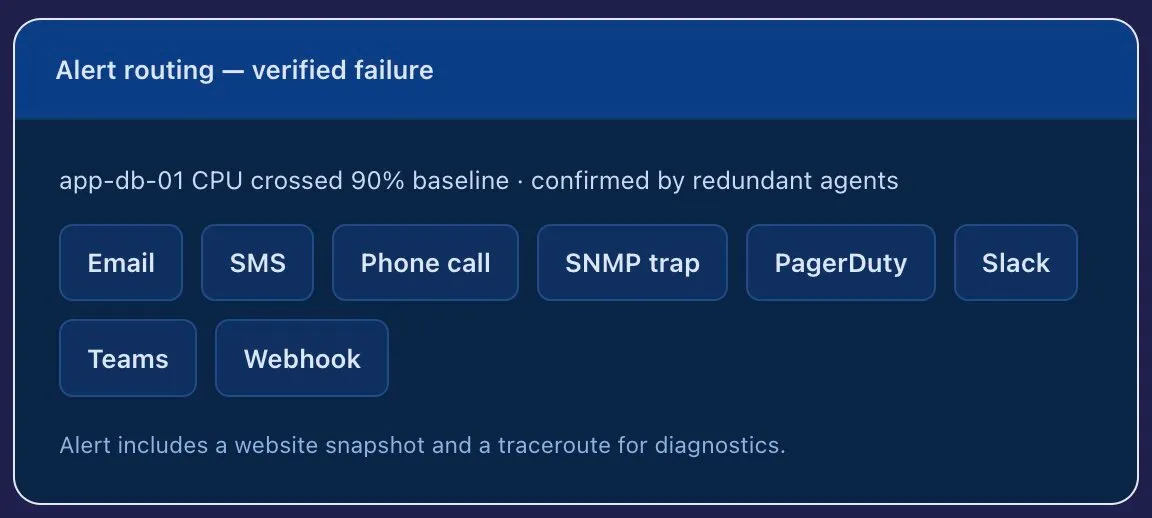
Redundant checks across multiple agents confirm a failure before you’re paged. Route to PagerDuty, Slack, Teams, email, SMS, voice, SNMP trap, or webhook — with a snapshot and traceroute attached.
Private Agents connect outbound-only, so nothing internal is exposed to the internet. Monitor firewalled and VPN-only systems without opening a single inbound port.
Real-time dashboards, scheduled PDF/CSV exports, and SLA reports for uptime, response time, and error rate against your thresholds — with white-label options for MSPs and agencies.
How teams combine Internet Infrastructure, Performance Counters, and Private Agents to keep critical infrastructure healthy.
Performance Counters tracks CPU, memory, disk, and SNMP counters across racks of servers and network gear; Internet Infrastructure confirms the services on top stay reachable. Baselines catch a hot node before it takes tenants down.
Private Agents monitor intranet portals, SSO, and staging environments behind the firewall, while Internet Infrastructure watches DNS, certificates, and mail. One dashboard for public and private alike.
Customers: Dell, Citrix, Xerox.
SIP call-placement checks confirm voice services actually connect, ping and traceroute map network paths, and Performance Counters pulls SNMP metrics from switches and routers at carrier scale.
Customers: Comcast, Dish.
Mail-server full-cycle checks, certificate-expiry alerts, and SLA reports that satisfy compliance audits. Redundant verification keeps false alarms out of a regulated on-call rotation.
Customer: Aflac.
Port and database-connectivity checks, API health via Web Services, and Web Applications checkout scripts on top — so an infrastructure fault shows up as a broken step long before it dents the conversion report.
Because monitoring is outside-in and inside-out, the runtime doesn’t matter. Bare metal, VMs, Kubernetes, or serverless — check the public endpoints externally and the hosts internally, all the same way.
Most infrastructure tools are agent-first and priced per host, so covering everything gets expensive fast. Dotcom-Monitor pairs agentless external checks with lightweight internal collectors — and prices per monitor, not per box.
Capability | Dotcom-Monitor | Datadog | SolarWinds | PRTG | Site24x7 |
|---|---|---|---|---|---|
Outside-in protocol & uptime checks from global agents | Yes | Add-on | Add-on | Limited | Yes |
SNMP v1/v2/v3 & performance-counter collection | Yes | Yes | Yes | Yes | Yes |
One agent collects from many remote nodes | Yes | Per-host | Partial | Yes | Partial |
Private agent runs the full check set behind firewall | Yes | Partial | Partial | Yes | Yes |
Full-cycle mail (SMTP → IMAP/POP3) check | Yes | No | Partial | Partial | Partial |
VoIP/SIP call-placement monitoring | Yes | No | Partial | Partial | No |
Front-end (Web Applications / Web Pages) in the same platform | Yes | Yes | Partial | No | Yes |
Flat per-monitor pricing — no per-host or ingest fees | Yes | Per-host | Per-node | Sensor-based | Plan-based |
White-label / MSP reseller reporting | Yes | No | Partial | Partial | Yes |
Dedicated monitoring vendor since the 1990s | 1998 | 2010 | 1999 | 2003 | 2006 |
“Add-on / Partial / Limited” = available with limitations, as a separate module, or on higher tiers. Competitor capabilities and pricing models change frequently and were compiled in July 2026; verify current details with each vendor.
Monitor DNS, SSL/TLS certs, SMTP/POP3/IMAP, FTP, VoIP/SIP, and TCP/UDP ports with Internet Infrastructure. Run ping and traceroute from multiple regions to spot ISP routing changes and packet loss, and poll switches and routers over SNMP with Performance Counters.
Collect Windows Performance Counters and Linux Collectd metrics with Performance Counters, set baselines and thresholds on CPU, memory, and disk, and get alerted the moment a node drifts — one collector covers many machines.
Correlate a failed Web Applications step or a slow Web Services API against the underlying host metrics in the same dashboard. Gate deploys on synthetic checks and track error budgets with SLA reports instead of spreadsheets.
Private Agents connect outbound-only, so firewalled and VPN-only systems are covered with no inbound ports opened. Certificate-expiry and DNSBL checks close common security gaps; SLA reports satisfy audits.
Alerts, dashboards, and data flow into the tools your team already uses.
Route different devices to different escalation chains, suppress alerts during maintenance windows, and deliver by every channel your team relies on.
Turn verified failures into tickets automatically and trigger post-deploy infrastructure checks straight from your pipeline.
The Dotcom-Monitor REST API provisions monitors, pulls historical data, and manages configs — and Performance Counters accepts custom metrics from your own sensors over REST.
If your question isn’t here, contact us — a real engineer will answer.
Infrastructure monitoring is the continuous checking of the servers, network devices, protocols, and internal systems your applications depend on — verifying they’re up, reachable, and performing within thresholds. Dotcom-Monitor covers it from two directions at once: Internet Infrastructure checks availability and protocols from outside your network, while Performance Counters collects deep OS and device metrics (CPU, memory, disk, SNMP counters) from inside it.
Internet Infrastructure is outside-in: global monitoring agents check uptime, response time, and protocols — HTTP, DNS, SMTP/POP3/IMAP, FTP, SIP/VoIP, TCP/UDP ports, ICMP ping, and traceroute — the way the outside world reaches your infrastructure. Performance Counters is inside-out: a locally installed agent collects Windows Performance Counters, Linux Collectd counters, and SNMP v1/v2/v3 data from your servers and network devices, then feeds it into the same dashboard for baselining, thresholds, and alerts. Most teams run both.
You install the Performance Counters agent on a machine inside your network. It polls Windows Performance Counters, Linux Collectd counters, and SNMP-capable devices — v1/v2 using a community string and OID, v3 using a username and password with encryption. One agent can collect from remote nodes it has rights to (it needs administrator or “performance monitor users” rights for those nodes), so you don’t need an agent on every machine. Dotcom-Monitor polls the agent on a schedule and aggregates the data for baselines, threshold alerts, and trend reports.
Yes. Deploy a Private Agent on a Windows or Linux host inside your network. It makes outbound-only connections to Dotcom-Monitor — no inbound firewall rules required — and runs the full task set: HTTP/HTTPS, REST, SOAP, GraphQL, WebSocket, Web Pages, Web Applications, Internet Infrastructure, and Performance Counters checks against internal systems. The results appear in the same dashboard as your public monitors.
Internet Infrastructure checks web and application servers (HTTP/HTTPS, including error responses like 500s), mail servers (SMTP, POP3, IMAP, including full send-and-retrieve cycles), DNS servers, FTP servers, VoIP/SIP systems, streaming media servers, TCP and UDP ports, and raw IP-level connectivity via ICMP ping and traceroute. It also checks SSL/TLS certificate validity and DNS blacklist (DNSBL) status.
By catching failures at the layer where they start. A degrading disk or a climbing CPU counter in Performance Counters warns you before an app slows down; a failed protocol check in Internet Infrastructure pinpoints whether DNS, SSL, a port, or the app tier broke; and a traceroute in the alert shows where on the path packets are being lost. That layered evidence means less time guessing which component failed and faster resolution.
No. Internet Infrastructure checks run entirely from Dotcom-Monitor’s external agents with nothing installed on your side. Performance Counters needs its agent on just one machine per network segment — it collects from other nodes it has rights to. A single Private Agent likewise covers many internal targets. You install agents where you need to reach inside the network, not on every box.
Alerts by email, SMS, phone call, SNMP trap, PagerDuty, Slack, Microsoft Teams, Opsgenie, and webhook. Conditions can require verified failures across redundant agents to suppress false alarms, and alerts can include a website snapshot and a traceroute for diagnostics. Reporting includes baselines, trend reports, threshold reports, and SLA reports, with white-label options for MSPs.
A 30-day free trial with full feature access across all platforms, including Private Agents and Performance Counters. No credit card required to start.
Pricing is based on monitor count, check frequency, and platform mix — not per-host or per-seat, and with no charges for data-ingest volume. See the pricing page for current plans or contact sales for a custom quote.
Set up your first checks in minutes and add Performance Counters and Private Agents as you go. No credit card. No sales call required to start.