 Vue.js has rapidly become one of the most popular front-end JavaScript frameworks, known for its simplicity, flexibility, and powerful performance capabilities. It enables developers to build quick, dynamic, and interactive Single Page Applications (SPAs) that deliver smooth user experiences.
However, as businesses increasingly depend on these web-based applications, ensuring consistent performance, uptime, and reliability has become a critical challenge. Monitoring Vue.js applications is essential to detect performance bottlenecks, script errors, and slow-loading components before they impact end users.
In this blog, we’ll explore what makes Vue.js unique, its key advantages and challenges, and why comprehensive web application monitoring is vital. We’ll also highlight how synthetic monitoring provides real-world visibility into user experience and how platforms like Dotcom-Monitor empower teams to monitor, test, and optimize SaaS and Vue.js-based applications effectively.
How Does Vue.js Differ from Other JavaScript Frameworks?
Vue.js has earned its reputation as one of the most developer-friendly and adaptable JavaScript frameworks. It combines the best features of React and Angular while offering a more flexible and intuitive approach to building modern web and SaaS applications. Let’s explore how Vue.js stands out compared to React and Angular.
Vue.js vs. React
Both Vue.js and React are powerful tools for creating dynamic user interfaces, but they differ in philosophy and implementation:
- Design Philosophy: Vue is known for its simplicity and minimal setup requirements. It allows developers to get started quickly with clear syntax and built-in directives. React, meanwhile, is heavily component-driven, requiring deeper JavaScript and JSX knowledge, which can increase complexity for newcomers.
- Two-Way Data Binding: Vue includes native two-way data binding, making synchronization between the model and the view seamless. React uses a unidirectional data flow, which promotes predictability but demands additional setup to replicate Vue’s reactivity.
- Ecosystem and Flexibility: Vue’s environment is smaller but less opinionated, giving developers the freedom to integrate other tools and frameworks. React’s larger ecosystem provides strong community support and robust state management libraries such as Redux or Recoil.
Vue.js vs. Angular
Angular and Vue.js both enable powerful web applications, but their approaches differ in structure, complexity, and performance:
- Complexity: Angular is a comprehensive, full-featured framework, ideal for enterprise-grade applications. Vue, on the other hand, is a progressive framework that focuses on the view layer, offering simplicity and flexibility for projects of any size.
- Learning Curve: Vue’s gentle learning curve makes it accessible for beginners and teams transitioning from jQuery or vanilla JavaScript. Angular’s reliance on TypeScript and strict architectural patterns can make it more challenging to master.
- Size and Performance: Vue’s lightweight build and small file size translate into faster load times and smoother performance, ideal for Single Page Applications (SPAs) and SaaS products. Angular’s larger footprint, while powerful, may require extra optimization for performance-critical use cases.
Advantages and Disadvantages of Using Vue.js
Like any modern JavaScript framework, Vue.js comes with its own set of strengths and trade-offs. Its balance of simplicity, flexibility, and performance makes it an excellent choice for monitoring SaaS applications and building scalable web interfaces, but developers should be aware of its limitations as well.
Advantages of Vue.js
Easy Learning Curve:
Vue’s simple syntax and intuitive structure make it highly beginner-friendly. Developers can quickly get started without extensive prior knowledge of advanced JavaScript concepts.
Flexibility:
Vue follows a progressive framework philosophy. Teams can start small—integrating Vue into existing applications—and scale up to full-featured Single Page Applications (SPAs) as project complexity grows.
Two-Way Data Binding:
Vue’s built-in two-way data binding keeps data in sync between the model and the view in real time, improving productivity and simplifying complex UI updates.
Lightweight and Fast:
With its small footprint and optimized rendering engine, Vue delivers outstanding performance ideal for high-speed SaaS platforms and real-time web applications.
Disadvantages of Vue.js
Smaller Community:
Compared to React or Angular, Vue has a smaller developer community. This can sometimes mean fewer third-party tools, plugins, or enterprise-level integrations.
Limited Large-Scale Adoption:
Although Vue’s adoption is growing rapidly, it still lags behind React and Angular in enterprise environments, particularly among Fortune 500 companies.
Potential Overuse of Directives:
Vue’s reliance on directives (such as v-bind and v-model) can make code harder to maintain if overused, potentially affecting performance and readability.
Ensure Peak Vue.js Performance with Dotcom-Monitor
Avoid performance bottlenecks and code inefficiencies by continuously monitoring your Vue.js applications.
Dotcom-Monitor’s web application monitoring tools provide real-time insights into page performance, script execution, and user interactions—helping you detect slowdowns and maintain a flawless digital experience.
Why You Should Monitor the Performance of Vue.js SPAs
Monitoring Vue.js Single Page Applications (SPAs) is critical for ensuring the smooth, app-like experience modern users expect. Unlike traditional multi-page websites, SPAs dynamically load content in real time without full-page reloads, making them highly responsive but also more complex to monitor.
Any performance lag, unresponsive element, or rendering glitch can immediately impact the user experience, leading to higher bounce rates and lower engagement. Because Vue SPAs constantly fetch new data and update the DOM dynamically, performance issues such as slow API calls, inefficient state management, or delayed UI rendering can go unnoticed without proactive monitoring.
Vue’s features like two-way data binding, watchers, and computed properties make development easier but can also increase memory usage and CPU load if not optimized properly. Regular web application monitoring helps detect excessive resource consumption and pinpoint JavaScript or API bottlenecks before they affect end users.
Additionally, since Vue.js applications rely heavily on client-side rendering, they’re prone to JavaScript errors and browser-specific issues that traditional server monitoring tools can’t catch. Monitoring ensures early detection of these front-end issues, enabling teams to resolve them quickly and maintain consistent app performance.
By continuously tracking page load times, memory usage, API latency, and JavaScript errors, you can ensure your Vue.js applications stay fast, reliable, and user-friendly, a critical factor for businesses that depend on SaaS applications and web performance to drive customer satisfaction.
Vue.js Enables and Encourages Monitoring
One of the key strengths of Vue.js is its flexibility not only in development but also in application performance monitoring (APM). The Vue ecosystem is built to encourage developers to easily integrate monitoring solutions that track crucial performance metrics such as page load time, rendering speed, network request timing, and error rates. These metrics are essential for ensuring your Vue.js applications remain responsive, efficient, and reliable.
The NPM Ecosystem and Monitoring Integration
The NPM (Node Package Manager) ecosystem plays a pivotal role in monitoring Vue.js applications. Originally designed for Node.js packages, NPM has grown into the world’s largest software registry, hosting over 800,000 packages across the JavaScript ecosystem.
Vue.js developers leverage NPM for managing dependencies and integrating third-party monitoring and APM tools with minimal effort.
Most web application monitoring tools designed for Vue.js are distributed as simple NPM packages that can be installed and configured within minutes. For example, integrating a third-party performance monitoring solution typically looks like this:
npm install --save @third-party/apm-vueThis streamlined integration process allows organizations to rapidly add performance tracking, error monitoring, and analytics into their Vue applications, ensuring continuous insight into application health and real-time performance metrics.
Support for Extensions and Plugins
Vue.js also provides an elegant system for incorporating plugins and extensions into your applications. Through the built-in Vue.use() method, developers can easily register and configure monitoring extensions or custom APM modules globally within the app.
For instance:
var MyPlugin = require('apm-vue')
Vue.use(MyPlugin, options)

new Vue({
  // application options
})
Vue.js is intelligent enough to ignore duplicate plugin declarations, ensuring clean integrations and preventing configuration conflicts. This flexibility and robustness make it simple to integrate multiple website monitoring applications or SaaS monitoring tools into the same environment.
By using the NPM ecosystem and Vue’s plugin system, developers can set up monitoring strategies that give a full view of how the system is performing, helping teams find, understand, and fix problems more quickly.
Support for Plain JavaScript Interceptions
Many APM (Application Performance Monitoring) providers prefer not to create and maintain separate software packages for every JavaScript framework, and for good reason. With frameworks like Angular, React, Vue.js, and Alpine.js, developing framework-specific integrations for each would be cumbersome and difficult to maintain.
To solve this, most web application monitoring tools use plain JavaScript interceptions, offering a single universal script that can easily integrate with any framework, including Vue.js. This approach enables APM solutions to efficiently capture performance metrics, error data, and user interaction details from your application without requiring framework-specific plugins.
Here’s an example of how such a monitoring script might look:
<script>
(function(i,s,o,g,r,a,m){i[APM]=r;i[r]=i[r]||function(){
(i[r].q=i[r].q||[]).push(arguments)},i[r].l=1*new Date();a=s.createElement(o),
m=s.getElementsByTagName(o)[0];a.async=1;a.src=g;m.parentNode.insertBefore(a,m)
})(window,document,'script','//eum.apm.io/eum.min.js','ineum');

ineum('reportingUrl', 'https://eum-us-west-2.apm.io');
ineum('key', '1LHYrJaFQE-L-9KFgd1R6g');
</script>
This snippet is typically placed inside the <head> tag of your project’s index.html file. Once added, the APM script automatically begins tracking your Vue.js application’s performance, capturing essential data like page load time, network latency, JavaScript execution delays, and user session activity.
This lightweight, framework-agnostic approach makes it easier to apply monitoring SaaS applications and website monitoring tools across diverse tech stacks, ensuring end-to-end visibility without the need for separate integrations for each framework.
Explore More on Monitoring Web and SaaS Applications
Want to go beyond Vue.js? Learn how comprehensive website and SaaS application monitoring can help improve performance, reliability, and user satisfaction across your entire tech stack.
Read our guide on Best Practices for Monitoring SaaS Applications
Vue.js Lifecycle Hooks
A Vue.js component is a modular unit that combines UI, logic, and styling for a specific function—for example, a navigation bar, modal, or data table. Each component goes through a series of lifecycle stages, from creation to destruction, and Vue.js exposes built-in lifecycle hooks to let developers tap into these stages.
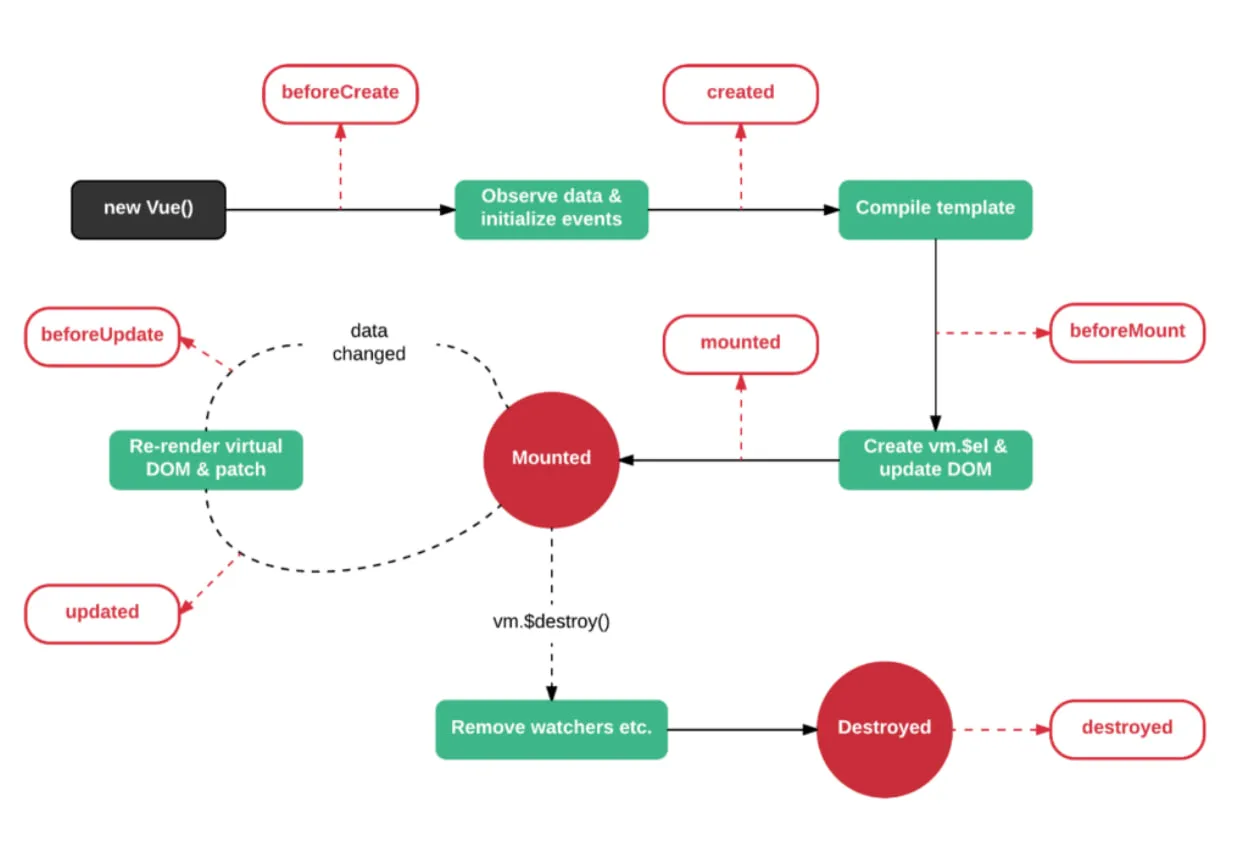
Understanding and monitoring these hooks is important for improving application performance. Developers and APM tools used for monitoring Vue.js applications can utilize these lifecycle events to detect inefficiencies, performance bottlenecks, or delayed rendering in real time.
For instance, placing excessive logic inside the created() hook is a common performance pitfall. This hook should primarily handle variable initialization. Performing heavy operations such as network requests, animations, or large data processing during this phase can cause rendering delays. Instead, such tasks should be placed in the mounted() hook, which executes after the DOM has been rendered.
Many modern web monitoring solutions and SaaS monitoring platforms automatically track these lifecycle hooks to identify slow initialization times, inefficient data binding, or delayed component mounting. They then provide actionable feedback that helps developers refactor their code and enhance both performance and scalability.
Monitoring with Vue Router
Vue Router is the official routing library for Vue.js applications. It manages navigation by updating the browser’s URL bar and mapping each route to its respective view or component, making it incredibly easy to build Single Page Applications (SPAs).
However, this client-side routing introduces a unique challenge for traditional application performance monitoring (APM) solutions since there’s no full page reload; monitoring tools can’t automatically detect route changes or measure navigation performance. In essence, Vue.js SPAs simulate page transitions, and without proper instrumentation, valuable insights into user navigation and page-specific performance could be lost.
Fortunately, Vue Router provides navigation guards, which allow developers to run custom logic before or after a route change. These guards can be used to collect metrics, measure page transition times, and send data to your monitoring platform for deeper analysis.
For example, you can track page changes after navigation:
router.afterEach(to => {
  let pageName = to.path;
  if (to.matched && to.matched.length > 0 && to.matched[0].path) {
    pageName = to.matched[0].path;
  }
  console.log('Set page to', pageName);
  ineum('page', pageName);
});
Or, you can collect performance data before a route change occurs:
router.beforeEach((to, from, next) => {
  const pageName = to.path;
  const pageMetrics = { /* custom metrics collection logic */ };
  console.log('Set page to', pageName);
  ineum('page', pageName);
  ineum('metrics', pageMetrics);
  next();
});
These navigation guards help APM and web application monitoring tools sort data by route and show detailed information about each page in dashboards using visuals like charts, tables, and heatmaps.
By integrating Vue Router monitoring into your workflow, you gain granular visibility into how users interact with different parts of your application—a best practice for monitoring SaaS applications and improving SPA performance overall.
Error Handling in Vue.js Applications
Vue.js offers a powerful and flexible mechanism for error handling, allowing developers to seamlessly delegate exception management to third-party monitoring or APM (Application Performance Monitoring) tools. This approach not only simplifies debugging but also ensures that critical runtime errors are automatically captured, logged, and analyzed, a key aspect of effective web application monitoring.
The core API for this capability is Vue.config.errorHandler, which provides a global hook for handling unhandled errors that occur during component rendering or lifecycle hooks. By customizing this handler, developers can integrate real-time error tracking, send detailed stack traces to monitoring tools, and gain actionable insights into production-level issues.
Here’s an example of how this function works:
var _oldOnError = Vue.config.errorHandler;

Vue.config.errorHandler = function VueErrorHandler(error, vm) {
  atatus.notify(error, {
    extra: {
      componentName: Vue.util.formatComponentName(vm),
      propsData: vm.$options.propsData
    }
  });

  if (typeof _oldOnError === 'function') {
    _oldOnError.call(this, error, vm);
  }
};
In this setup:
- The custom error handler reports exceptions to a third-party APM solution like Dotcom-Monitor.
- Metadata, such as component names and props data, helps pinpoint the exact source of the error.
- The original Vue error handler is preserved to ensure compatibility with other error-handling logic in your application.
Modern APM tools use machine learning (ML) and AI-powered analytics to automatically identify recurring issues, detect anomalies, and recommend optimizations based on historical data. This intelligent approach allows teams to focus on improving performance and stability rather than manually investigating every error.
By leveraging Vue’s built-in error handling in combination with advanced Vue.js monitoring tools, teams can achieve proactive visibility, faster debugging, and overall improved application resilience—especially critical for SaaS and enterprise-grade applications.
Synthetic Monitoring and Measuring Real-World Performance
Monitoring the performance of Vue.js applications, particularly Single Page Applications (SPAs), requires more than traditional APM (Application Performance Monitoring) tools. Because the browser renders much of the content and logic dynamically, SPAs behave differently from multi-page websites. As a result, standard monitoring methods that track simple HTTP responses often miss critical parts of the real user experience—like how long it takes before the application becomes fully interactive.
Synthetic monitoring fills this gap by simulating user behavior in a controlled, browser-based environment. Instead of just checking whether a page responds, synthetic monitors perform real-world actions such as logging in, navigating between views, submitting forms, or adding items to a cart. This allows developers and IT teams to understand how their Vue.js application performs during actual user interactions, not just during initial load.
Unlike protocol-based monitors that only check the first response, synthetic monitoring keeps measuring performance as the user moves around the SPA, providing a complete view of loading times, how responsive it is, and any slowdowns in JavaScript execution.
How Dotcom-Monitor Enhances Vue.js Application Monitoring
Dotcom-Monitor’s synthetic monitoring platform is built to support complex, dynamic applications like those created with Vue.js. With its intuitive point-and-click scripting tool, teams can easily record and test essential user flows without writing complex code. These recorded scripts are executed on real browsers—such as Chrome or Edge—across multiple global locations and device types.
This approach provides profound visibility into:
- This approach offers a comprehensive understanding of page load and render times in various regions and browsers.
- User interaction speeds for key workflows (login, checkout, search, etc.).
- Front-end performance bottlenecks, including JavaScript execution or API latency.
- Visual and content validation, ensuring that critical elements like buttons, forms, or images appear as intended.
Because synthetic monitoring doesn’t require adding extra code or external scripts to your app, it introduces zero performance overhead. Instead, it delivers an accurate, low-intrusion view of how real users experience your Vue.js application under real-world conditions.
By using synthetic monitoring along with Vue’s performance insights, Dotcom-Monitor helps developers and IT managers find problems early, improve stability, and make the user experience better before any issues affect customers.
Get Complete Visibility into Your Vue.js Application Performance
Deliver a fast, seamless experience across every device and browser. With Dotcom-Monitor’s synthetic monitoring solution, you can test, measure, and optimize Vue.js applications in real-time—just like your users experience them.
