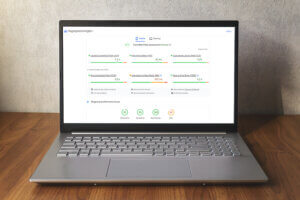
How to Use Google PageSpeed Insights Correctly: A Technical Guide
PageSpeed Insights is a Google web tool that analyzes web page performance and optimization. It provides valuable insights and recommendations to help website developers improve their websites’ speed and user
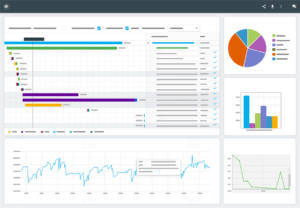
Top 15 Infrastructure Monitoring Tools
Infrastructure monitoring tools ensure systems’ optimal performance and availability, enabling the identification and resolution of potential issues before they become complex. This article delves into the different infrastructure monitoring tools

Top 20 Server Monitoring Tools of 2023
A server monitoring tool is software that monitors the operation and general health of servers and other components of IT infrastructure. These tools continuously track and gather information on a

Top 25 Server Monitoring Tools
In this article we give our expert picks of the top 25 server monitoring tools to help monitor your website’s uptime and give your users the best experience, starting with our own solution at Dotcom-Monitor. Learn why server monitoring is an essential part of any monitoring strategy.

Top 20 Synthetic Monitoring Tools
Synthetic monitoring allows teams to monitor and measure website and web application performance around the clock from every conceivable vantage point, and to receive alerts before issues begin to impact real users. Here are our top picks for synthetic monitoring tools, leading with our own at Dotcom-Monitor.

Web Monitoring Tools, Uptime & Your Business Online
By using a web monitoring tool, you can be sure your site will be available at all times, no matter where a user might be around the world. You will also know when the performance of your site begins to suffer or experiences downtime, and Dotcom-Monitor will be there to help you resolve these issues.

How to Monitor HTML Canvas for Load and Uptime
Are you responsible for ensuring your HTML Canvas is always available and performing optimally? If so, you need to know how to monitor HTML Canvas for load and uptime. This blog post will explain how you can do that effectively using various monitoring tools.

How to Monitor Website Uptime in 2023
A professional website uptime monitoring tool like ours at Dotcom-Monitor gives your website a serious edge over your competitors because it provides alerts and root-cause analysis that will spark growth for both your website and business.

Why Uptime Monitoring Is Essential for Your Business
Website downtime is a serious concern for businesses as it directly impacts the bottom line and can cause significant downstream effects as users turn to alternatives. Learn why uptime monitoring is essential for your business in this helpful article.
The Top 25 SaaS Affiliate Programs for 2023
Learn all about SaaS affiliate programs and our top 25 picks to earn affiliate income, including our own Dotcom-Monitor and LoadView.

The Importance of Uptime for Your Website
Business operations have been revolutionized by the advent of web-computing services. Many organizations now look to decrease or eliminate expenditure, increase efficiency, and maximize profits by moving their processes online because of the unmatched flexibility and ability to scale the cloud affords them.

How the Great Firewall of China Affects Performance of Websites Outside of China
The Great Firewall of China, or as it’s officially called, the Golden Shield Project, is an internet censorship project to block people from accessing specific foreign websites. It is the